Statistics I Chapters 1-3 Midterm Review
1/94
There's no tags or description
Looks like no tags are added yet.
Name | Mastery | Learn | Test | Matching | Spaced |
|---|
No study sessions yet.
95 Terms
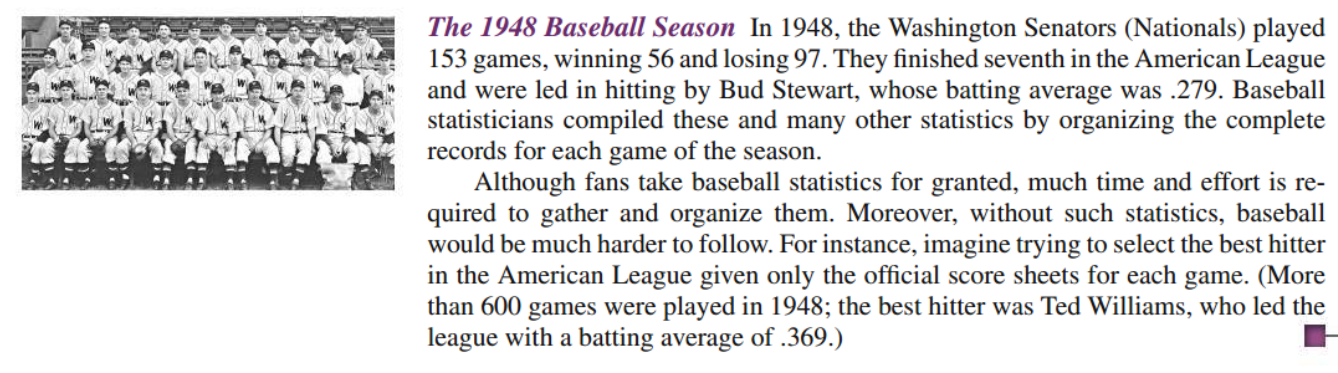
Descriptive Statistics
This consists of methods that organize or summarize data- includes the construction of graphs, charts, and tables and the calculation of various descriptive measures such as averages, measures of variation and percentiles.
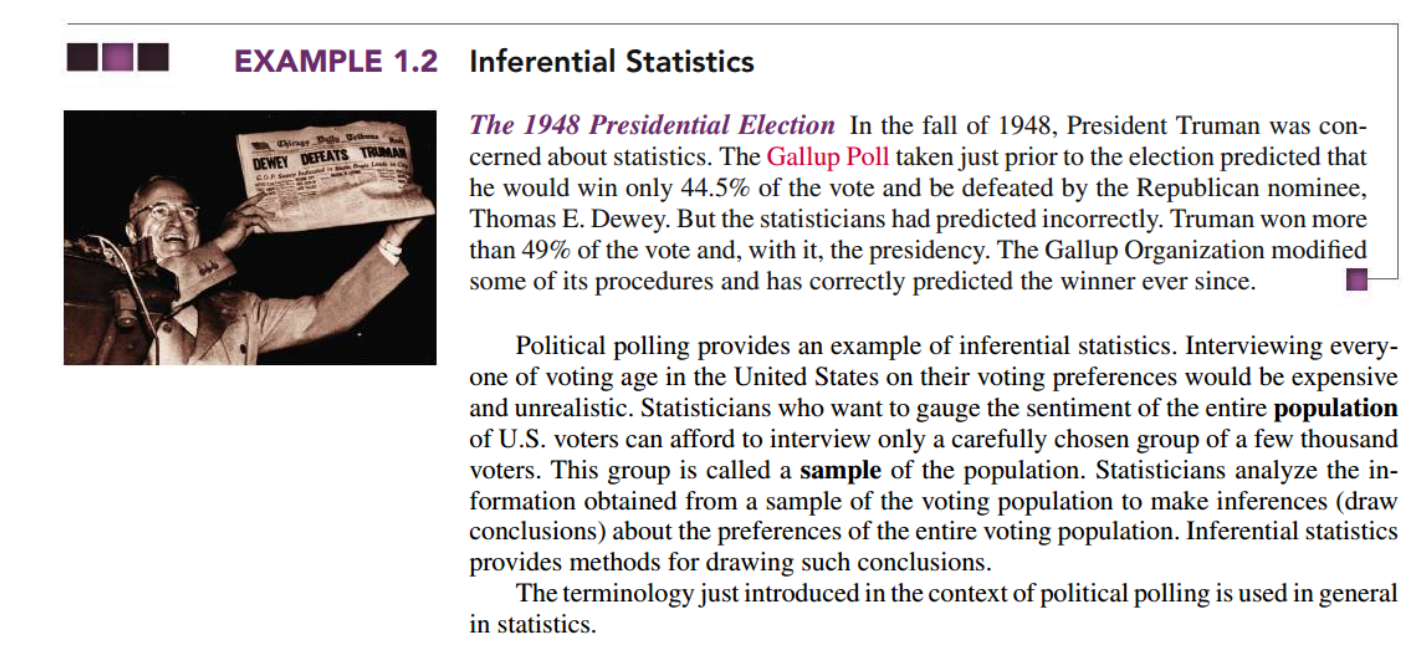
Inferential Statistics
This consists of methods for drawing & measuring the reliability of conclusions about population based on the information obtained from a sample.
Descriptive
You want to study the popularity of different leisure activities by gender. You distribute a survey and ask participants how many times they did each of the following in the past year:
Go to a library
Watch a movie at a theater
Visit a national park
Would this be considered Descriptive or Inferential Statistics?
Descriptive
For the variable of gender, you list all possible answers on the left hand column. You count the number or percentage of responses for each answer and display it on the right hand column.
Gender | Number |
Male | 182 |
Female | 235 |
Other | 27 |
From this table, you can see that more women than men or people with another gender identity took part in the study.
Would this be considered Descriptive or Inferential Statistics?
Inferential Statistics
Education | Percentage | ||
Postgraduate education | 65% | ||
College graduate | 52% | ||
Some college education | 32% | ||
High school or less | 20% |
A recent article postulated that support for a certain scientist's theories increases with level of education. The table shown to the right provides percentages of a certain country's adults, by educational level, who believe that evolution is a scientific theory well supported by evidence. Is this Descriptive or Inferential? |
Observational Study
Researchers simply observe characteristics and take measurements in a sample survey in this type of study.
Example: The professor could count the number of students in his class (basically observe the students in his class)
Designed Study
Researchers put treatments & controls and then observe the characteristics of the sample in this type of study.
Example: If there were sick people and you want to to see what happens when you give one part of the sample a treatment and have the other part of the sample not be treated.
Population
The collection of ALL the individuals or items under consideration in a statistical study.
Sample
The part of the population where most of the information/data can be obtained.
For example, if you were to find the data of a whole population, but you cannot use the whole population to find the data of said population, you would grab a group of people from that population to determine the data of that population (which is known as…)
Representative Sample
This is a type of sample where it’s reflecting almost all the characteristics of the population under consideration.
Simple Random Sampling
A sampling procedure for which a sample of a given size is equally likely to be the one obtained.
Simple Random Sample
A sample obtained by simple random sampling.
Simple Random Sampling with Replacement
When a member of the population can be selected more than once.
Example: If we were told to list the possible samples with replacement of a size of 2, the samples would be G,G G,L G,S, etc.
Simple Random Sampling Without Replacement
When a member of the population can be selected at most once.
Example: We are given 5 top Oklahoma state officials and we have to sort them out based on sample sizes of 2. We would probably write them as G,L G,S G,A etc.
A Table of Random Numbers
Another way to obtain a simple random sample when the population is large is by using a table of randomly chosen digits.
Random-Number Generators
A program that can be used to obtain simple random samples.
Systematic Random Sampling
This method takes less effort to implement (steps):
1) Divide the population size by the sample size and round the result to the nearest whole number, m.
2) Use a random-number table or a similar device to obtain a number, k, between 1 and m.
3) Select for the sample those members of the population that are number k, k+m, and k+2m
We would divide the population size by the sample size- 728/15 and get 48 when rounded.
How would you use step one to find the sample?

You can use a random number generator and find a number in between 1-48.
How you you use step 2 to find the sample?
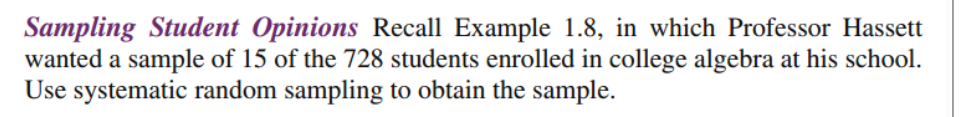
Select the sample those members of the population that are numbered k, k+m, k+2m - so we start with 22 and add until we have 15 numbers.
How would you do step 3 to solve this sample?
Cluster Sampling
This type of sampling is useful when members of a population are widely scattered geographically.
Step by Step Process:
Step 1: Divide the population into groups (clusters)
Step 2: Obtain a simple random sample of the clusters
Step 3: Use all of the members of the clusters obtained in step 2 of the sample.
Stratified Sampling
This is often more reliable than cluster sampling:
Step 1: Divide the population into subpopulations (strata)
Step 2: From each stratum, obtain a simple random sample of size proportional to the size of the stratum; that is, the sample size for a stratum equals the total sample size times the stratum size divided by the population size
Step 3: Use all the members obtained in Step 2 as the sample
Stratum Sample Size
= Total Sample size x (size of stratum)/(population size)
Experimental Units
A subject, (when human) the individuals or items on which the experiment is performed
Treatment
When you want to use an experimental condition on a group.
Control
This is when 2 or more treatments should be compared.
Randomization
The experimental units should be randomly divided into groups to avoid unintentional selection bias in constituting the groups
Replication
A sufficient number of experimental units should be done to ensure that randomization creates groups that resemble each other closely and increase the chances of detecting any differences among the treatments.
Response Variable
The characteristic of the experimental outcome that is to be measured or observed.
Factor
A variable whose effect on the response variable is of interest in the experiment.
Levels
The possible values of a factor
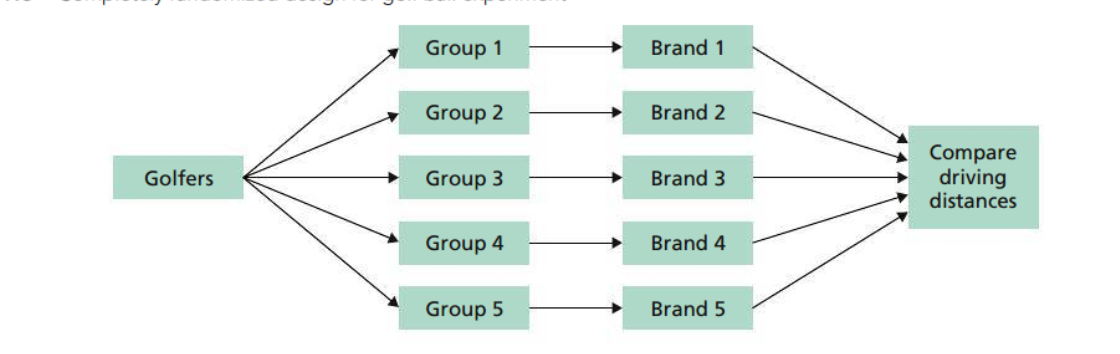
Completely Randomized Design
All the experimental units are assigned randomly among all the treatments.
Randomized Block Design
Where the experimental units are assigned randomly among all the treatments separately within each block.
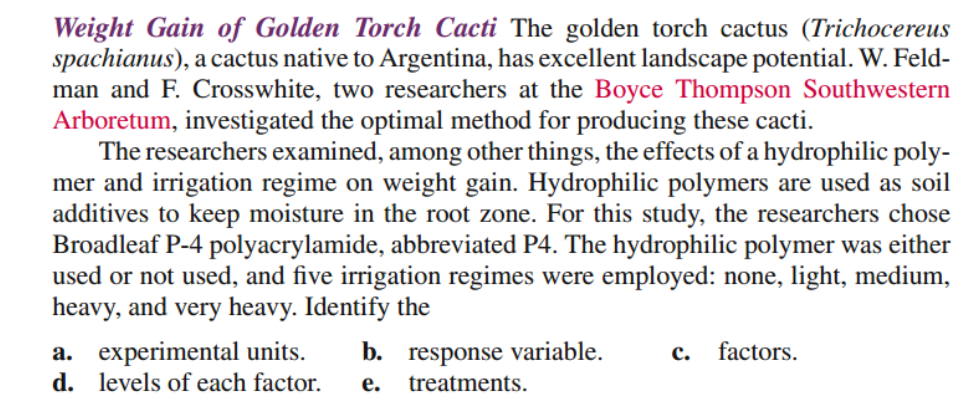
The cacti
a) Identify the Experimental Units in this study

Weight gain
b) What is the Response variable?

Hydrophilic Polymer & Irrigation regime
c) What are the factors?
Hydrophilic Polymer: Used or not used/Irrigation Regimes: none, light, medium, heavy, very heavy.
d) Identify the levels

10
e) What are the number of treatments?
Qualitative Data
NONNUMERICAL information
Quantitative Data
NUMERICAL information
Discrete Variables
Type of quantitative data that can be listed/numbered. This is like the number of cars owned by a family, or the number of students in an introductory statistics class.
Continuous Variable
A type of quantitative variable whose possible values form some interval of numbers. This involves a measurement of something, such as the height of a person, the weight of a newborn baby, or the length of time a car battery lasts.
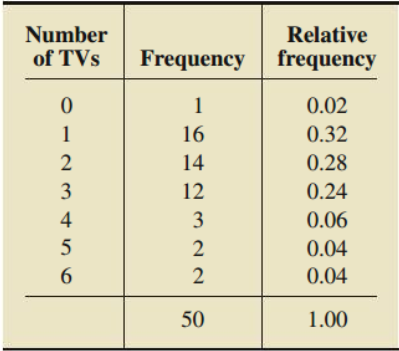
Frequency
The number of times a particular value occurs in a dataset.
Frequency Distribution
A listing of the distinct values and their frequencies:
Step 1: List the distinct values of the observations in the data set in the first column of a table.
Step 2: For each observation, place a tally mark in the second column of the table in the row of the appropriate distinct value.
Step 3: Count the tallies for each distinct value and record the totals in the third column of the table.
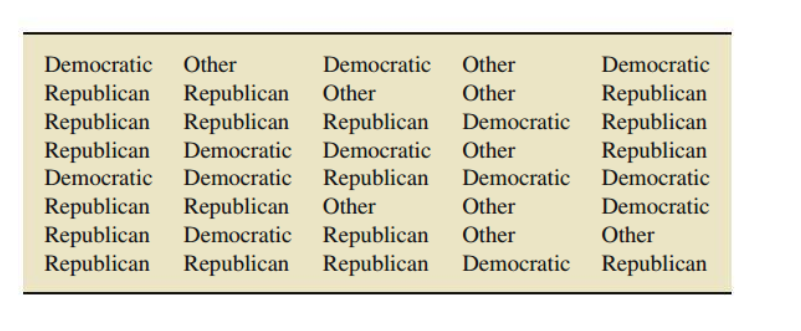
We can count each of the categories and sort them out by tally marks
How would you find the frequency of this graph for each of these variables?
(Frequency)/(# of observations)
How is the relative frequency solved?
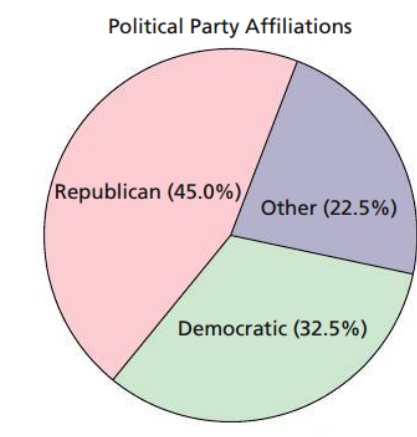
Pie Charts
A disk divided into wedge-shaped pieces proportional to the relative frequencies of the qualitative data. These types of charts are used to list the relative frequencies.
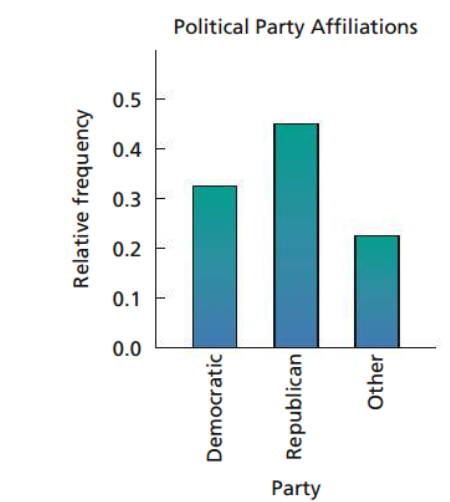
Bar Chart
This type of chart displays the distinct values of the qualitative data on a horizontal axis and the relative frequencies (or frequencies or percents) of those values on a vertical axis. The relative frequency of each distinct value is represented by a vertical bar whose height is equal to the relative frequency of that value. The bars should be positioned so that they do not touch each other.
Classes
The observations are grouped and these as the distinct values of qualitative data.
Single-Value Grouping
We use the distinct values of the observations as the classes, a method completely analogous to that used for qualitative data. Single-value grouping is particularly suitable for discrete data in which there are only a small number of distinct values
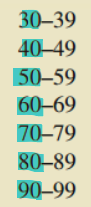
Limit Grouping
This type of grouping is particularly useful when the data are expressed as whole numbers and there are too many distinct values to employ single-value grouping.
Upper Limit/Cutpoint
The largest value that can go into a class
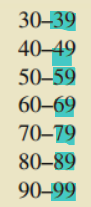
Lower Limit/Cutpoint
The smallest value that can go into a class.
Class Width
The difference between the lower limit of a class and the lower limit for the next-higher class.
Class mark
This is the average of the 2 class limits of a class.
Cutpoint grouping
This is similar to limit grouping, but used especially for continuous variables. (expressed in decimal)
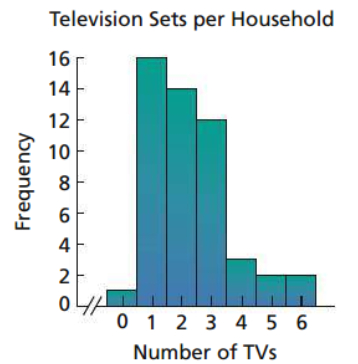
Histogram
This type of organizing and summarizing data is similar to bar charts, except the bars in this type touches
Dotplot
A graph in which each observation is plotted as a dot at an appropriate place above a horizontal axis. Observations having similar values are stacked vertically.
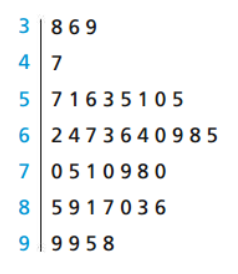
Stem-and-Leaf Diagram
Each observation is separated into 2 parts - a stem which consists of all but the rightmost digit and the leaf - the rightmost digit.
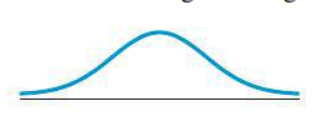
Bell-Shaped
What type of distribution shape is this?
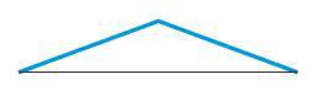
Triangular Shaped
What type of distribution shape is this?
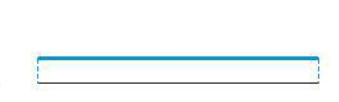
Uniform (or rectangular)
What type of distribution shape is this?
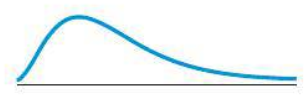
Right Skewed
What type of distribution shape is this?
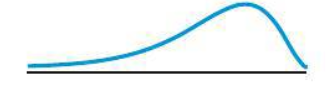
Left Skewed
What type of distribution shape is this?
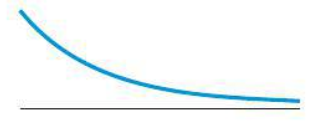
J-shaped
What type of distribution shape is this?
Truncated Graph
When a graph is seen to be cut off like for example- the vertical axis starts at 7% instead of 0%.
Pictogram
A symbol representing an object or concept by illustration. Sometimes these graphs can be misleading due to improper scaling - like how 4 times as many homes will be built this year as last.
Median, Mean, Mode
What are the 3measures for central tendency?
The mean
In a right skewed graph, would the mean or median be greater?
Median
In a Left skewed graph, would the mean or median be greater?
Median & Mode
Which measures are resistant to outliers?
Range and Standard Deviation (we can also include sample variation)
What are the 2 measures of variation?
Chebyshev’s Rule
For any quantitative data set and any real number greater than or equal to 1, at least 1−1/k2 of the observations lie within the standard deviations to either side of the mean, that is, between ¯x−ks and ¯x+ks
The Empirical Rule
This rule can only be used when talking about Bell-Shaped Distributions
Q1
This Quartile is obtained by the median of the bottom half of the data set.
Q2
This Quartile is obtained by the median of the ENTIRE data set.
Q3
This Quartile is obtained by the median of the top data set.
Interquartile Range
This can be obtained by subtracting Q1 by Q3
Lower Limit Equation
Q1 -1.5 x IQR
Upper Limit Equation
Q3 - 1.5 x IQR
It helps us look for outliers in the dataset.
Why having the lower and upper limits in a box plot or a data set is useful?
Minimum, Q1, Q2, Q3, Maximum
What is the 5 number summary?
Some methods that are used are graphical designs, charts, etc.
What are some methods used in descriptive statistics?
Descriptive statistics gives the summary of a data, but inferential statistics can use that data to make an inference about a population based on a sample.
What are the 2 ways in which descriptive statistics & inferential statistics are interrelated?
causation
Observational studies can reveal only association, whereas designed experiments can help establish ___________________.
It would be too exhausting to get information from everyone in a population if that were the case.
Why is a census not the best way to gather information?
Cyclical Pattern
Systematic random sampling is easier to execute than simple random sampling and usually provides comparable results. The exception is the presence of some kind of ___________________ in the listing of the members of the population.
represnt
Ideally, in cluster sampling, each cluster should _____________ the entire population.
homogenous
7 Ideally, in stratifed sampling, the members of each stratum should be ________________ relative to the characteristic under consideration
The bars having spaces was to show that the data was it’s own category while in histograms, the data was shown to be continuous that can fall within a range.
Why do the bars have spaces and the histograms don’t?
Data is grouped to make sure it’s organized and take out irrelevant data.
Why is data grouped under certain circumstances?
Qualitative data cannot be measured numerically - so it would be harder to make limits and cutpoints- qualitative data is more descriptive and gives nonnumerical information.
Why don’t cutpoints, limits, marks, midpoints, etc. make sense for qualitative data?
1) Making sure eat data unit is put in a certain class.
2) Making sure that class sizes are relatively equal.
3) Understanding an appropriate number based on distribution and class sizes.
What are the most important guidelines in choosing the classes for grouping quantitative data set?
This is to show the pattern of the data given.
Why is the use of smooth curves useful to describe shapes of distributions?
Due to the sample being LARGE, it would be similar to the original population - meaning that it is possible for it to have a bell-shaped distribution. The larger the sample, the more accurate it is to the original population.
Supposed that a variable of a population has a bell-shaped distribution. If you take a large simple random sample from the population, would it have the same shape as the population or a different shape.