omis 430 — 5
1/14
There's no tags or description
Looks like no tags are added yet.
Name | Mastery | Learn | Test | Matching | Spaced | Call with Kai |
|---|
No analytics yet
Send a link to your students to track their progress
15 Terms
capacity planning
how much work (ceiling/upper limit) a business (operating unit) can handle
capacity needs to be + example
equipment (tools), space (room/storage), employee skills
types of capacity + describe
design (maximum output designed to handle) (what could it do on it’s best day no errors?)
effective (realistic output) (what can we do on a normal day?)
actual (actual amt produced) (what we actually did do?)
determinants of capacity
facilities (layout, size, building)
product/service design (complexity of prod/serv. easy-more cap. hard-less cap.)
process (tech efficiency, work methods)
human (worker skills, training, mgmt quality)
supply chain (reliable suppliers)
operational (scheduling)
external (gov regulations, environment, market conditions)
In regards to planning service capacity, how are services different from manufacturing products? and how does this impact our capacity planning?
a. services; cannot be stored (not tangible, must be near customers, time per customer varies (depends)
b.you have to consider more factors! you have to manage people, volume, time, space and fluctuating demand! whereas with products you just focus on managing machines + inventory
what's the goal within capacity planning?
to match capacity and demand
overcapacity and undercapacity definitions
oc — more resources and products, wasted money
uc — less capacity and no room, cramped
outsourcing definition
when you have another company or external supplier produce a good or service instead of doing it yourself
Bottleneck
Part of the process or system that limits the overall output because it’s slower than other parts (imagine a ship in a bottle and it slowing down at that one small part)
Economies of Scale vs Diseconomies of Scale
eos — whenever output is below ideal (optimal) level, producing more items decreases cost per unit.
(eos = too many toys=cheap price)
dos — when output is above ideal (optimal) level, making more items increases cost per unit
(dos = making too many toys = higher costs to create)
cost volume relationships basic idea + assumptions
A. costs can rise in diff steps (not smoothly) when your production capacity (need for more machines n staff) increases. & each capacity step has a different break even point (how many units you need to sell to cover the costs)
B. assumptions (in a fairytale world)
1.costs predictable for each step
2..each step has a specific maximum capacity limit (# of machines)
3..selling price per unit is constant (stays same)
4.all units produced are sold (everything made is sold)
Suppose you want to purchase a new computer that will cost $5,000. It will be used to process written orders from customers who will pay $25 each for the service. The cost of labor, electricity and the form used to place the order is $5 per customer. How many customers will we need to serve to permit the total revenue to break-even with our costs?
5000/(25-5)=250 customers
Efficiency and Utilization
•Design Capacity = 50 trucks per day
•Effective Capacity = 40 trucks per day
•Actual Output = 36 trucks per day
36/40=0.90 = 90%
36/50=0.72= 72%
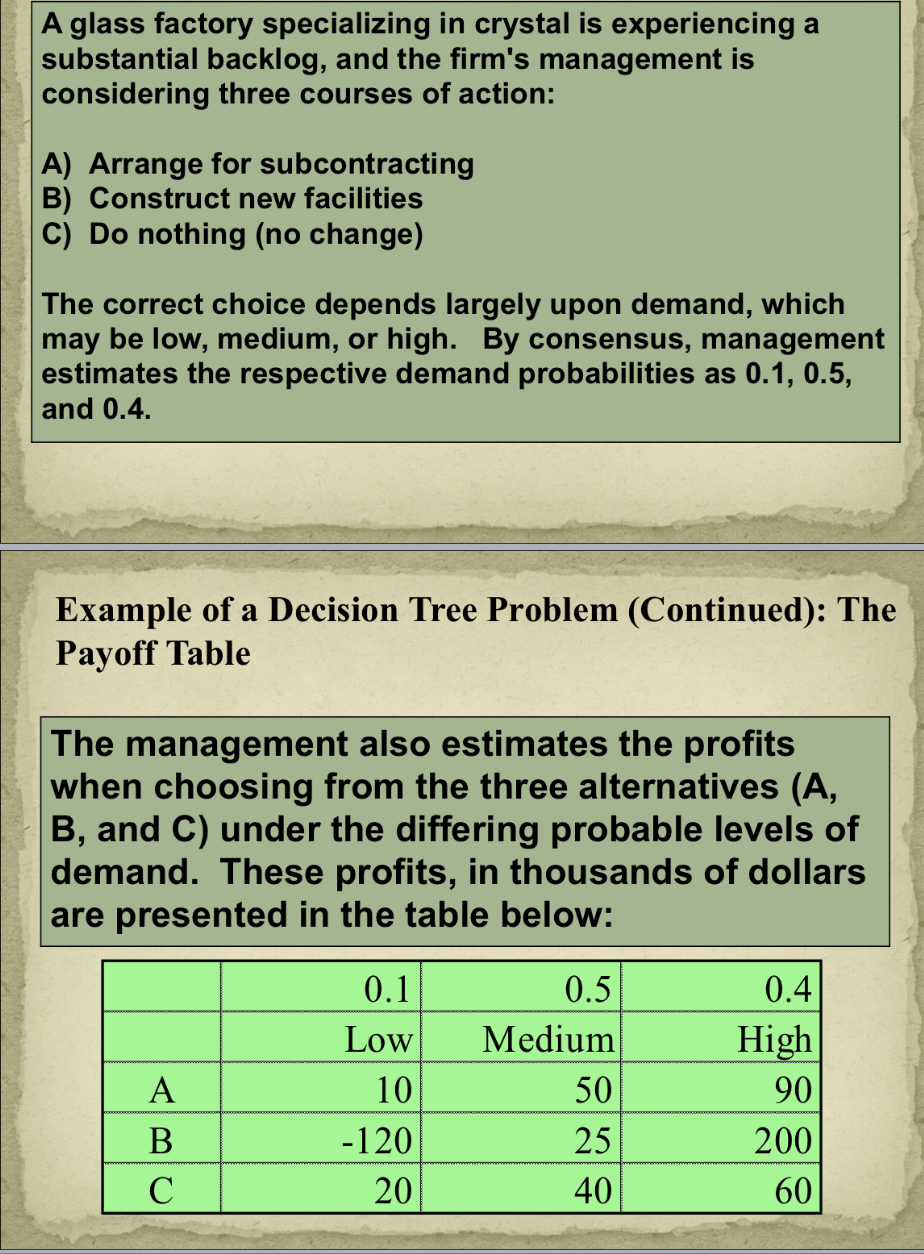
how to do a decision tree problem?
step 1 draw decisions chart
step 2 add possible stsates of nature, probabilities and payoffs
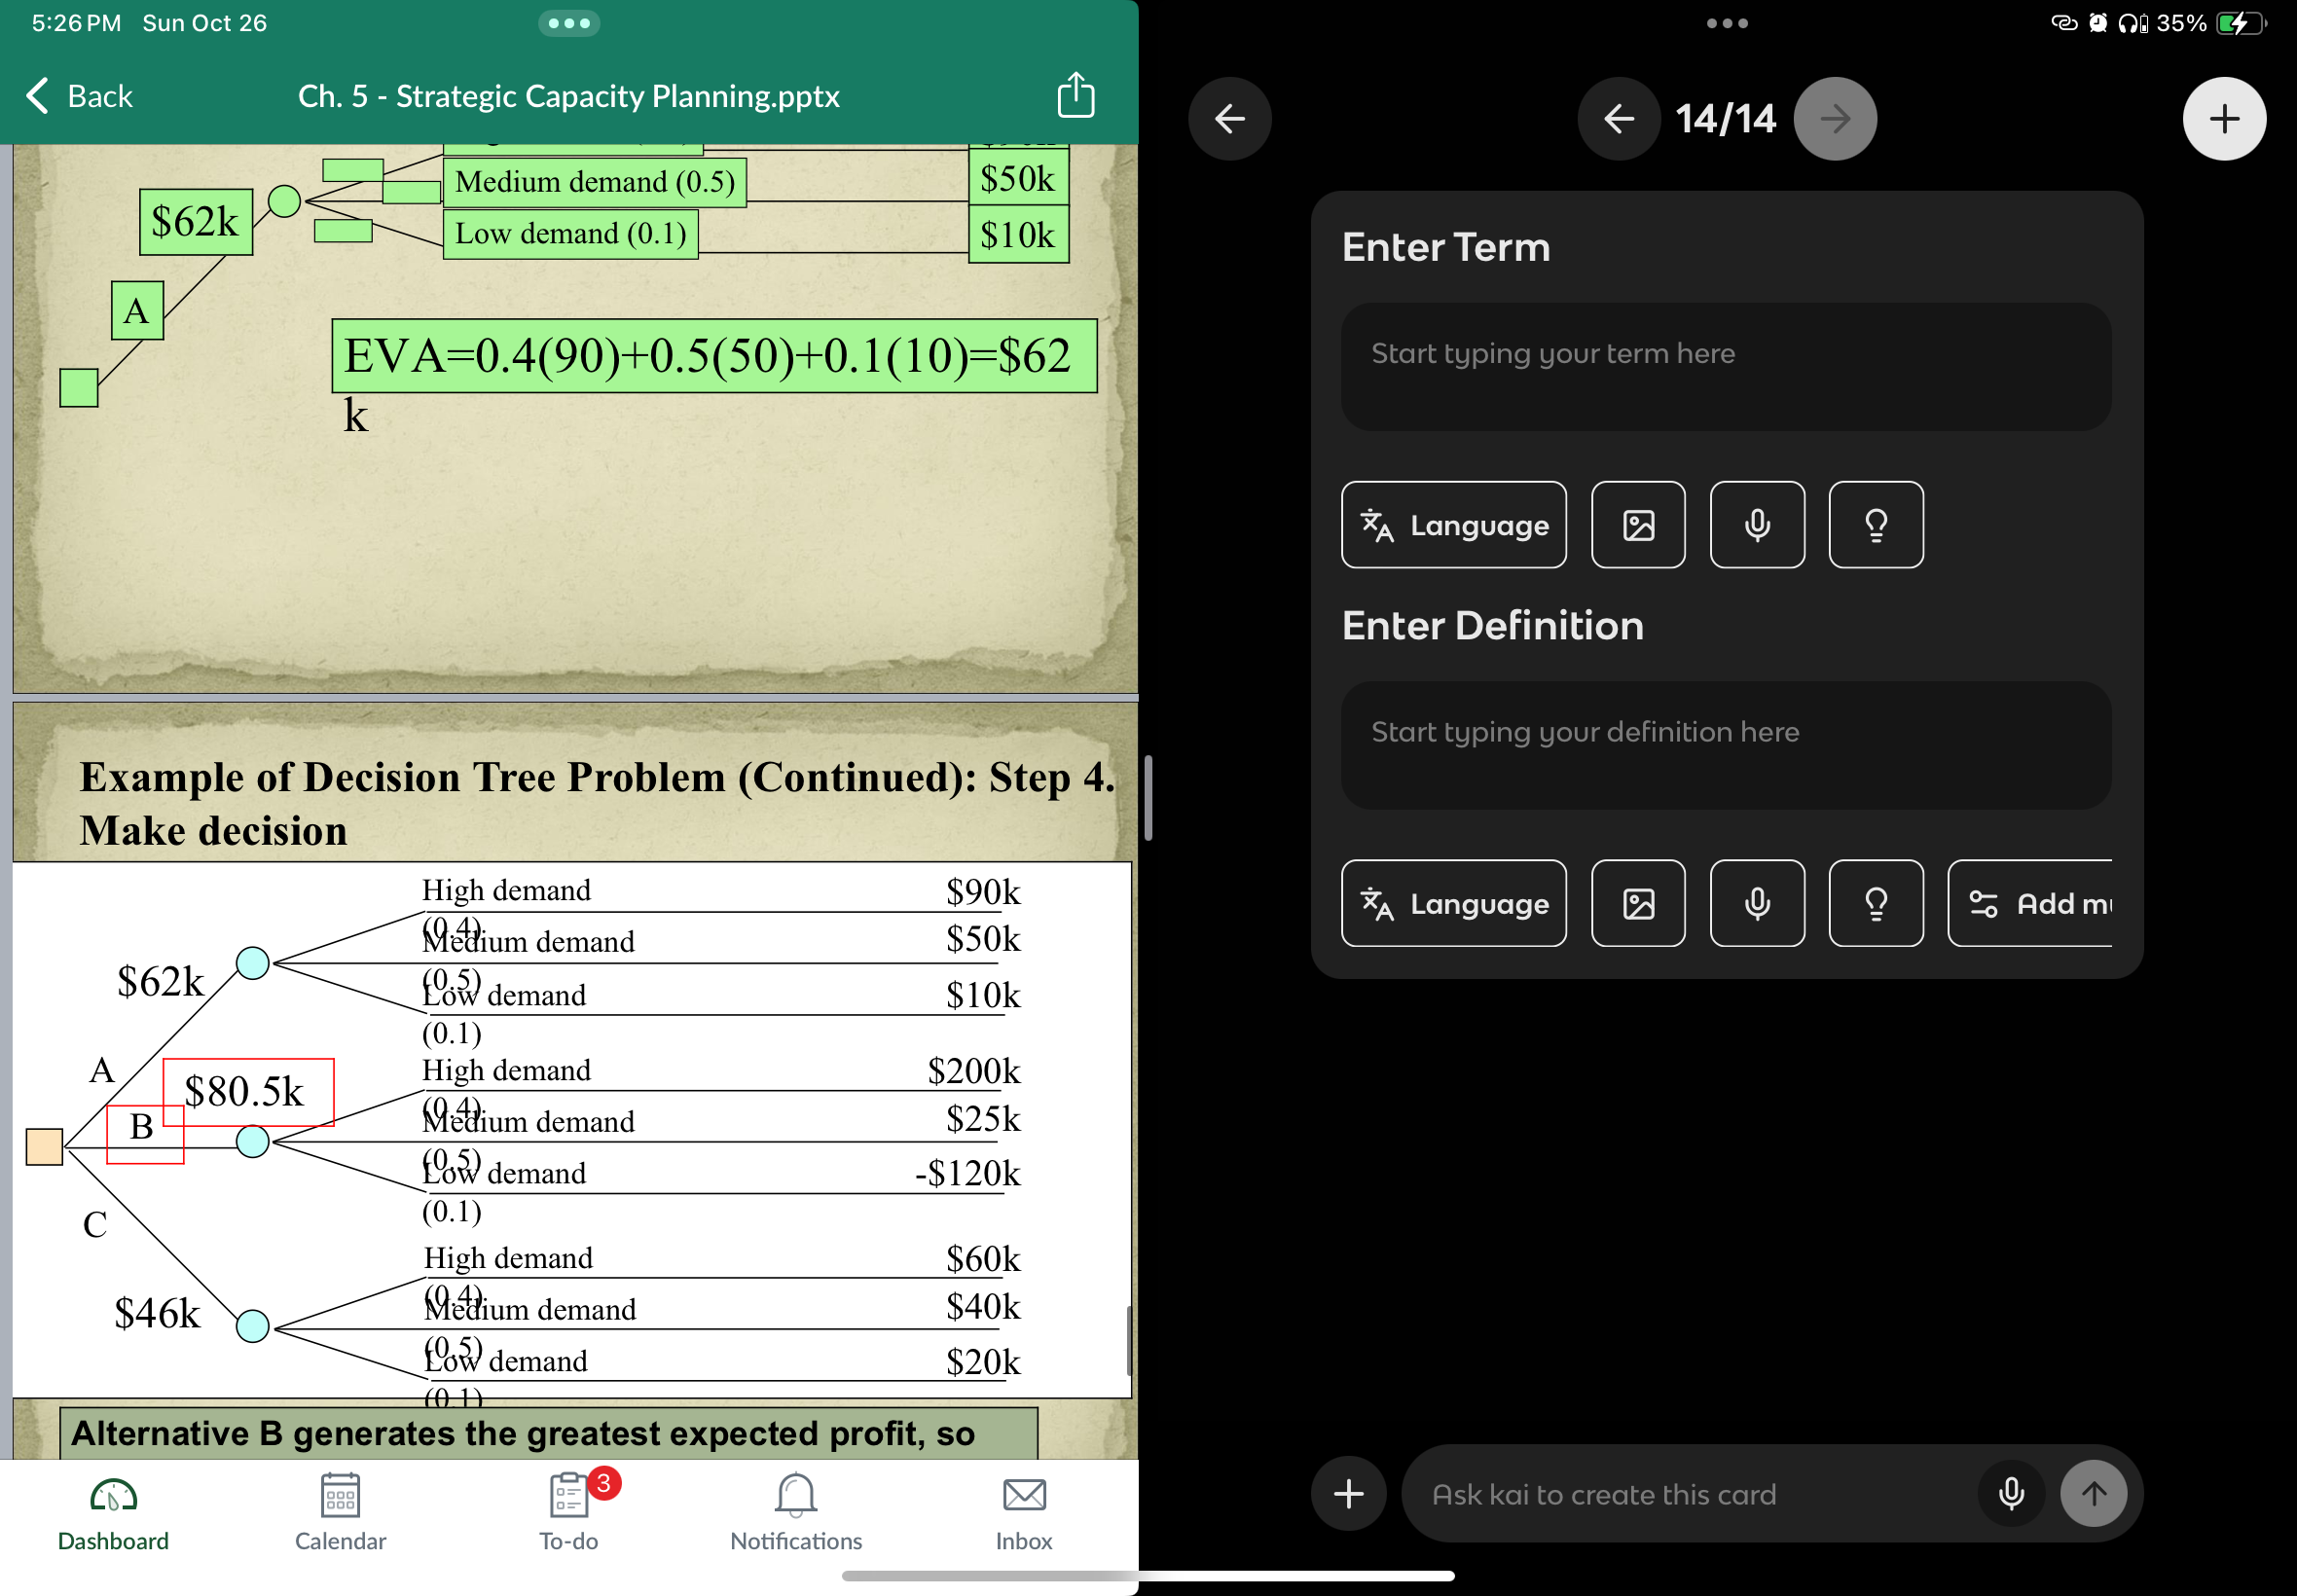
step 3 determine the expected value of each decision
step 4 make decision
key capacity planning questions
•What kind of capacity is needed?
•How much is needed to match demand?
•When is it needed?