Statistics Quiz 1
 Call Kai
 Learn
Learn Practice Test
 Spaced Repetition
 Match
Match Flashcards
 Knowt Play
1/31

There's no tags or description
Looks like no tags are added yet.
Name | Mastery | Learn | Test | Matching | Spaced | Call with Kai | Chat |
|---|
No analytics yet
Send a link to your students to track their progress
32 Terms
Statistics
the science of collecting, organizing, summarizing, and analyzing information to draw conclusions or answer questions
population
the entire group of individuals to be studied
sample
a subset of the group of individuals that is being studied
parameter
a numerical summary of a population
statistic
a numerical study of a sample
individual
a person or object that is a member of the group being studied
descriptive statistics
organizing and summarizing data through tables, graphs, and numerical summaries.
inferential statistics
use methods that take result from a sample and extends them to the population, and measures the reliability of the result
discrete variable
Has either a finite number of possible values or countable number of possible values. The values of these variables typically result from counting.
data
information that describes the characteristics of an individual
continuous variable
Has an infinite number of possible values that are not countable. The values of these variables typically result from measurement.
qualitative variable
allow for classification of individuals based on some attribute or characteristic.
quantitive variable
provide numerical measures of individuals. the measurements can be added or subtracted, and provided meaningful results
variable
the characteristics of the individuals within the population
simple random sampling
a basic probability method where every person or item in a large group has an exact, equal, and independent chance of being chosen
stratified sampling
a probability sampling method where a population is divided into distinct, non-overlapping subgroups called strata based on shared characteristics, and then samples are drawn from each subgroup
Describe a circumstance in which stratified sampling would be an appropriate sampling method.
when your population splits into distinct, non-overlapping subgroups (strata) that affect your study variable
Why are convenience samples ill advised?
they select participants based on easy access rather than random chance, which creates severe bias and makes it impossible to accurately represent a wider population
A frequency distribution lists the _______ of occurrences of each category of data, while a relative frequency distribution lists the ______ of occurrences of each category of data.
number, proportion
In a relative frequency distribution, what should the relative frequencies add up to?
1
frequency distribution
a data table showing how many times values or ranges occur
relative frequency distribution
lists each category or data value along with its proportion or percentage of the total dataset.
“skewed left”?
the lower tail is on the left
all bars are nearly the same
uniform
inverted bell cruve
middle is the lowest
bell curve
middle is the highest
bimodal shape (multimodal)
two distinct peaks
formula for a dice percentage
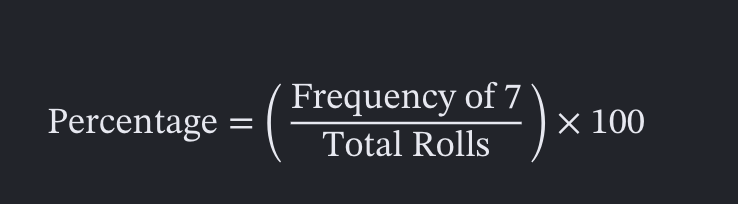
frequency histogram
a visual bar graph of that same data where the bars touch each other
mean
add all numbers then divide by amount of numbers
median
middle number. If even add the two middle numbers and divide by 2
mode
the number that shows the most