Physical Geography - Hazardous Environments
1/160
There's no tags or description
Looks like no tags are added yet.
Name | Mastery | Learn | Test | Matching | Spaced | Call with Kai |
|---|
No study sessions yet.
161 Terms
Hazard
A threat that has potential to harm people and the environment
Disaster
A hazard that causes fatalities or extensive financial damage
Risk
The exposure of people to a hazard
Vulnerability
The degree to which conditions make the population less likely to cope or recover from the hazard
Resilience
How well people can recover from a hazard
Geo-Physical Hazard
A potential natural phenomenon that can cause damage to humans and the environment
Disaster Hotspot
A location which is at risk of experiencing two or more geophysical hazards (multi-hazard environment)
Converging Destructive Plate Boundary (C/O)
Example: Nazca and South American Plates
Landforms: Fold mountains (Andes), Ocean Trenches (Peru-Chile), Composite Volcanoes (Misti)
Converging Destructive Plate Boundary (O/O)
Example: Pacific and Philippines Plates
Landforms: Deep Sea Trenches (Mariana Trench) and Island arc (Mariana Island Arc), Composite Volcanoes
Diverging Constructive Plate Boundary
Example: North American and Eurasian Plates
Landforms: North Atlantic Mid Ocean Ridge, Shield Volcanoes
Collision Plate Boundary
Example: Indian and Eurasian Plates
Landforms: Fold Mountains (Himalayas)
Hotspot - Intraplate (O)
Example: Ring of Fire (Pacific)
Landforms: Shield Volcanoes, Volcanic Island Arcs (Hawaii)
Hotspots - Intraplate (C)
Example: African Plate (EARV)
Landforms: Shield Volcanoes (East African Rift Valley)
Conservative Plate Boundary
Example: North American and Pacific Plates (San Andreas Fault)
Landforms: Steep slopes and long cliffs, faulting, escarpments
Epicentre
The main area above ground that is hit by the earthquake
Focus
The point underground where the earthquake originates
Seismic Waves
Waves of energy which create the earthquake
P-Waves (Body)
First waves recorded on a seismograph
Travel through the rock, gas, and liquid as waves of compression (back and forth)
Fastest to travel
S-Waves (Body)
Second waves recorded on a seismograph
Flows more slowly with a rolling motion, passing through solids only
Love Waves (Surface)
Lateral shaking
Combined, they are undulated rolling waves
Raleigh Waves (Surface)
Vertical waves
Combined, they are undulated rolling waves
Richter Scale
Logarithmic scale that uses numbers (1-10) 2 is 10x more powerful than 1, 3 is 100x more etc.
Objective scale recorded via seismograph
Measures size/intensity of the event
Measures from the focus
Mercalli Scale
Subjective scale based on perception
Each level is a description of impacts
Measures levels from 1-12
Measures from the epicentre
8 Factors affecting the strength of earthquake damage
Population Density
Rock Type and Sediment
Economic Development
Types of Buildings
Epicentre Distance
Strength, Depth, Number of Aftershocks
Time of Day
Secondary Hazards
Population Density (Factor affecting earthquake strength)
The number of people exposed to the hazard e.g. Haiti, Port-au-Prince.
Rock Type + Sediment (Factor affecting earthquake strength)
Bedrock properties
Slope/areas prone to liquefaction
Economic Development (Factor affecting earthquake strength)
HIC vs LIC
Preparedness, levels of protection
Early warning systems
Ability to rebound after the event
Types of Building (Factor affecting earthquake strength)
Varying levels of protection
Building standards/materials used
Heights of buildings
Epicentre Distance (Factor affecting earthquake strength)
Populations exposed to risks
Waves impact infrastructure, etc.
Strength, Depth, and Aftershocks (Factor affecting earthquake strength)
Deeper earthquakes mean that waves have to travel further and aren't as bad
Time of day (Factor affecting earthquake strength)
Response time is slower at night
Primary Hazards of an earthquake
Ground Shaking
Ground Fracture/rupture
Secondary Hazards of an earthquake
Tsunamis
Fires
Aftershocks
Building collapse
Mass movements
Soil liquefaction
Spread of disease
Soil Liquefaction
Soil liquefaction is the violent shaking of the ground, making relatively solid material such as rock and clays become unconsolidated (Christchurch, New Zealand, 2010)
Landslides Avalanches - Gorkha, Nepal, 2015 CASE STUDY: Setting and Causes
Setting: It had a magnitude of 7.8 and occurred about 80km northwest of Kathmandu. Shallow earthquake with focus approx. 8km down
Causes: It was caused by a release of built up stress along a fault line between the Indian and Eurasian plates creating an earthquake
Landslides Avalanches - Gorkha, Nepal, 2015 CASE STUDY: Primary and Secondary Impacts
Primary: Major Earthquakes
Secondary: Several avalanches triggered on Mt. Everest, killing at least 19 people and over 250 in Langtang Valley
Hundreds of thousands made homeless
Landslides Avalanches - Gorkha, Nepal, 2015 CASE STUDY: Short and Long-Term Responses
Short Term: 90% of the Nepalese army helped with rescue
Long Term: Rebuilding the Economy - Over $5 billion
The Tohoku (Sendai) Tsunami, Japan, 2011 CASE STUDY: Setting and Causes
Setting: March 2011, Japan
Earthquake + Tsunami
Causes: A 9.0 earthquake occurred under the Pacific Ocean 100km due east of Sendai on northern Honshu's eastern coast
A 400-500km segment of the North American plate was being dragged down by the Pacific plate and suddenly slipped out
The Tohoku (Sendai) Tsunami, Japan, 2011 CASE STUDY: Primary and Secondary Impacts
Primary: Ground shaking
Secondary:
Collapsing buildings
Half a million people homeless
Over 1 million homes without running water
Food shortages
The Tohoku (Sendai) Tsunami, Japan, 2011 CASE STUDY: Short and Long-Term Responses
Short Term:
International recovery teams
People being evacuated
Long Term:
Schemes set up to plan long-term growth (Reconstruction Design Council)
More effective planning of defenses for the future
How is a Tsunami Created
A submarine earthquake thrusts a plate upwards, displacing a column of water.
The column rises and sinks, creating a ripple of small waves, with low height but long length of 100 miles, in all directions.
The wave travels very fast, 500 mph, and approaching shallow land slows, until the wave length catches up, with the wave getting taller and taller.
Christchurch, New Zealand, 2010/11 Earthquake CASE STUDY: Setting and Causes
Setting:
2010 earthquake -> Saturday morning (4:35 am).
2011 earthquake -> Tuesday lunchtime.
On the Australian and Pacific plate boundary
Causes:
Earthquakes result from deformation along different thrust faults at the destructive plate boundary where the Pacific plate subducts beneath the Australian plates. Focus was no deeper than 5km
Christchurch, New Zealand, 2010/11 Earthquake CASE STUDY: Primary and Secondary Impacts
Primary Impacts:
Vertical and horizontal shaking
Major tremors
Secondary Impacts:
Vertical and horizontal shaking at the same time destroyed 100 major buildings
Shaking = 4x more intense than Haiti
Liquefaction undermined the foundations of many buildings
Numerous aftershocks made recovery difficult
Water and sewerage systems were damaged and power cuts affect homes.
Liquefaction forced road surfaces upwards, slowing rescue efforts
$US 40 billions - rebuilding and insurance
Christchurch, New Zealand, 2010/11 Earthquake CASE STUDY: Short and Long-Term Responses
Short-Term:
Electricity and mains water supplies were repaired quickly.
Fully serviced mobile homes housed the homeless until the repairs were finished.
Many services were restored within a week
The international airport was undamaged, overseas aid was sent quickly
Long-Term:
Buildings were rebuilt to withstand earthquakes with a minimum height of 28 metres
Earlier planning for emergencies, so all forces can come together quickly and work together
Haiti, Port au Prince, 2012 Earthquake CASE STUDY: Setting and Causes
Setting: January 12th at 4:53 am, epicentre 25km from the city of Port au Prince, western Haiti, 7 on the Richter scale
Causes: Tiny fragment of the Caribbean plate moving eastwards along a fault line on the destructive plate boundary with the North American plate. The shallow depth of movement caused much damage from shaking, which lasted for nearly a minute.
Haiti, Port au Prince, 2012 Earthquake CASE STUDY: Primary and Secondary Impacts
Primary Impacts:
200,000 to 316,000 deaths
100,000 injured
Buildings falling on people
Houses destroyed
Water and food sources were disrupted
Power lines disrupted
Secondary Impacts:
1.5 million homeless
Hospitals and government buildings were destroyed
Looting and violence were a problem for relief workers trying to keep stocks of food and water safe
Disease outbreak - cholera outbreaks caused by poor sanitation in the temporary tented camps
The international airport only had one runway, limiting planes carrying aid
Many rebuilt buildings collapsed after the earthquake as they were constructed cheaply and had little support
Haiti, Port au Prince, 2012 Earthquake CASE STUDY: Short and Long-Term Responses
Short Term:
Largely dependent on overseas aid (medical aid + financial aid)
Temporary accommodation/emergency shelter
IMF potentially gave money/economic aid
Bottled water + purification tablets + food packages
Search + rescue teams
Long Term:
Clearing up the rubble
Rehoming into temporary accommodation (280,000 still without permanent housing after 3 years)
Infrastructural projects/rebuilding main cost
Reducing the new unemployment rate by creating more factories
Kick-starting the economy again
Hazard Management Cycle
Preparedness (Before the event) → Response (During event) → Recovery (Straight after event) → Mitigation (Long after the event)
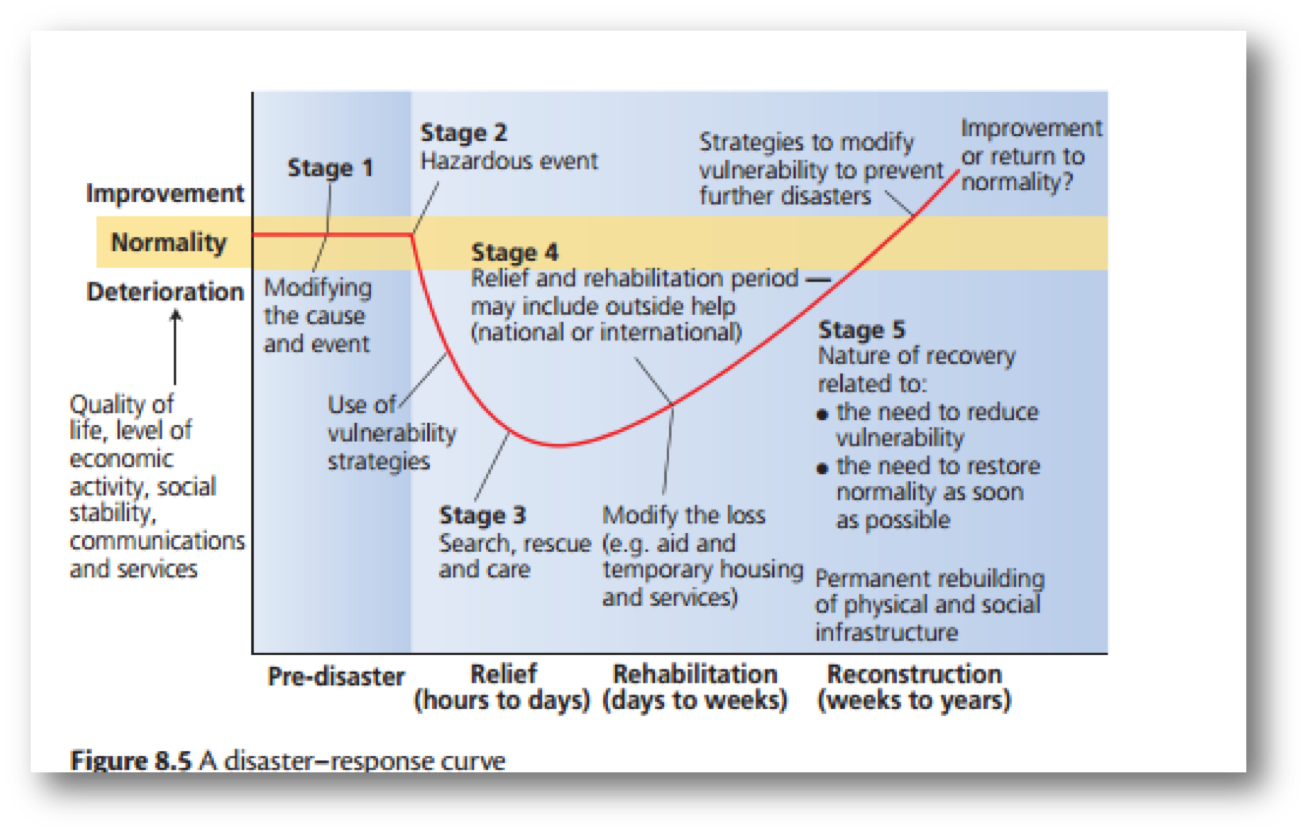
Park Model
Stage 1 of the model is what normal day-to-day life is like in an area, involving quality of life, economic activity, and social stability before the event takes place
Stage 2 of this model is the start of this hazardous event and sees the deterioration from normality, the extent of which can vary depending on the preparedness of each certain area
Stage 3 involves search and rescue of the event, for example, saving people from rubble, etc.
Stage 4 is the relief period of the event, which may include outside help (the World bank)
Stage 5 is a return to normality (or as close as possible) as some countries such as Haiti will never return to what they once were, decreasing their actual normality
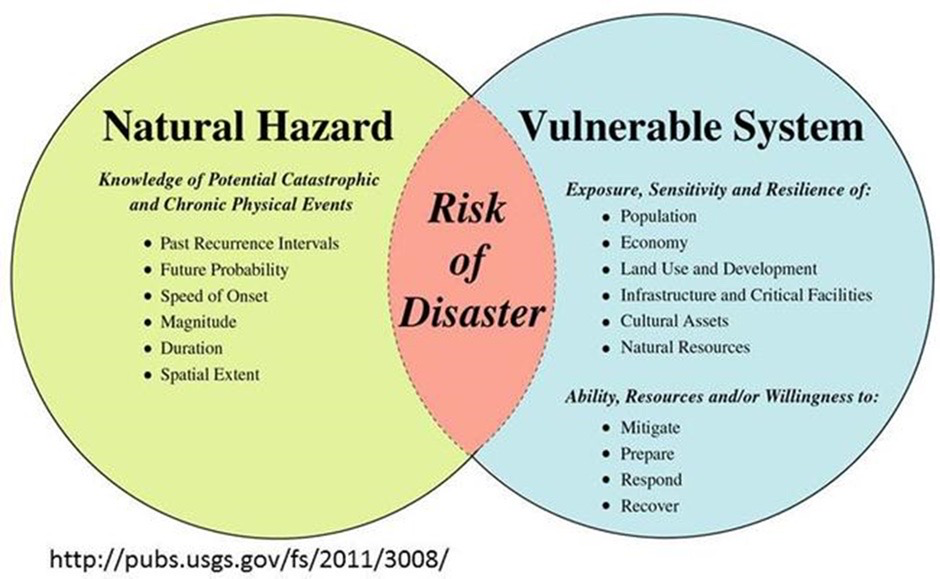
Degg Model
The Degg Model shows that a natural disaster only occurs if a vulnerable population is exposed to a hazard
The 3 P’s
Prediction
Seismic gap theory
Monitoring of earthquake zones
Hazard mapping
Preparedness
Community Education
Home Safety Improvements
Warning Systems
Protection
Strengthening buildings
Safe Houses
Land-use zoning
Landslides Case Study
Gorkha, Nepal, 2015
Tsunamis Case Study
Sendai, Japan, 2011 (15,000 deaths with warning system)
Boxing Day, Indonesia, Bandah Aceh, 2005 (250,000 deaths with no warning system)
LIC Case Study
Haiti, Port au Prince, 2012
HIC Case Study (Soil Liquefaction)
Christchurch, New Zealand, 2010
Seismic Gap Theory Case Study
San Francisco 1989
Monitoring of Earthquakes Case Study
Parkfield California 1992 → Unsuccessful
New Zealand’s Earthquake Commission did predict in 1991 there would be an earthquake in Christchurch (but could not say when or what intensity but knew liquefaction would occur)
Hazard Mapping Case Study
California, San Andreas Fault - 150m radius of known faults
Hazards Awareness Day Case Study
Japan on the 1st of September annually
Evacuation points, survival packs, house improvements and warning signs Case Study
Places around Japan
Strengthening Buildings Case Study
HIC – TransAmerican Pyramid in San Francisco, USA withstood the 1989 Loma Prieta earthquake, magnitude 7, with its shock absorbers and swinging building
HIC – Bird’s Nest, Beijing, China Olympic Games 2008, made of two parts
LIC – Confined masonry in Haiti new builds post-2010, or adding wire mesh to adobe clay structures such as Peru
Safe Houses Case Study
New strict codes in Indonesia
Land use zoning Case Study
Christchurch, Japan, Most HICs
What is a Volcano
A volcano is an opening in the earth's crust where magma (a mixture of red hot liquid rock, mineral crystals, rock fragments, and dissolved gasses) erupts onto the earths surface
Shield Volcanoes
Gently sloping sides, large base
Effusive
Basaltic lava
Formed by low-viscosity lava
Diverging constructive margins
1-2 VEI
MAR/Hawaii
Thin part of the lithosphere
Magma rises due to plates moving because of convection currents
As the plate moves, volcanoes are formed, forming island arcs and creating a long chain of extinct volcanoes
Composite Volcanoes
Subduction due to a denser plate being pulled down
Multiple layers of material (composite)
When the plate subducts into the mantle, it melts
Magma rises towards the surface and erupts if it doesn’t cool in time, causing a composite volcano
Lower temperature, cools much quicker, forming steeper sides
Andesitic lava
Ash plumes add onto the sides, hardening and steepening the sides
Nazca - South American -> Volcano Misti
Caldera Volcano (Super)
Characterised by a depression in the ground with a caldera rim
Rhyolitic, lots of tephra
Close to the magma chamber
Caldera can be 50 miles across
Super volcanoes explode at a VEI of 8
Flood Basalt Provinces (Lava plateau)
Very-large-scale hotspot -> travels a great distance
Larger mantle plume across a bigger landscape
Lava floods the ground
Coating the landscape in lava
Decan Traps (India)
Fissure Eruptions
Faults or cracks within the earth’s crust and magma flow up through this crust and effusively leak onto the ground.
Icelandic, VEI 0-2, Basaltic, High lava temp
Reykjanes peninsula
Cinder Cone
Steep slopes with wide craters
It might not have any side vents or parasitic vents, unlike composite
Single main vent
Taal volcano in the Philippines
Lava Dome
Magma has not broken through the surface
Magma continues to expand as it is less dense
Endogenous is when magma stays within the bubble under the crust
Exogenous is when magma breaks through the dome
Slate Mountain, San Francisco
Effusive Eruptions
Lava Type: Basaltic
Mineral Composition: Mafic (Magnesium + Iron)
Silica Content %: <50%
Viscosity: Low
Temperature: 1200C
Eruption Type: Icelandic or Hawaiian
VEI: 1-2
Volume of Material Ejected: 0.0001km3
Volcano Types: Lava plateau, Fissure, or Shield
Inter (Intra) Boundary Type: Diverging Constructive
Landforms: Mid-Ocean Ridge
Example: North American and Eurasian Plate Boundary
Explosive (Andesitic) Eruptions
Lava Type: Andesitic
Mineral Composition: Mixed
Silica Content %: 60%
Viscosity: Intermediate
Temperature: 1000C
Eruption Type: Vulcanian or Vesuvian
VEI: 3-4
Volume of Material Ejected: 0.1km3
Volcano Types: Composite or Cinder Cone
Inter (Intra) Boundary Type: Converging Destructive
Landforms: Trenches, Fold Mountains, Volcanoes
Example: Nazca and South American Plate Boundary
Explosive (Rhyolitic) Eruptions
Lava Type: Rhyolitic
Mineral Composition: Felsic (silicon, oxygen, aluminium, sodium, and potassium)
Silica Content %: >70%
Viscosity: High
Temperature: 800C
Eruption Type: Plinian or Pelean
VEI: 5-8
Volume of Material Ejected: >1000km3
Volcano Types: Lava Dome, Caldera Super Volcano
Inter (Intra) Boundary Type: Converging Destructive
Landforms: Trenches, Fold Mountains, Volcanoes (Super)
Example: Philippines and Pacific Plate Boundary
VEI
Volcanic explosivity index
1 - 8 (1 includes smaller ranges of tephra - 8 is larger size/volume)
Explosion Range
Icelandic (effusive) - Plinian (Most explosive)
Volume of ash cloud/size of ash cloud increases as you move through scale
Earthquakes (Primary Hazard of Volcanoes)
The shaking of the ground due to energy/pressure release
Seismic activity through magma travelling through side vent
E.g. Vesuvius
Gases (Primary Hazard of Volcanoes)
Sulphur and Carbon dioxide released into atmosphere (Toxic)
E.g. Lake Nyos, Cameroon
Lava (Primary Hazard of Volcanoes)
A’a- Develops rigid block-like structures
Pahoehoe - Pillow-like, lower silica content - more basaltic
Hawaii vs. Mt. St. Helens
Solids (Primary Hazard of Volcanoes)
Tephra is any airborne solids
Ash, cinders, lapilli, volcanic blocks, volcanic bombs
E.g. Super Calderas and Strato-Cones (Composite)
Pyroclastic Flows (Primary Hazard of Volcanoes)
Very hot (800-1500C) gas charged, high velocity flows (up to 200 mph) made from a mixture of gases and tephra
E.g. Composite volcanoes
Atmospheric Ash Fallout (Secondary Impact of Volcanoes)
Big ash clouds get trapped in the earth’s atmosphere and can spread over big distances
E.g. Eyjafjallajokul 2010, Ash closed European airspace for 1 month
Lahars (Secondary Impact of Volcanoes)
Moving flow of mud, any material that has been carried through a lava melt and potentially snow melt
E.g. The Nevado del Ruiz volcano, in the Andes.
Lahars 50 M thick travelled at 60km per hour down existing river valleys
Acid Rainfall (Secondary Impact of Volcanoes)
Volcanic eruptions release sulphur dioxide gas from both lava flows and from violent eruptions. These gases can pollute the air and result in the formation of acid rain
E.g. Hunga Tonga-Hunga Ha'apai Volcano, sending plumes 18 km into the air
CASE STUDY: Primary Effects, Lake Nyos, Cameroon 1986 – Volcanic Gases
Location: Lake Nyos, Cameroon, is located just north of the equator in West Africa.
Type of Volcano: Created by deep crater lakes on top of a volcano within the Oku Volcanic Field
Description of events: Huge volumes of volcanic gas came bubbling up through and came down the side into the valley and a town. This happened because carbon dioxide is heavier and denser than oxygen; therefore, it stayed on the ground. It happened on the 21st of August 1986
Effects: It suffocated around 1700 people and 3000 cattle, however, plants were unaffected.
CASE STUDY: Secondary Effects, Nevada del Ruiz, Colombia, 1985 – Lahars
Location: Nevada del Ruiz is a volcano in Colombia that rises to an altitude of 5400 metres and is covered by an icecap 30 metres thick, covering an area of about 20km2
Type of Volcano: Subducting oceanic Nazca plate and the continental South American plate
Description of events: The volcano erupted in 1986, causing the ice to melt from the heat. This condensing volcanic steam, ice-melt and pyroclastic flows combined to form lahars that moved down the mountain, engulfing the village of Chinchina.
Effects: This killed 1800 people and destroyed the village. The conditions worsened as further eruptions melted more ice, creating larger lahars that were capable of traveling further down the mountain into the floodplain of the Rio Magdalemna.
Predicting Eyjafjallajokull, 2010 - How are the Volcanoes being monitored?
Infrasound devices around Iceland (4)
Infrasound detects pressure variations from volcanic eruptions
Waterflow centres and electro radars
Ash measurements to help aerospace
Seismic recordings
Data analysed at IMO 24/7
Volcanoes are monitored prior to, during, and after events
How to Manage Volcanoes
Prediction:
Changes in ground
Geochemical Changes
Mitigation:
Control minimisation
Hazard mapping
Building structures
Forecast
Frequency Forecasting
Harmonic Tremors (Prediction)
Earthquakes provide very strong evidence of an impending eruption
e.g. Mt St Helen's, 1980
Ground Deformation (Prediction)
Bulging can be detected by rising magma, measured using an instrument called a tiltmeter
e.g. Mt St Helen’s, 1980
Satellite Monitoring (Prediction)
Cameras set up allow remote viewing of volcanoes allowing scientists to see small signs
e.g. Mt St Helen’s
Geochemical, gravitational and temperature changes (Prediction)
Instruments can be used to study the physical properties associated with rising magma.
Hydrology and gases changes (Prediction)
Changes in physical and chemical properties in water such as rising temps
Measuring volumes of gas such as sulphur dioxide
e.g. Pinatubo, 1991
Control Minimisation (Mitigation)
Cooling/diverting lava flows with water on a mass scale as well as explosive
Issuing warnings
Evacuation safe zone
e.g. Mt Eldfell, 1973, Mona Loa, ongoing, Mt Etna, 1992
Hazard Mapping (Mitigation)
Can develop risk assessments for vulnerable populations
Using past evidence to see who is most at risk
e.g. Monserrat
Building Structures (Mitigation)
Concrete shelters
Diversion channels
Evacuation routes
Air monitoring
Boreholes
Trenches
Hot springs
Frequency Forecasting (Forecasting)
Similar to flood events, one can look at the frequency of historic eruptions to get a sense of when the pressure has built to the extent of an eruption.
e.g. Yellowstone Supervolcano has a frequency of around 725,000
Impacts of mass movements
Primary
Movement of sediment
Rockfall
Destruction
Agricultural degradation
Fatalities
Secondary
Rebuilding projects
Impacts on education
Hits to economic development
Disruption on transport routes for a long time
The Bingham Copper Mine Landslide and Rockfall, Salt Lake City, Utah, USA, April 2013 CASE STUDY: Background
Setting: Located in Bingham, Utah, USA and it occurred on the 10th of April 2013
Type of mass movement: Rock avalanches
The Bingham Copper Mine Landslide and Rockfall, Salt Lake City, Utah, USA, April 2013 CASE STUDY: Causes and Impacts
Causes: Overmining, decreasing internal resistance, causing rocks to break
Primary Impacts: Two main slides, Roads around the mine are blocked, Infrastructure blocked
Secondary Impacts: Rockfall triggered 19 smaller earthquakes, Economic disruption the area, A second slide