bio 211 FOR EXAM 1
 Call Kai
 Learn
Learn Practice Test
 Spaced Repetition
 Match
Match Flashcards
 Knowt Play
1/204

There's no tags or description
Looks like no tags are added yet.
Name | Mastery | Learn | Test | Matching | Spaced | Call with Kai | Chat |
|---|
No analytics yet
Send a link to your students to track their progress
205 Terms
What are the critical elements of the scientific method?
Back:
Self-correcting
Iterative
Built on reason and evidence
Aware of its limitations
Built on feedback between models and data
Is the scientific method a rigid, step-by-step process?
No. It is iterative and self-correcting, meaning scientists repeatedly revise ideas based on new evidence and feedback.
What is a model?
A simplified representation of the world that helps us describe, understand, predict, and test mechanisms in complex systems.
Why are models useful even though they are simplified representations?
Models help us:
Organize knowledge
Explore consequences of assumptions
Generate testable predictions
Guide data collection and experimental design
Integrate information across different scales and systems
What does the statement "All models are wrong" mean?
Models are simplifications of reality, so they cannot perfectly represent the real world.
If all models are wrong, why are they useful?
They are useful because they simplify complex systems in ways that allow us to understand, predict, test, and analyze them.
What can models help scientists do with their assumptions?
Models allow scientists to explore the logical consequences of their assumptions.
How do models help generate hypotheses?
Models can generate testable predictions that can be compared with real-world data.
How do models help with experimental design?
They can guide data collection and experimental design by showing what information is needed to test predictions.
How do models connect to data?
Models and data provide feedback to each other. Data can support, challenge, or improve a model.
What are the four major types of models in ecology discussed in this lecture?
Back:
Conceptual
Analytical
Simulation-based
Statistical
What is a conceptual model?
A model that represents ideas or relationships qualitatively, often using diagrams or visual representations.
Food webs
Flow diagrams
What is an analytical model?
A model that uses mathematical equations to describe relationships and mechanisms in a system.
Lotka-Volterra models
Logistic growth models
What is a simulation-based model?
A model that uses computer simulations to represent and explore how a system behaves, often when the system is too complex to solve directly with simple equations.
Spatial models
Agent-based models
What is a statistical model?
A mathematical framework used to describe relationships in data, quantify uncertainty, and make inferences or predictions.
Regression
Bayesian hierarchical models
What is the logistic growth equation?
dtdN=rN(1−N/K)
N= population size
r= intrisic rate of population growth
k= carrying capacity
What do statistics and data analysis help us do?
They help us:
Describe patterns
Test hypotheses
Make informed decisions
Account for uncertainty
What is the role of uncertainty in statistics?
Statistics provides a framework for reasoning under uncertainty.
What is statistics?
The theoretical framework for reasoning under uncertainty.
What is data analysis?
The application of statistical principles to real datasets to extract insights and support inference.
What are descriptive statistics?
Statistics used to organize and summarize data.
They can summarize patterns in data using things such as means, medians, variability, graphs, and tables.
What are inferential statistics?
Statistics that use probability to determine how confident we can be that our conclusions about data are correct or generalizable.
What is the main difference between descriptive and inferential statistics?
Summarizes the data you have.
Inferential: Uses data and probability to draw conclusions beyond the observed data.
What are the two major branches of statistics discussed?
Descriptive statistics and inferential statistics.
What is a histogram?
A graph that shows the distribution of numerical data by grouping observations into intervals called bins.
What is bin width?
The range of values included in each bin of a histogram.
How does changing bin width affect a histogram?
Smaller bins: Show more detail but may make the graph noisy.
Larger bins: Make the overall pattern easier to see but may hide important details.
Why is choosing an appropriate bin width important?
Because the bin width determines how much information the histogram reveals or hides about the data
What can happen if the bins are too narrow?
The histogram may reveal too much detail, making random variation or noise look important.
What can happen if the bins are too wide?
The histogram may hide important features or patterns in the data.
What makes a histogram useful?
A useful histogram shows the important overall pattern and distribution of the data without hiding important features or showing unnecessary noise.
What is a scatter plot?
A graph that displays the relationship between two quantitative variables, with each observation represented by a point.
What can a scatter plot help us identify?
It can help reveal:
Relationships between variables
Trends
Patterns
Clusters
Outliers
What does each point on a scatter plot represent?
Usually, one observation with a value for each of the two variables
What is an outlier?
An observation that is unusually far from the other observations in a dataset.
Why should we identify outliers?
Outliers can:
Reveal extreme skew in a distribution
Identify data collection or entry errors
Provide insight into interesting features of the data
Can an outlier always be considered an error?
No. An outlier may be an error, but it may also represent a real and interesting feature of the data.
What should you do when you find an outlier?
Investigate it rather than automatically removing it. Determine whether it is a data error or a meaningful observation.
What are the key elements of scientific inquiry discussed in BIO 211?
Models
Hypotheses
Inferences
Observations
Experiments
Predictions
OBSERVATION
info or evidence obtained by observing or measuring the natural world
hypothesis
a testable expalantion for an observation or phenomenon
prediction
statementabout what we expect to observe if a particular hypothesis or model is correct
experiment
a structured way of collecting evidence to test predictions or hypothesis
inference
conclusion or interpration drawn from observations and evidence
model
simplified representation of a system that can be used to explain, predict, and test ideas about that system
Why is science uncertain?
Science is uncertain because it is built on limited reasoning and limited data.
Why does indirect information increase uncertainty in science?
Scientific explanations often rely on indirect information, meaning we may not observe the phenomenon directly, increasing uncertainty.
Why isn't scientific evidence always straightforward?
Evidence is not always neat or unambiguous. The same evidence may sometimes be consistent with multiple explanations.
What does it mean that evidence is "not always neat and unambiguous"?
Data may be messy, incomplete, variable, or open to multiple interpretations.
What decision must scientists make about evidence?
Scientists must decide what qualifies as justified evidence for a particular conclusion.
Why must scientists consider alternative explanations?
Because the observed evidence may be explained by more than one hypothesis. Considering alternatives helps avoid incorrect conclusions.
Does uncertainty mean scientific knowledge is useless?
No. Uncertainty is an inherent part of science. Scientists use evidence, reasoning, models, and statistical methods to quantify and manage uncertainty.
What are the two models for the cause of peptic ulcers presented in class?
Model 1: Peptic ulcers are caused by stress or turmoil in one's life.
Model 2: Peptic ulcers are caused by an infection.
Why might scientists compare competing models?
To determine which model better explains the available observations and evidence.
If two models explain the same observation, what should scientists do?
Collect additional evidence or make predictions that distinguish between the models.
What is the purpose of comparing models?
To determine which model provides the better explanation and predictions based on available evidence.
What are the three reasons for identifying outliers?
Identify extreme skew
Identify data collection/entry errors
Gain insight into interesting features of the data
What are the major sources of uncertainty in science mentioned in lecture?
Limited reasoning
Limited data
Indirect information
Ambiguous evidence
Decisions about what counts as justified evidence
Alternative explanations
What is the difference between a hypothesis and a prediction?
Hypothesis: A proposed/testable explanation.
Prediction: What we expect to observe if the hypothesis is correct.
What is the difference between an observation and an inference?
Observation: What we measure or directly observe.
Inference: A conclusion we draw from those observations.
What is the main purpose of experiments in scientific inquiry?
To test predictions and hypotheses by collecting evidence.
What is the big idea behind "comparing models"?
Models make predictions → observations/experiments provide data → data are used to evaluate and compare the models
mean
arithmetic average of a set of values. add all values and divide by the number of values
how mean be undertsood as a balance scale
mean is point where the data would balance if each observation had equal weight
median
middle value when data are arranged in ascending order
if there is even number of observations when finding the median-
the median is average of the two middles values
mathematical definition of the median
values that minimizes the sum of absolute deviations from all observations
diff bw mean and median
mean- avergae of all values, senstive to extreme values
median- middle value, more resistant to extreme values
why mean is sensitive to extreme values
because every observation contributes to the calculation, so unsually large or small values can pull the mean toward them.
imagine 2,3,4,5,6 has mean of 4
and other person has 2,3,4,5,100 now mean is 22.8
before extreme value mean is 4
after extreme is mean 22.8
most of the data are still between 2 and 5 but one extreme value pulled the mean way up
shape of distribution— modality
the number of peaks (modes0 in a distribution
unimodal distribution
distribution with one main peak
bimodal
distribution with two main peaks
skewness
measure of the assymetry of a distribution
What determines whether a distribution is right-skewed or left-skewed?
direction of the long tail
positive/ right skew
A distribution with a long tail extending to the right.
negative/ left skew
long tail extending to the left
symmetric distribution?
distribution whose shape is approximately balanced on both sides of its center.
How do you determine the direction of skewness from a histogram?
Look at the long tail:
Tail right → right/positive skew
Tail left → left/negative skew
Which measure is often more useful for a severely skewed distribution
median- becasue it is less affected b extreme values
Which measure is often more useful for a symmetric distribution?
mean
Why is the median considered a robust statistic?
Because it is less affected by extreme observations or outliers.
Why might the median be preferred when reporting salaries?
Salaries can be strongly right-skewed because a small number of people may earn extremely high salaries, which can pull the mean upward.
central tendency—-
3 common measures
mean, median, and mode
mode
value that occurs most frequent in dataset
central tendency
way of describing the center or typical value of a distribution
Which of the following is NOT a measure of central tendency: mean, median, mode, or interquartile range?
IQR
What does the interquartile range measure?
Spread/variability of the middle 50% of the data, not central tendency.
When should you generally use the mean vs. median?
Symmetric distribution → Mean
Skewed distribution → Median
What happens to the mean and median when there are extreme values?
The mean is strongly affected, while the median is much less affected.
what to look for when describing the shape f a distribution
modality, skewness, and symmetry
R commands
setwd()- sets for working directry
c()- creates/ combines values into a vector
sqrt()- square root
round()- round numbers
sum()- add values
mean ()- arithemetic mean
data. frame()- creates a data/ frame
hist()- creates a histogram
R used for?
R is a programming language used for statistics, data analysis, calculations, and data visualization.
working directory
The folder R uses as the default location for reading and saving files.
function in R?
A block of code that performs a specific task
vector
A list of values of the same type; it is the simplest data structure introduced in the recitation.
types of data sets - univariate
one set of data - describe the data
ex- SVL length of salamander
Bivariate
2 sets of data - describe data + correlate the 2 types of data
ex- svl vs elevation
multivariate
more than 2 sets of data- describe the data + many options
ex- svl vs elevation and species and diet and etc

histogram is quantitative continuous data- decimal
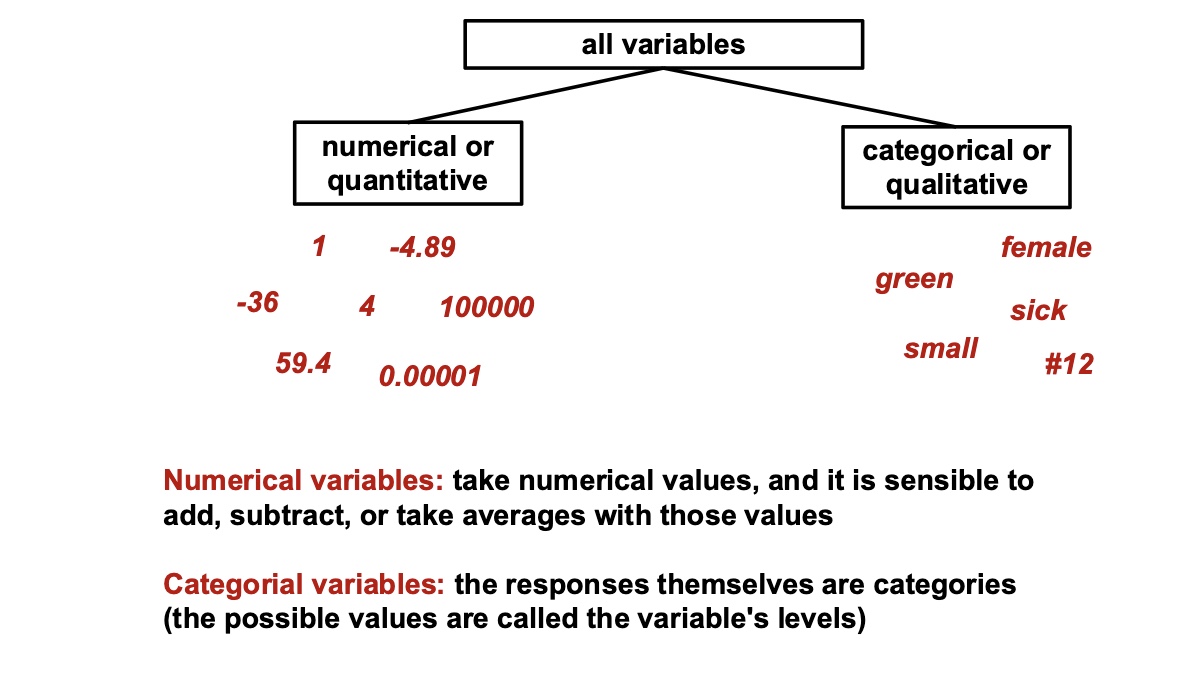
bar plot- order of counting , bars represent counts of categories
Types of data