Test #3: Chapters 8-9
1/51
There's no tags or description
Looks like no tags are added yet.
Name | Mastery | Learn | Test | Matching | Spaced |
|---|
No study sessions yet.
52 Terms
Correlation is the relationship between two variables whereby a
change in ONE VARIABLE is associated with a CONCURRENT change in the other
Correlation is measured
as to direction and the degree of association
Scatterplot is a graph with
plotted values for two variables that are being compared
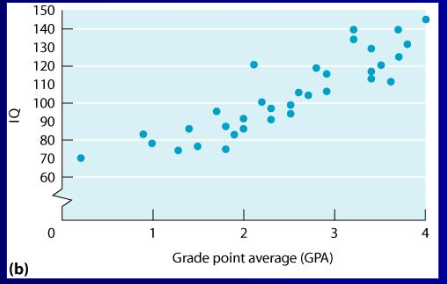
This shows a
positive correlation
What is the concurrent change for positive correlation?
Same Direction
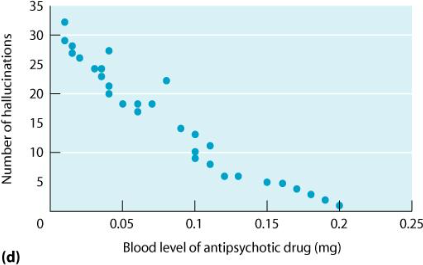
This shows
Negative Correlation
What is the concurrent change for negative correlation?
Opposite directions
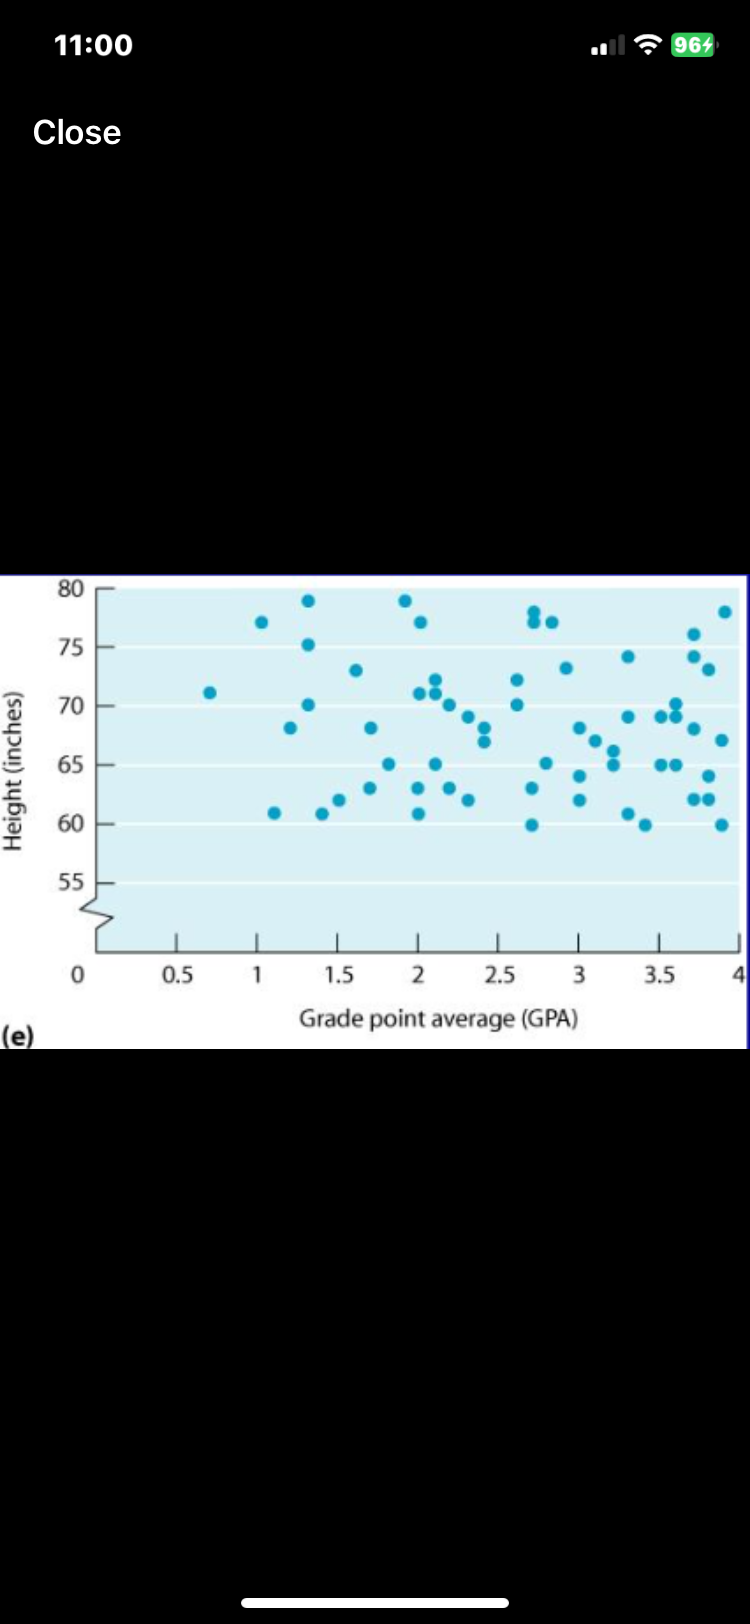
This shows
Zero Correlation
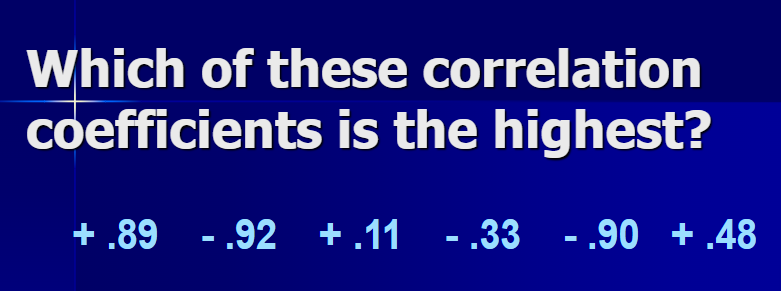
-.92
(Look at the number rather than the sign)
What is r
Correlation Coefficient
Significance of r:
Computes
degrees of freedom = n - 2
Significance of r:
Critical value =
table R
Significance of r:
Computed r(df) >
Critical value
Correlation is NOT
causation
What is the coefficient of determination (r²) in statistics?
measures the part of the variance of one variable that can be explained by the variance of a related variable.
Why does the critical value of r increase as sample size decreases?
A correlation by chance is more likely
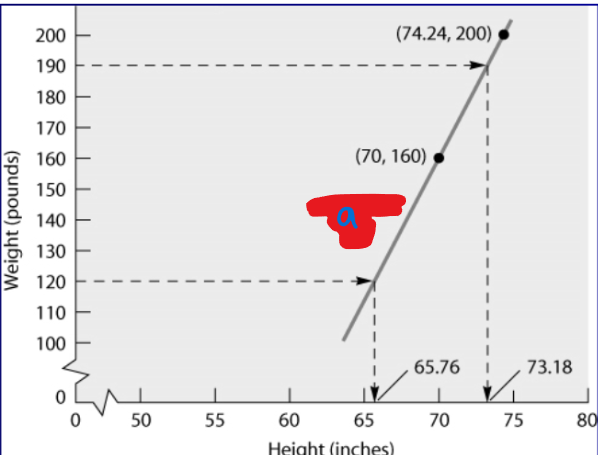
Linear regression
makes predictions based on linear relationships
Linear Regression:
The value of the correlation between _____
two variables adjusts the prediction
Linear Regression:
The higher the correlation,
the more accuracy
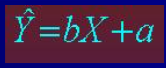
Regression Equation
Positive Correlation is also called
Direct Correlation
Negative Correlation is also called
Indirect Correlation
Correlations look at
straight line relationships
Degree of association is
how strong 2 things are related
Significance is related to
strength and consistency
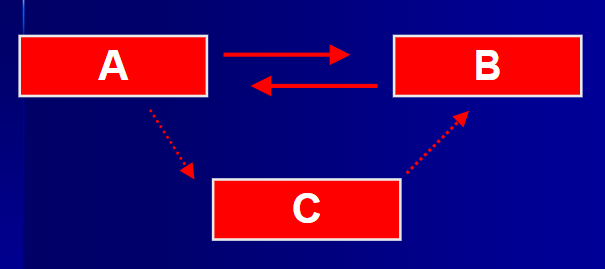
What is this called
Directionality Problem or Third Variable Problem
n
number of PAIRS of scores
Level of Significance for One-Tailed Test
.05
95% certain
Level of Significance for One-Tailed Test
.01
99% certain
Significance of r
The computed r should be greater than
critical value
What are the regression coefficients?
b & a

(Y Hat)
Predicted value of Y
b
slope of regression line
b
the amount of change in _____________
Y associated with a 1-unit change in X
a
the y intercept of the regression line
a is the predicted value of _____________
Y when x = 0
X
the value of X used to predict Y
Regress means
to go back to
What is a?
Regression Line
Two different lines:
one to predict x and one to predict y
Standard Error of the Estimate
standard deviation we put around our prediction
Sign of standard error of estimate

What is b/slope
2.1
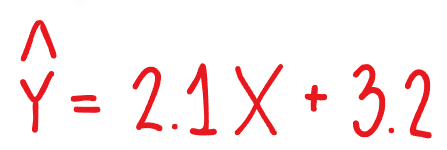
What is the y-intercept?
3.2
Coefficients:
+.83, +100, +10, -105, -90, -.85, +.08
Question:
Which of the following are valid correlation coefficients?
+.83, -.85, +.08
Coefficients:
+.83, +100, +10, -105, -90, -.85, +.08
Question:
Which is the largest?
-.85
Coefficients:
+.83, +100, +10, -105, -90, -.85, +.08
Question:
Which is the smallest?
+.08
What is the coefficient of determination?
r2
If tall people tend to marry tall people and short people tend to marry short people, would that be a positive or negative correlation?
positive correlation
Regression uses ___________ to __________
straight-line correlations; predict things
Regression does not guarantee that
you’re going to be right, it’s MOST LIKELY that you’re going to be right
If we don’t have any other information, our best guess goes back to the
mean/average