Chapter 6: Measuring Association with Continuous Outcomes
1/5
There's no tags or description
Looks like no tags are added yet.
Name | Mastery | Learn | Test | Matching | Spaced |
|---|
No study sessions yet.
6 Terms
Difference of Means
Ex) comparing average birthweight between two large groups
Group A (nonsmokers) Mean birthweight: 3.4 kg
Group B (smokers): mean birthweight: 3.1 kg
compares the average outcome between two groups
Answer: 3.4 - 3.1 = -0.3.
Interpretation: Babies born to smokers weigh on average 0.3 kg less than those born to non-smokers
Useful for the average effect of an exposure
Standardized mean difference (SMD) uHHHHH
Ex)
Group A (nonsmokers) Mean birthweight: 3.4 kg
Group B (smokers): mean birthweight: 3.1 kg
expresses difference relative to variability (standard deviation) within the population
we need the pooled std: weigh each groups std by its sample size
Formula = Difference of the means / pooled std deviation
Answer: (3.4-3.1)/0.5 we obtain 0.6
Interpretation: The birthweight for smokers is 0.6 standard deviations lower than the non-smoking group. This shows a moderate association between smokers’ babies’ birth weights having reduced weight
Standardized mean differences (SMD) associations
SMD < or = 0.2 is small association
SMD > 0.2 but < 0.8 is moderate association
SMD > or = 0.8 is large association
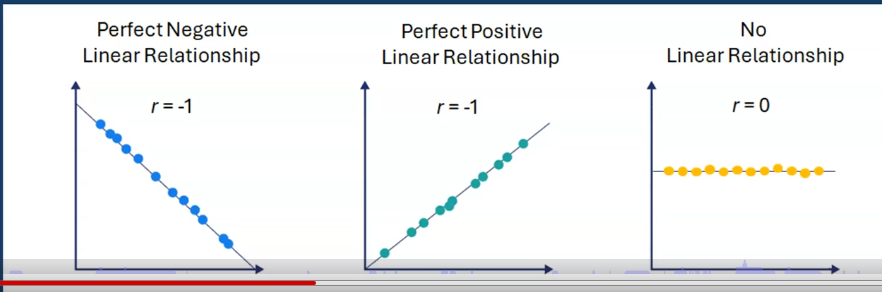
Correlation coefficient ®
measures strength and direction of linear relationshop between two continous variables
Range -1 (perfect negative) to +1 (perfect positive)
an r close to 0 is no association between the two variables
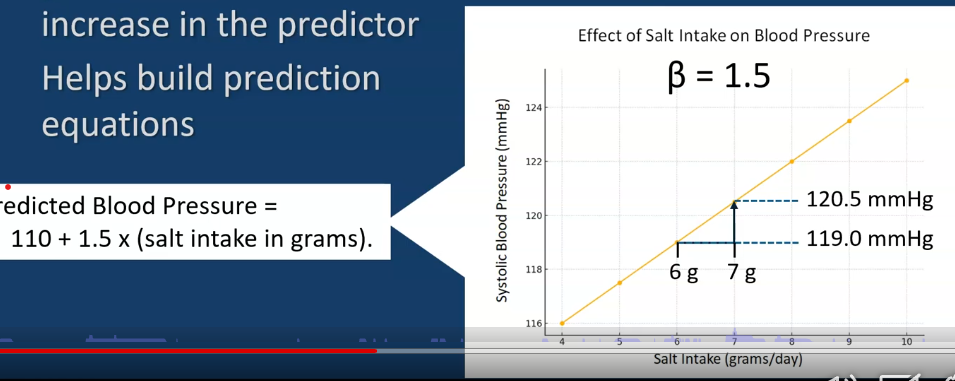
Regression coefficient B (Beta)
Ex) Interpret B in this
Uses one variable to estimate the size of change in the other
B tells us how much the outcome changes for ach one-unit increase in the predictor
Answer: If we are prediciting blood pressure from salt intake, a B of 1.5 means that for every additional gram of salt, blood pressure goes up by 1.5 mmHg.