Ch 2 - Statistics
1/25
There's no tags or description
Looks like no tags are added yet.
Name | Mastery | Learn | Test | Matching | Spaced | Call with Kai |
|---|
No analytics yet
Send a link to your students to track their progress
26 Terms
Data visualization
Term used to describe the use of graphical displays to summarize and present info about a data set
Frequency distribution
A frequency distribution is a tabular summary of data showing the number (frequency) of observations in each of several nonoverlapping categories or classes
Relative Frequency
Fraction or proportion of observations belonging to a class. For a data set with n observatios, the relative frequency of each class can be determined as follows
Relative frequency of a class = Frequency of the class / n
Relative Frequency Distribution
Gives a tabular summary of data showing the relative frequency of the data for each class
Percent frequency distribution
Summarizes the percent frequency of the data for each class
Bar Charts
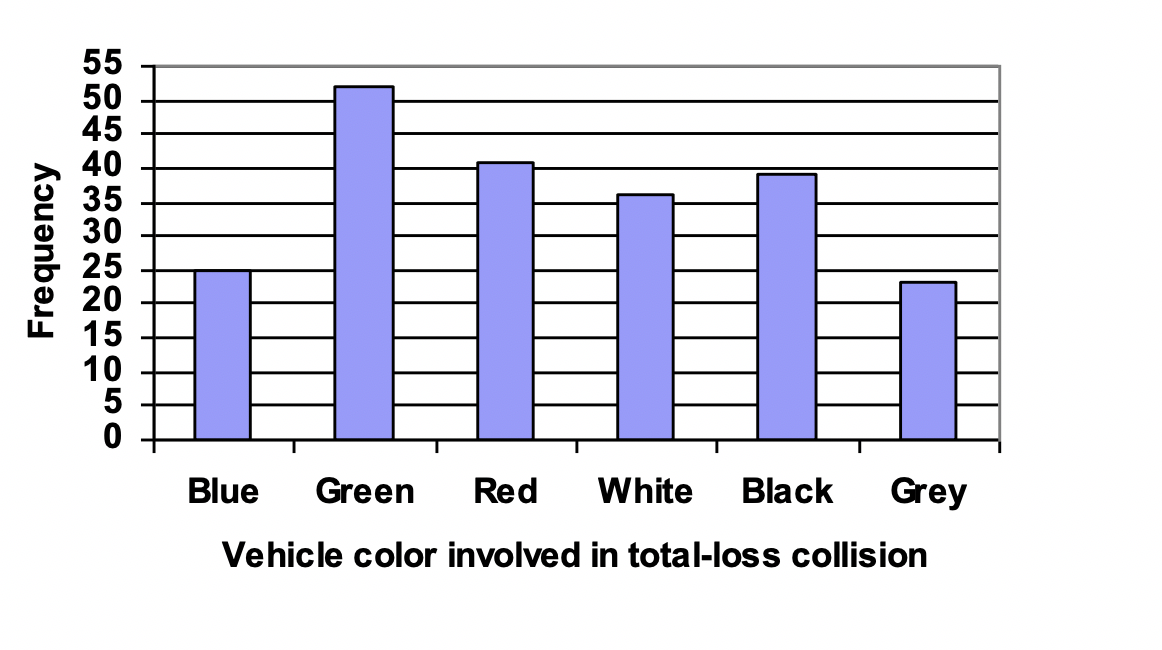
Graphical display for depicting categorical data summarized in a frequency, relative frequency, or percent frequency distribution
Pie Chart
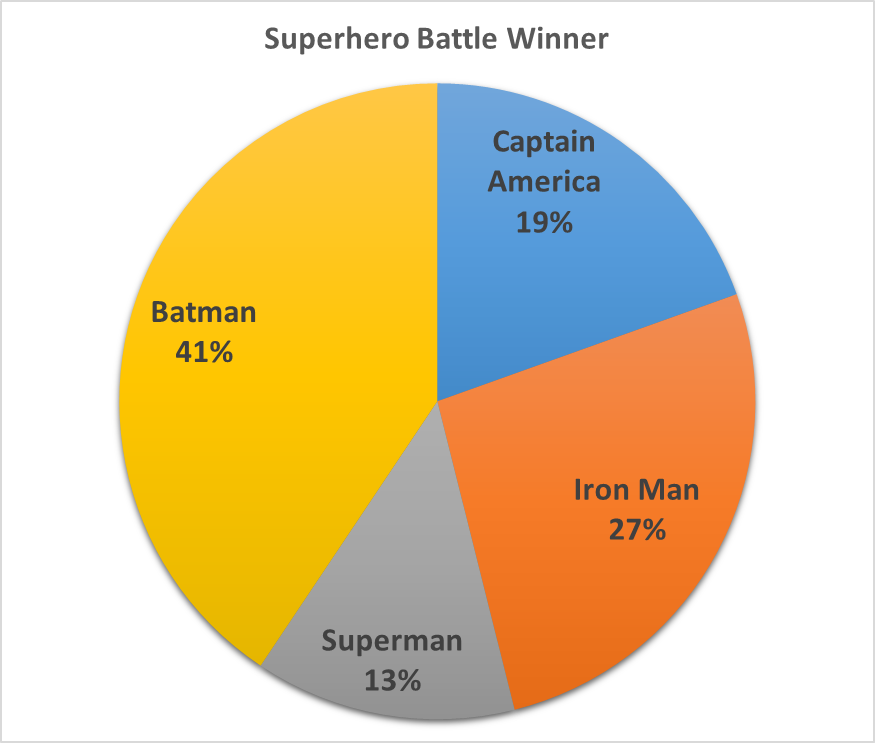
Presents relative frequency and percent frequency distributions for categorical data
not best to present percentages for comparison
Rel frequency x 360
Pareto Diagram
In quality control, bar charts are used to identify the most important causes
of problems.When the bars are arranged in descending order of height from left to right
(with the most frequently occurring cause appearing first) the bar chart is
called a Pareto diagram.This diagram is named for its founder, Vilfredo Pareto, an Italian economist.
1212
Dot Plot
Data represented by a dot placed above the axis
Useful for comparing the distribution of the dat for two or more variables
Histogram
Can be prepared for data previously summarized in either a frequency, relative frequency, or percent frequency distribution
Place the variable of interest. on the horizontal axis and the frequency, rel frequency or percent frequency on the vertical axis
Elinate the spaces between classes in. ahistogram for the audit time data helps show that all values between. thelwoer limit of the first class and the upper limit of the last class are possible
Provides info of shape
Skewed right, Skewed left, symmetrical
Cumulative Distributions
Uses number of classes, class width, and class limits developed for the frequency distriution
Shows the number of data items with values less than or equal to the upper class limit of each class
Cumulative relative frequency distribution
Proportion of data items
Cumulative percent frequency distribution
Percentage of data items with values less than or equal to the upper limit of each class
Summing the relative frequencies or by dividing the cumulative frequencies by the total number of tiems
Stem-and-Leaf Display
Show simultaneously the rank order and shape of a distribution of data
Sort the digits on each line into rank order (numbers. tothe left form the stem and digits to the right is a leaf
Indicates which numbers have a first digit of a 6,7,8,9, etc
Crosstabulation
Summarizing Data for Two Variables Using Tables
Method for summarizing the data for two variables
Used when:
One variable is categorical and the other is quanittiative
Both variables are categorical, or
Both variables are quantitative
The left and top margin labels define the classes for the two variables
Simpson’s Paradox
The reversal of conclusions based on aggregate and unaggregaited data is called Simspon’s paradox
Data Dashboard
a Set of visual displays that organizes and presents info that is used to mointor the perfomrance of a company or organization in a manner that is easy to read
Scatter diagram
A graphical display of the relationship between two quantitative variables. ONe variable is shown on the horizontal axis and the other variable is shown on the vertical axis
Trend line
A line that provides an approximation of the relationship between two variables
Side by side bar chart
A graphical display for depicting multiple bar charts on the same displa
Stacked bar chart
Each bar is broken into rectangular segments of a different color showing the relative frequency of each class in a manner similar to a pie chart
Approximate class width
Largest data value - smallest data value/number of classes
Summarizing Categorical Data
Frequency distr.
Relative frequency dtr.
Percent frequency dist.
pie chart
bar chart
Summarizing quantitative data
Frequency Distribution
• Relative Frequency and Percent Frequency Distributions
• Dot Plot
• Histogram
• Cumulative Distributions
• Stem-and-Leaf Display
Outliers
Medians used