econ graphs
1/7
There's no tags or description
Looks like no tags are added yet.
Name | Mastery | Learn | Test | Matching | Spaced |
|---|
No study sessions yet.
8 Terms
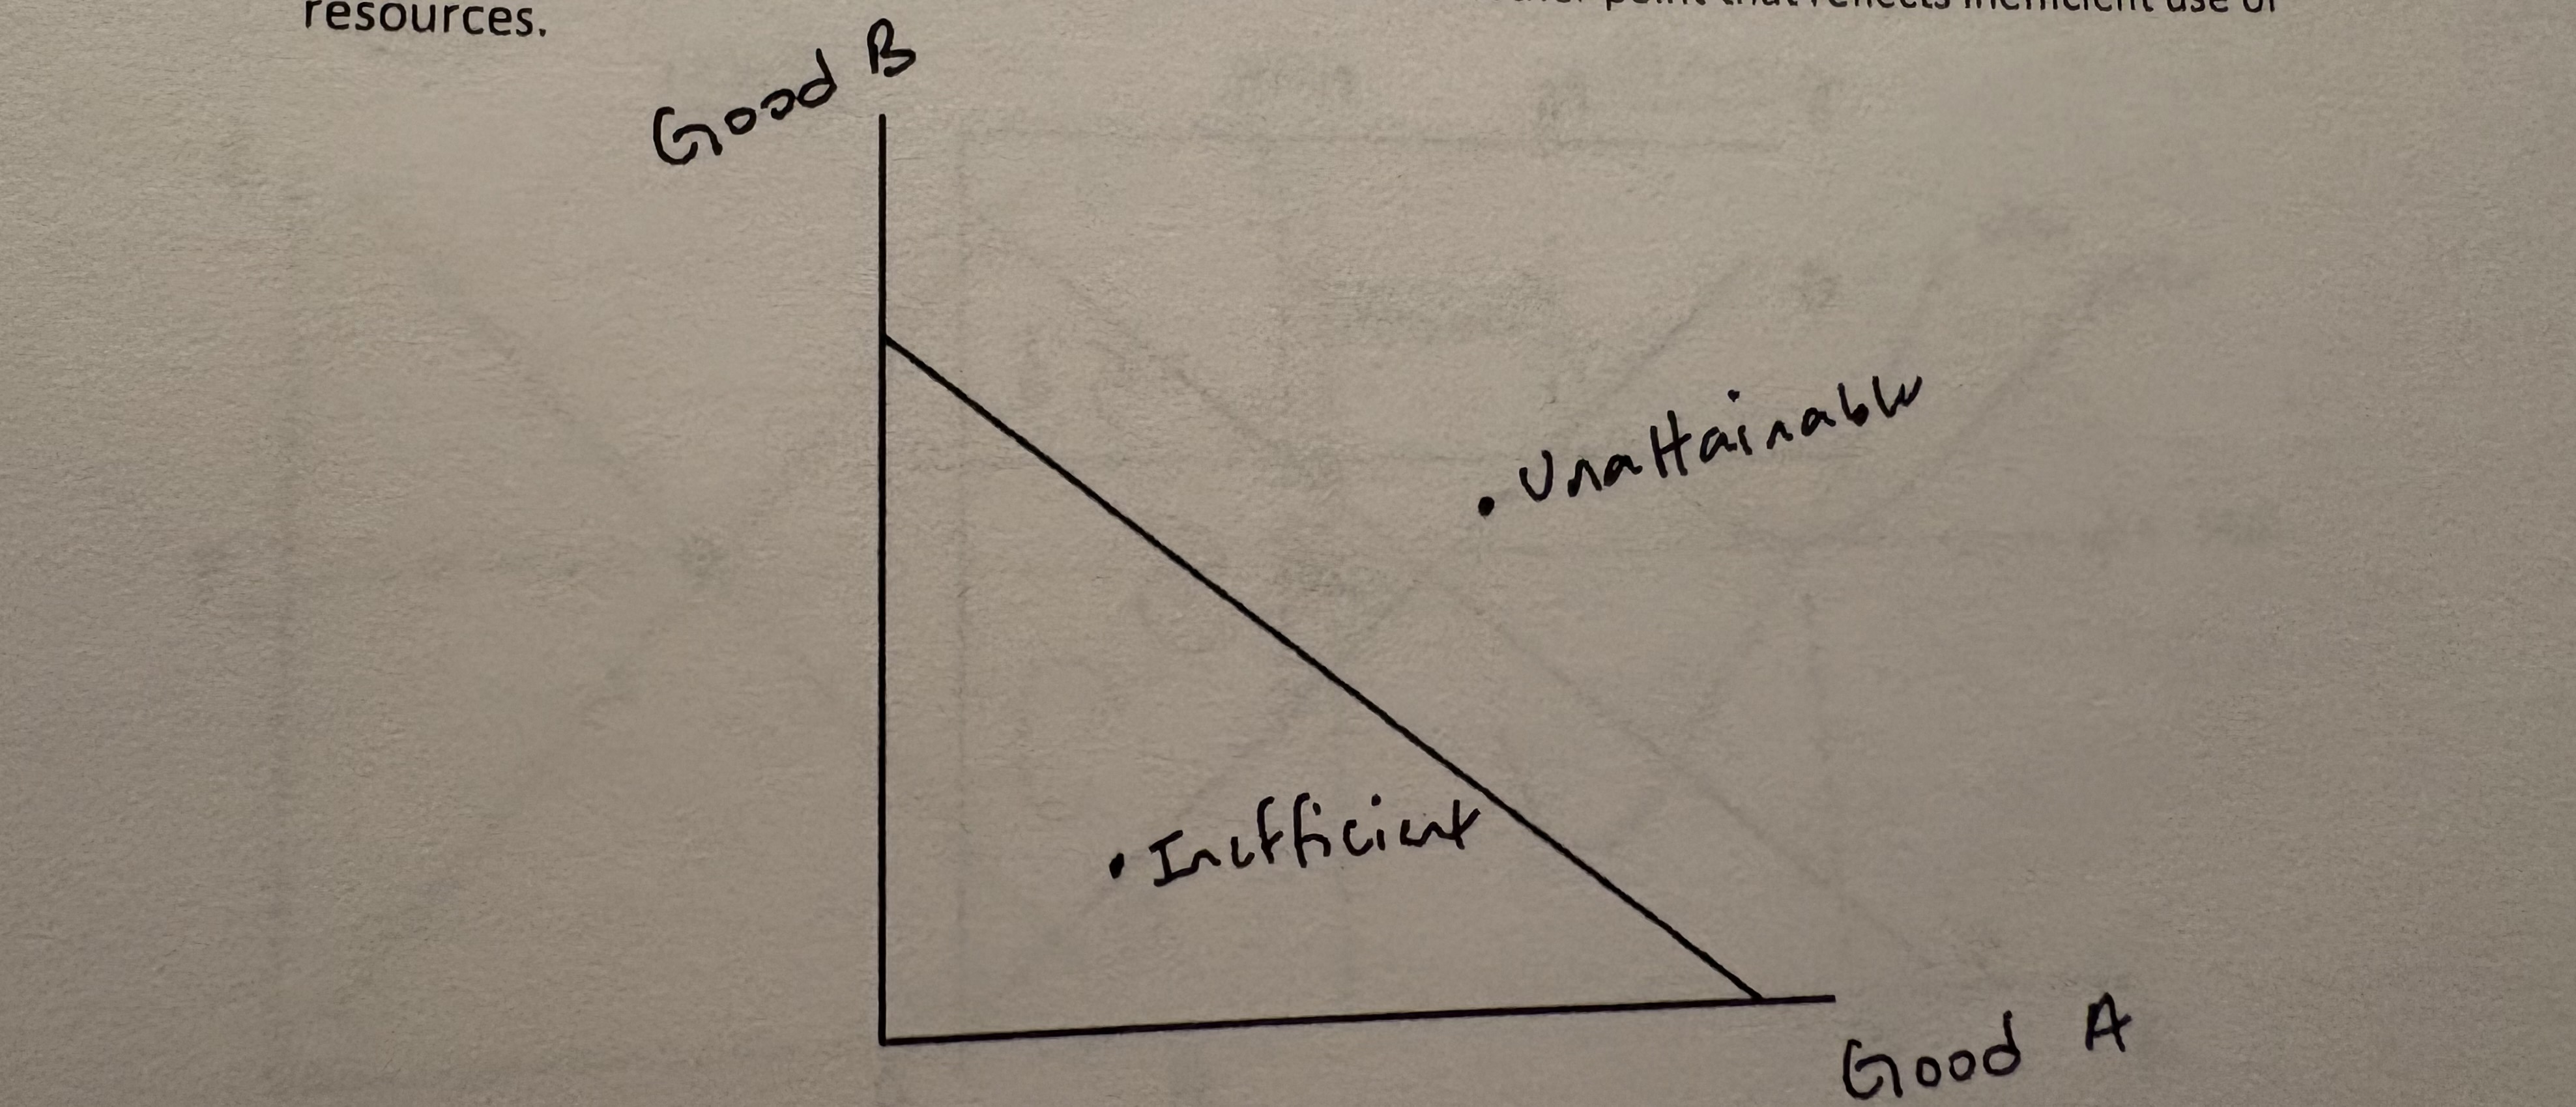
A PPC curve showing constant opportunity cost between two goods. Label unarguable and inefficient points.
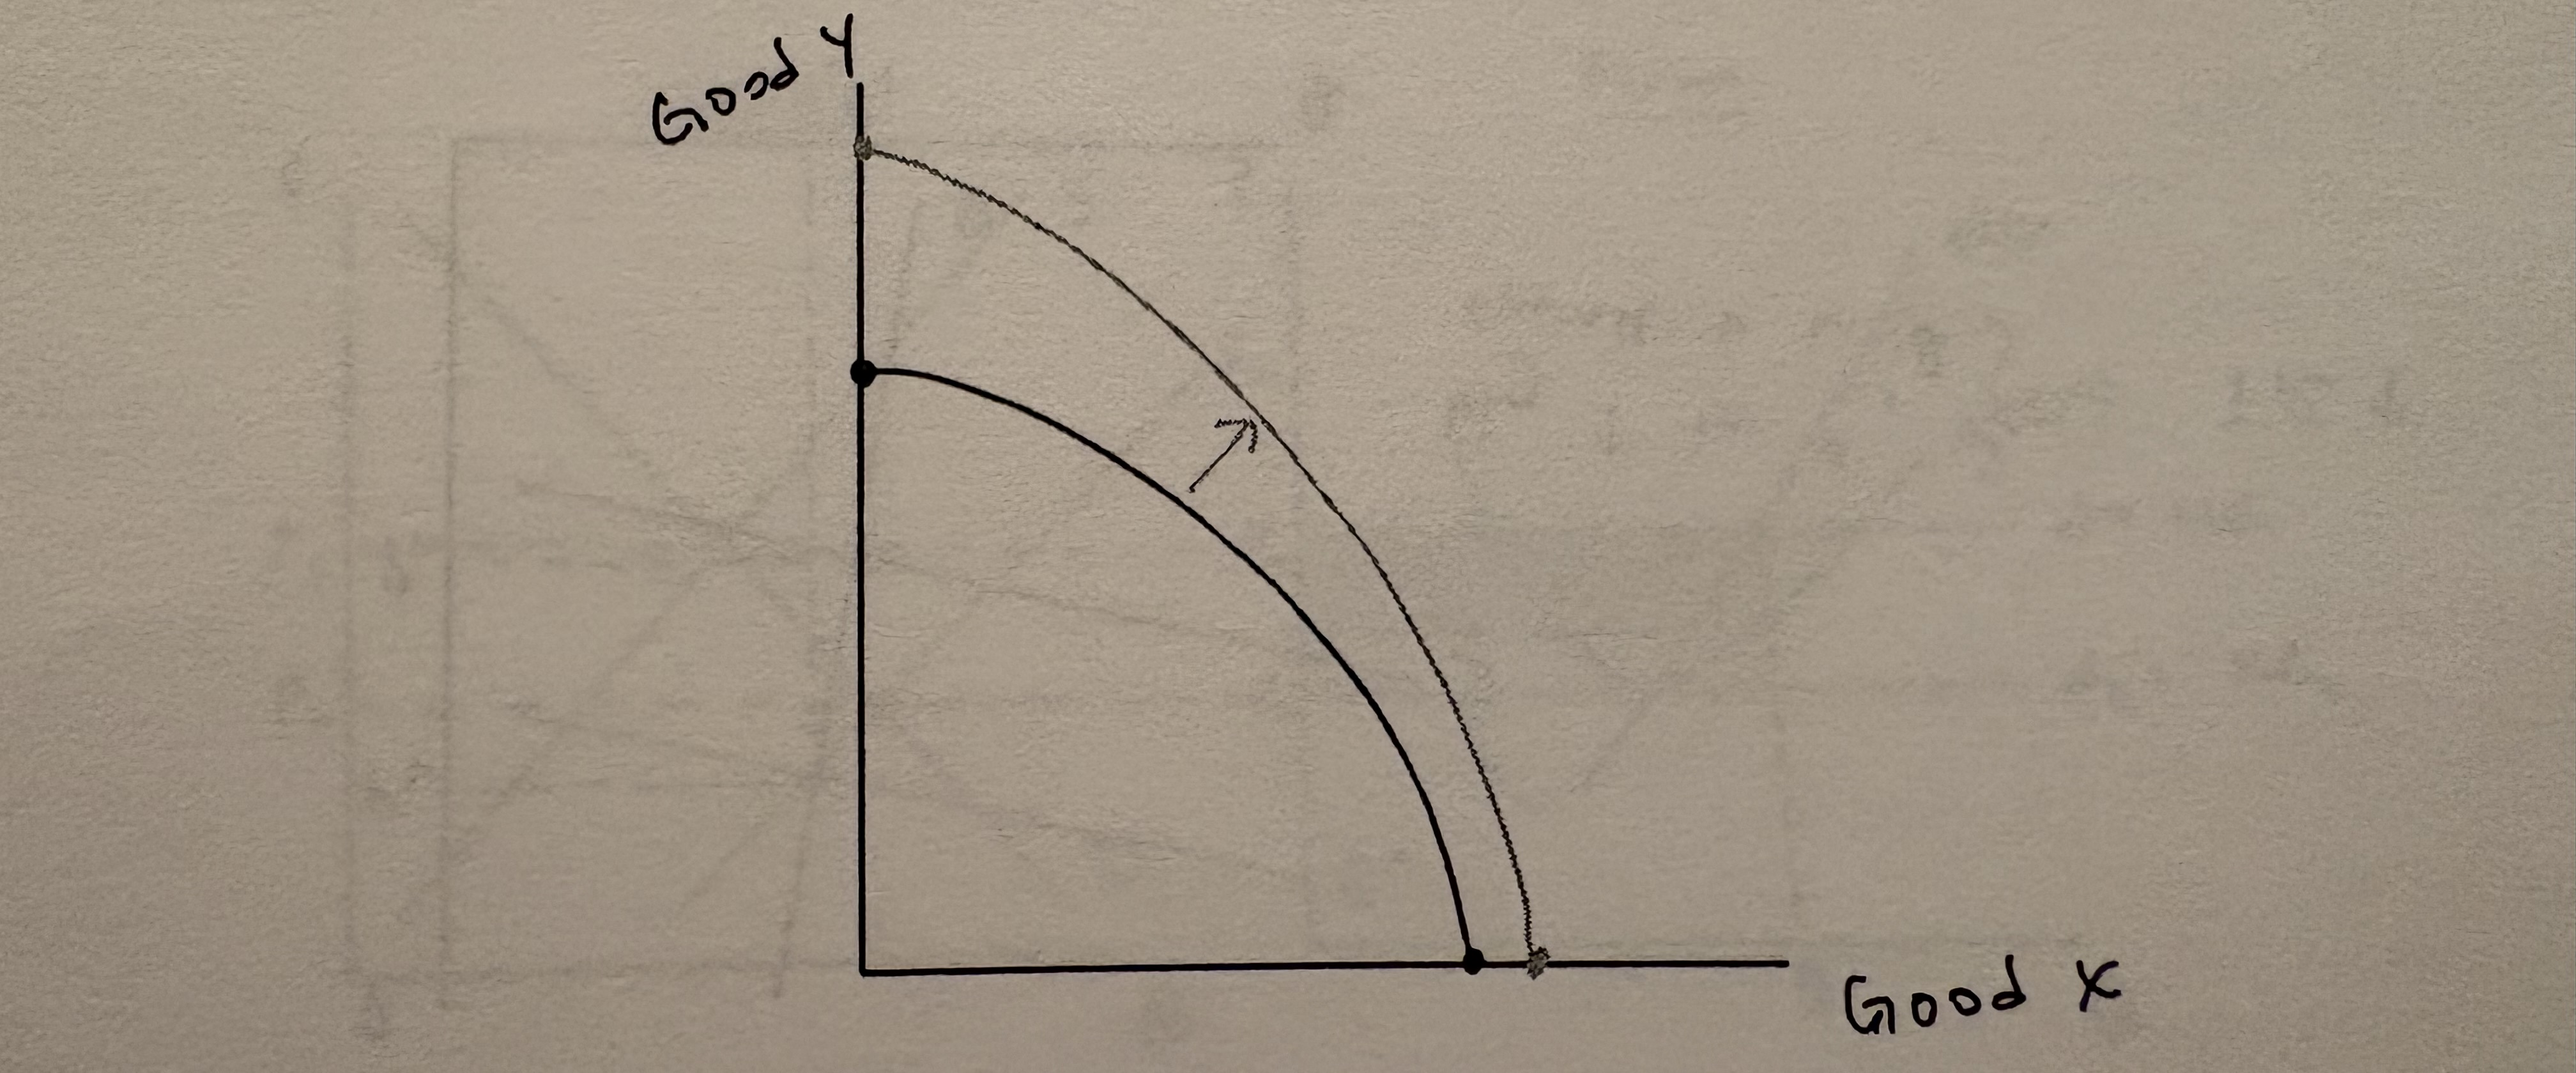
Graph a production possibilities curve (PPC) showing increasing opportunity costs between two goods. Show the result of an increase in resources:
On a graph of a market for a good, show the effect on the equilibrium price and quantity if there is a decrease in technology simultaneously with a decrease in income, assuming it sa normal good.

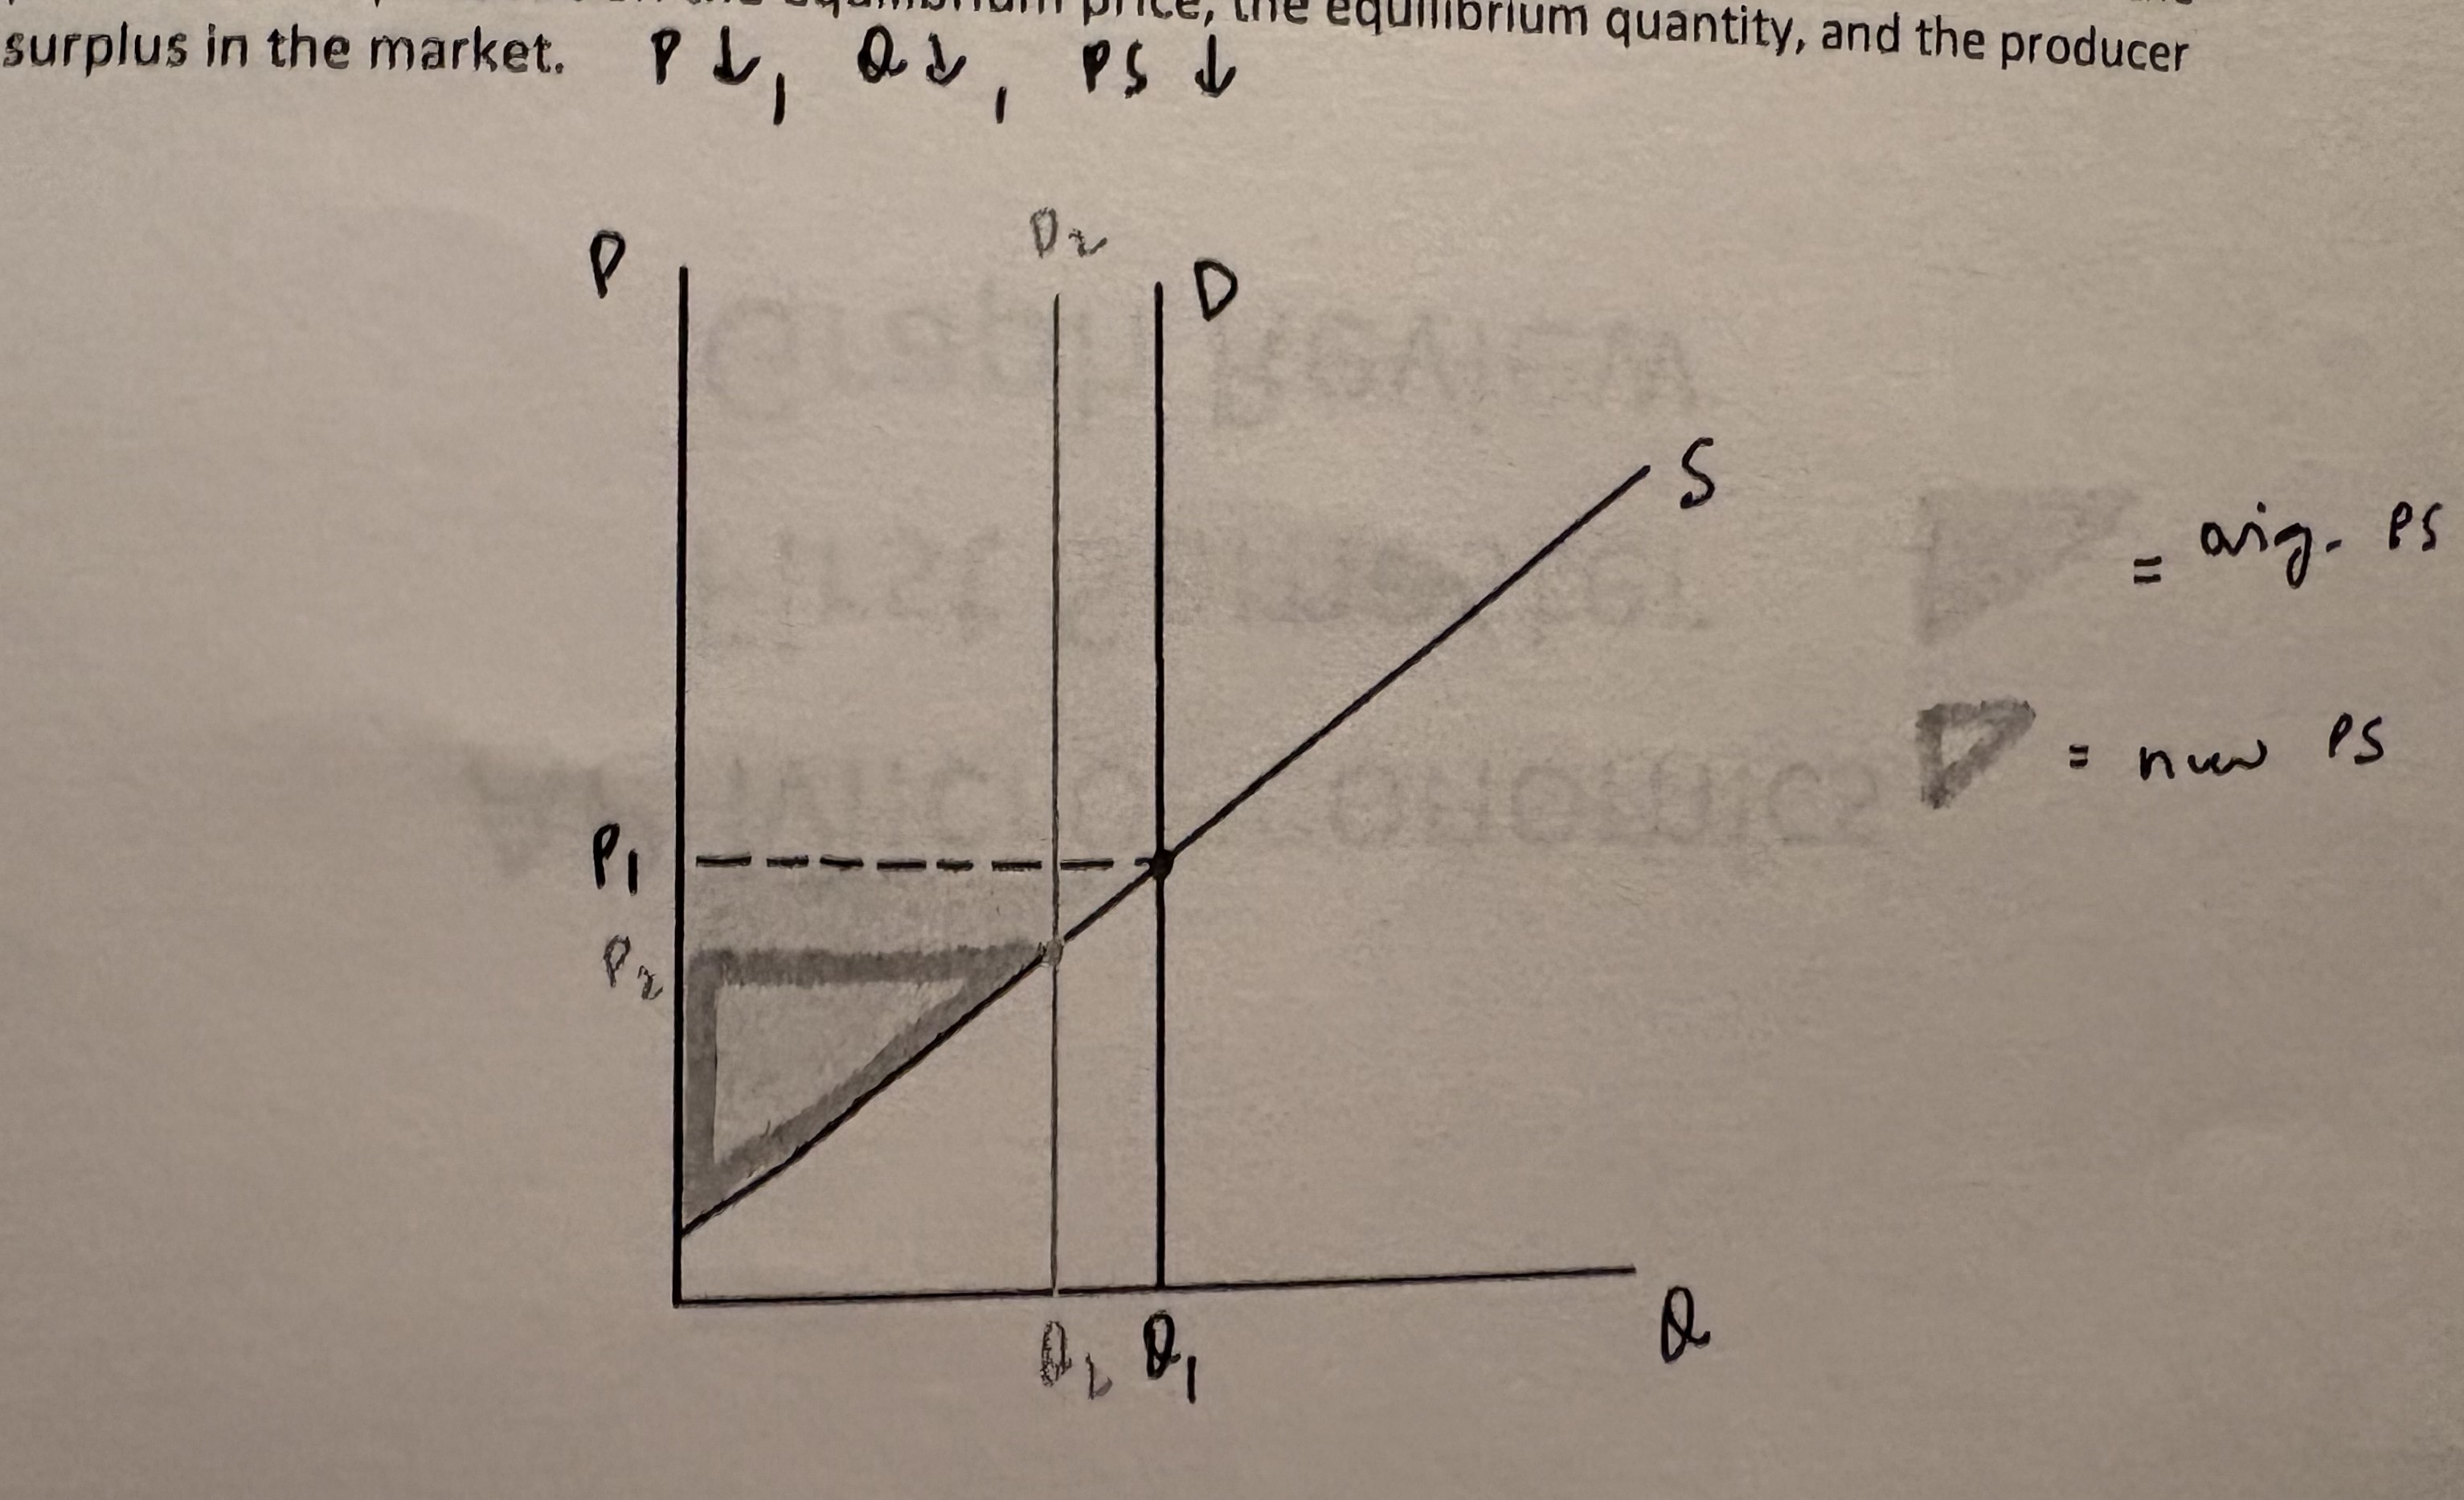
Graph a market in which demand is perfectly inelastic. Show the effect of an increase in the price of a complement on the equilibrium price, the equilibrium quantity, and the producer surplus in the market.
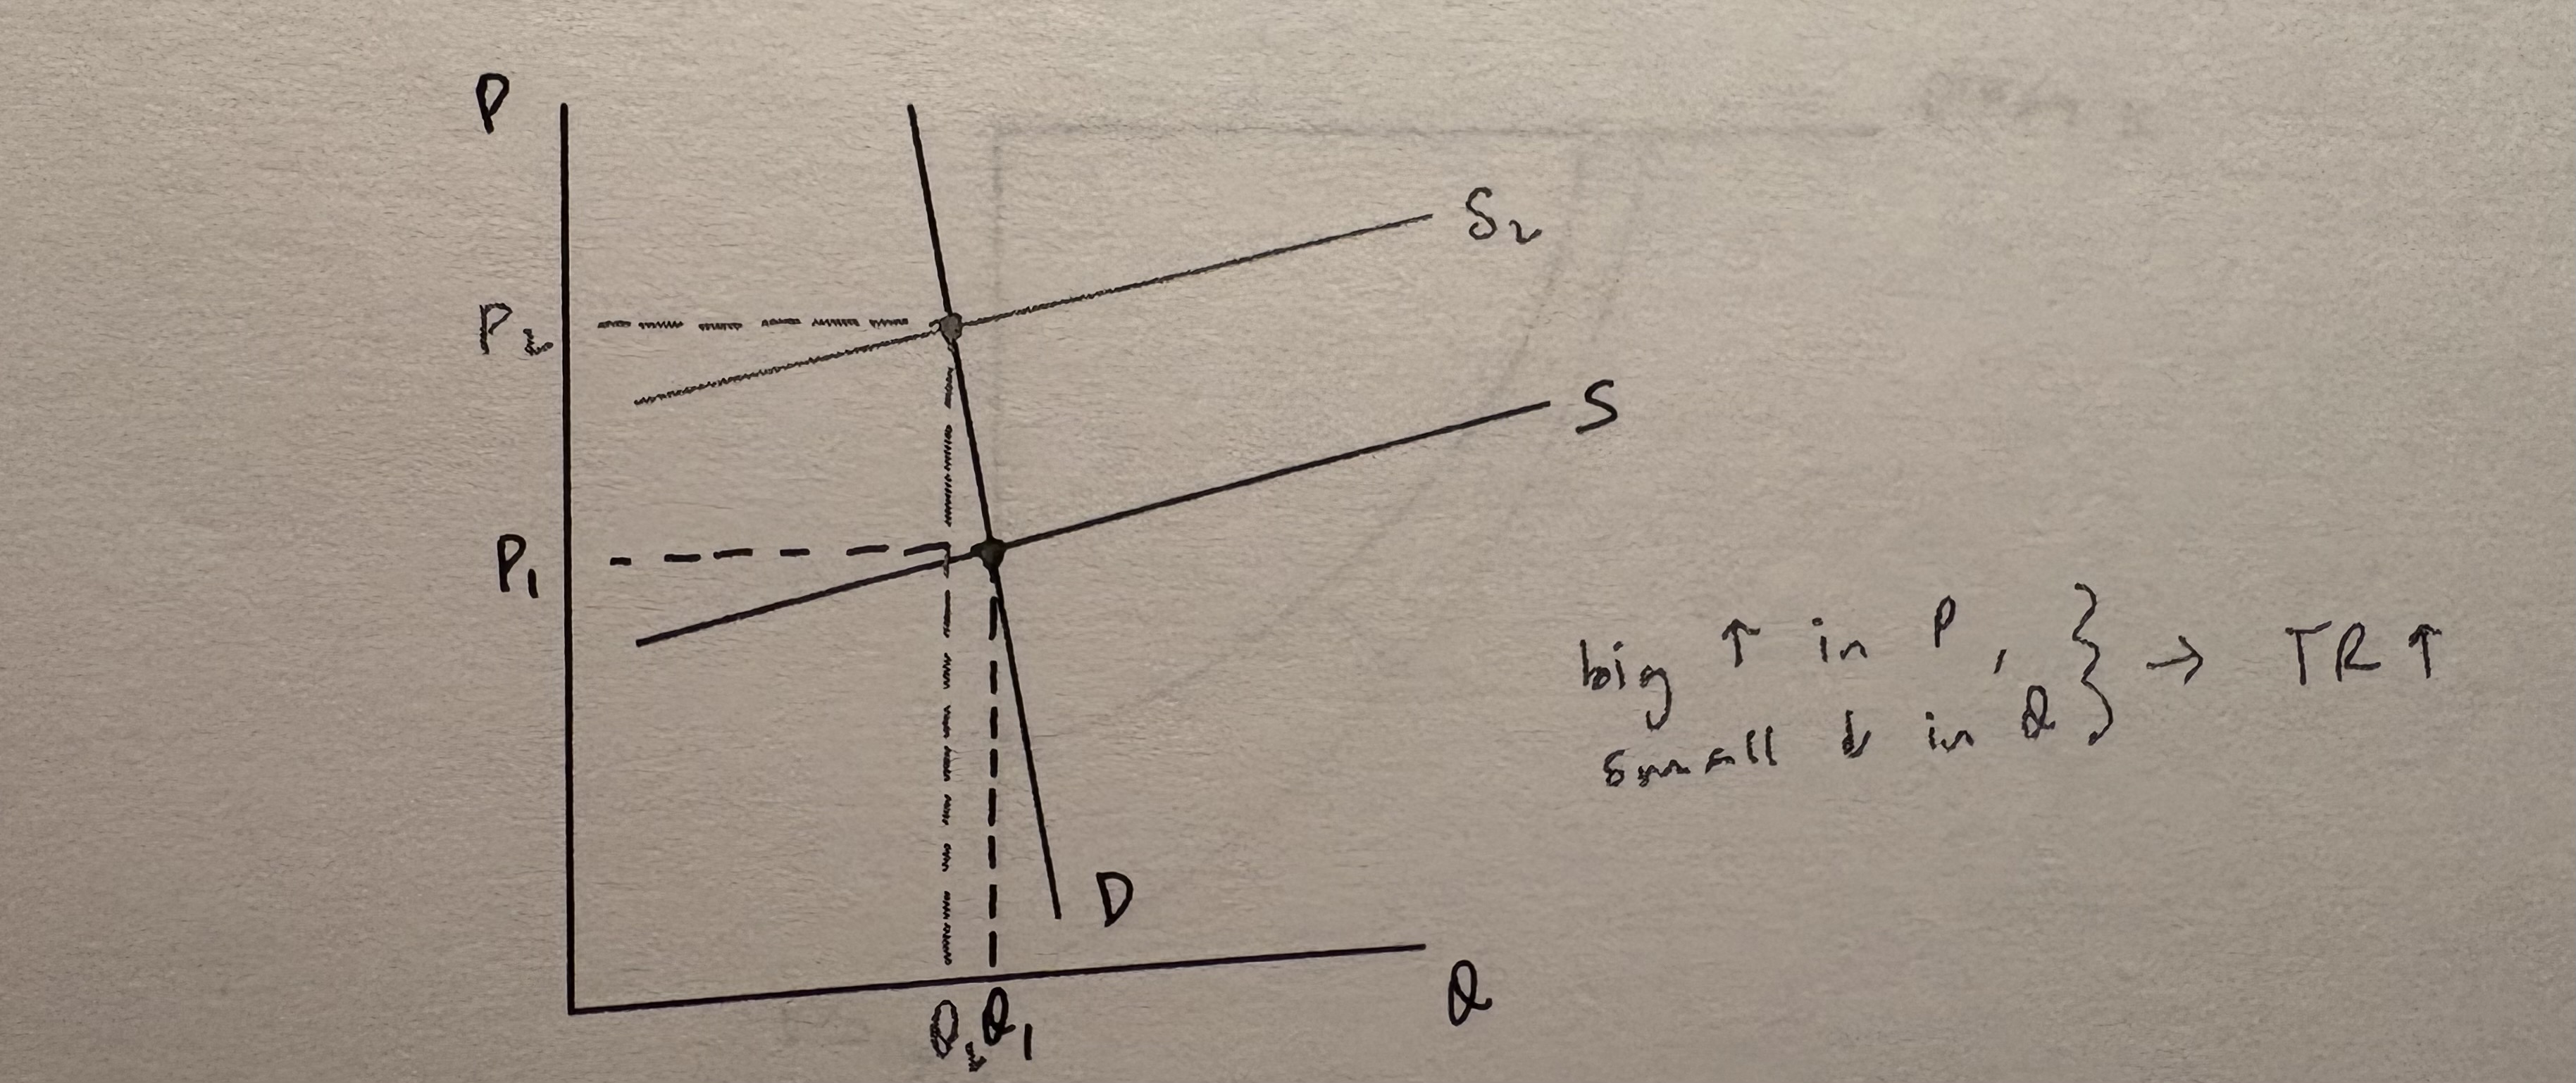
Graph a market in which demand is relatively inelastic and supply is relatively elastic. Show the effect of an increase in input costs, and explain the effect on total revenue.
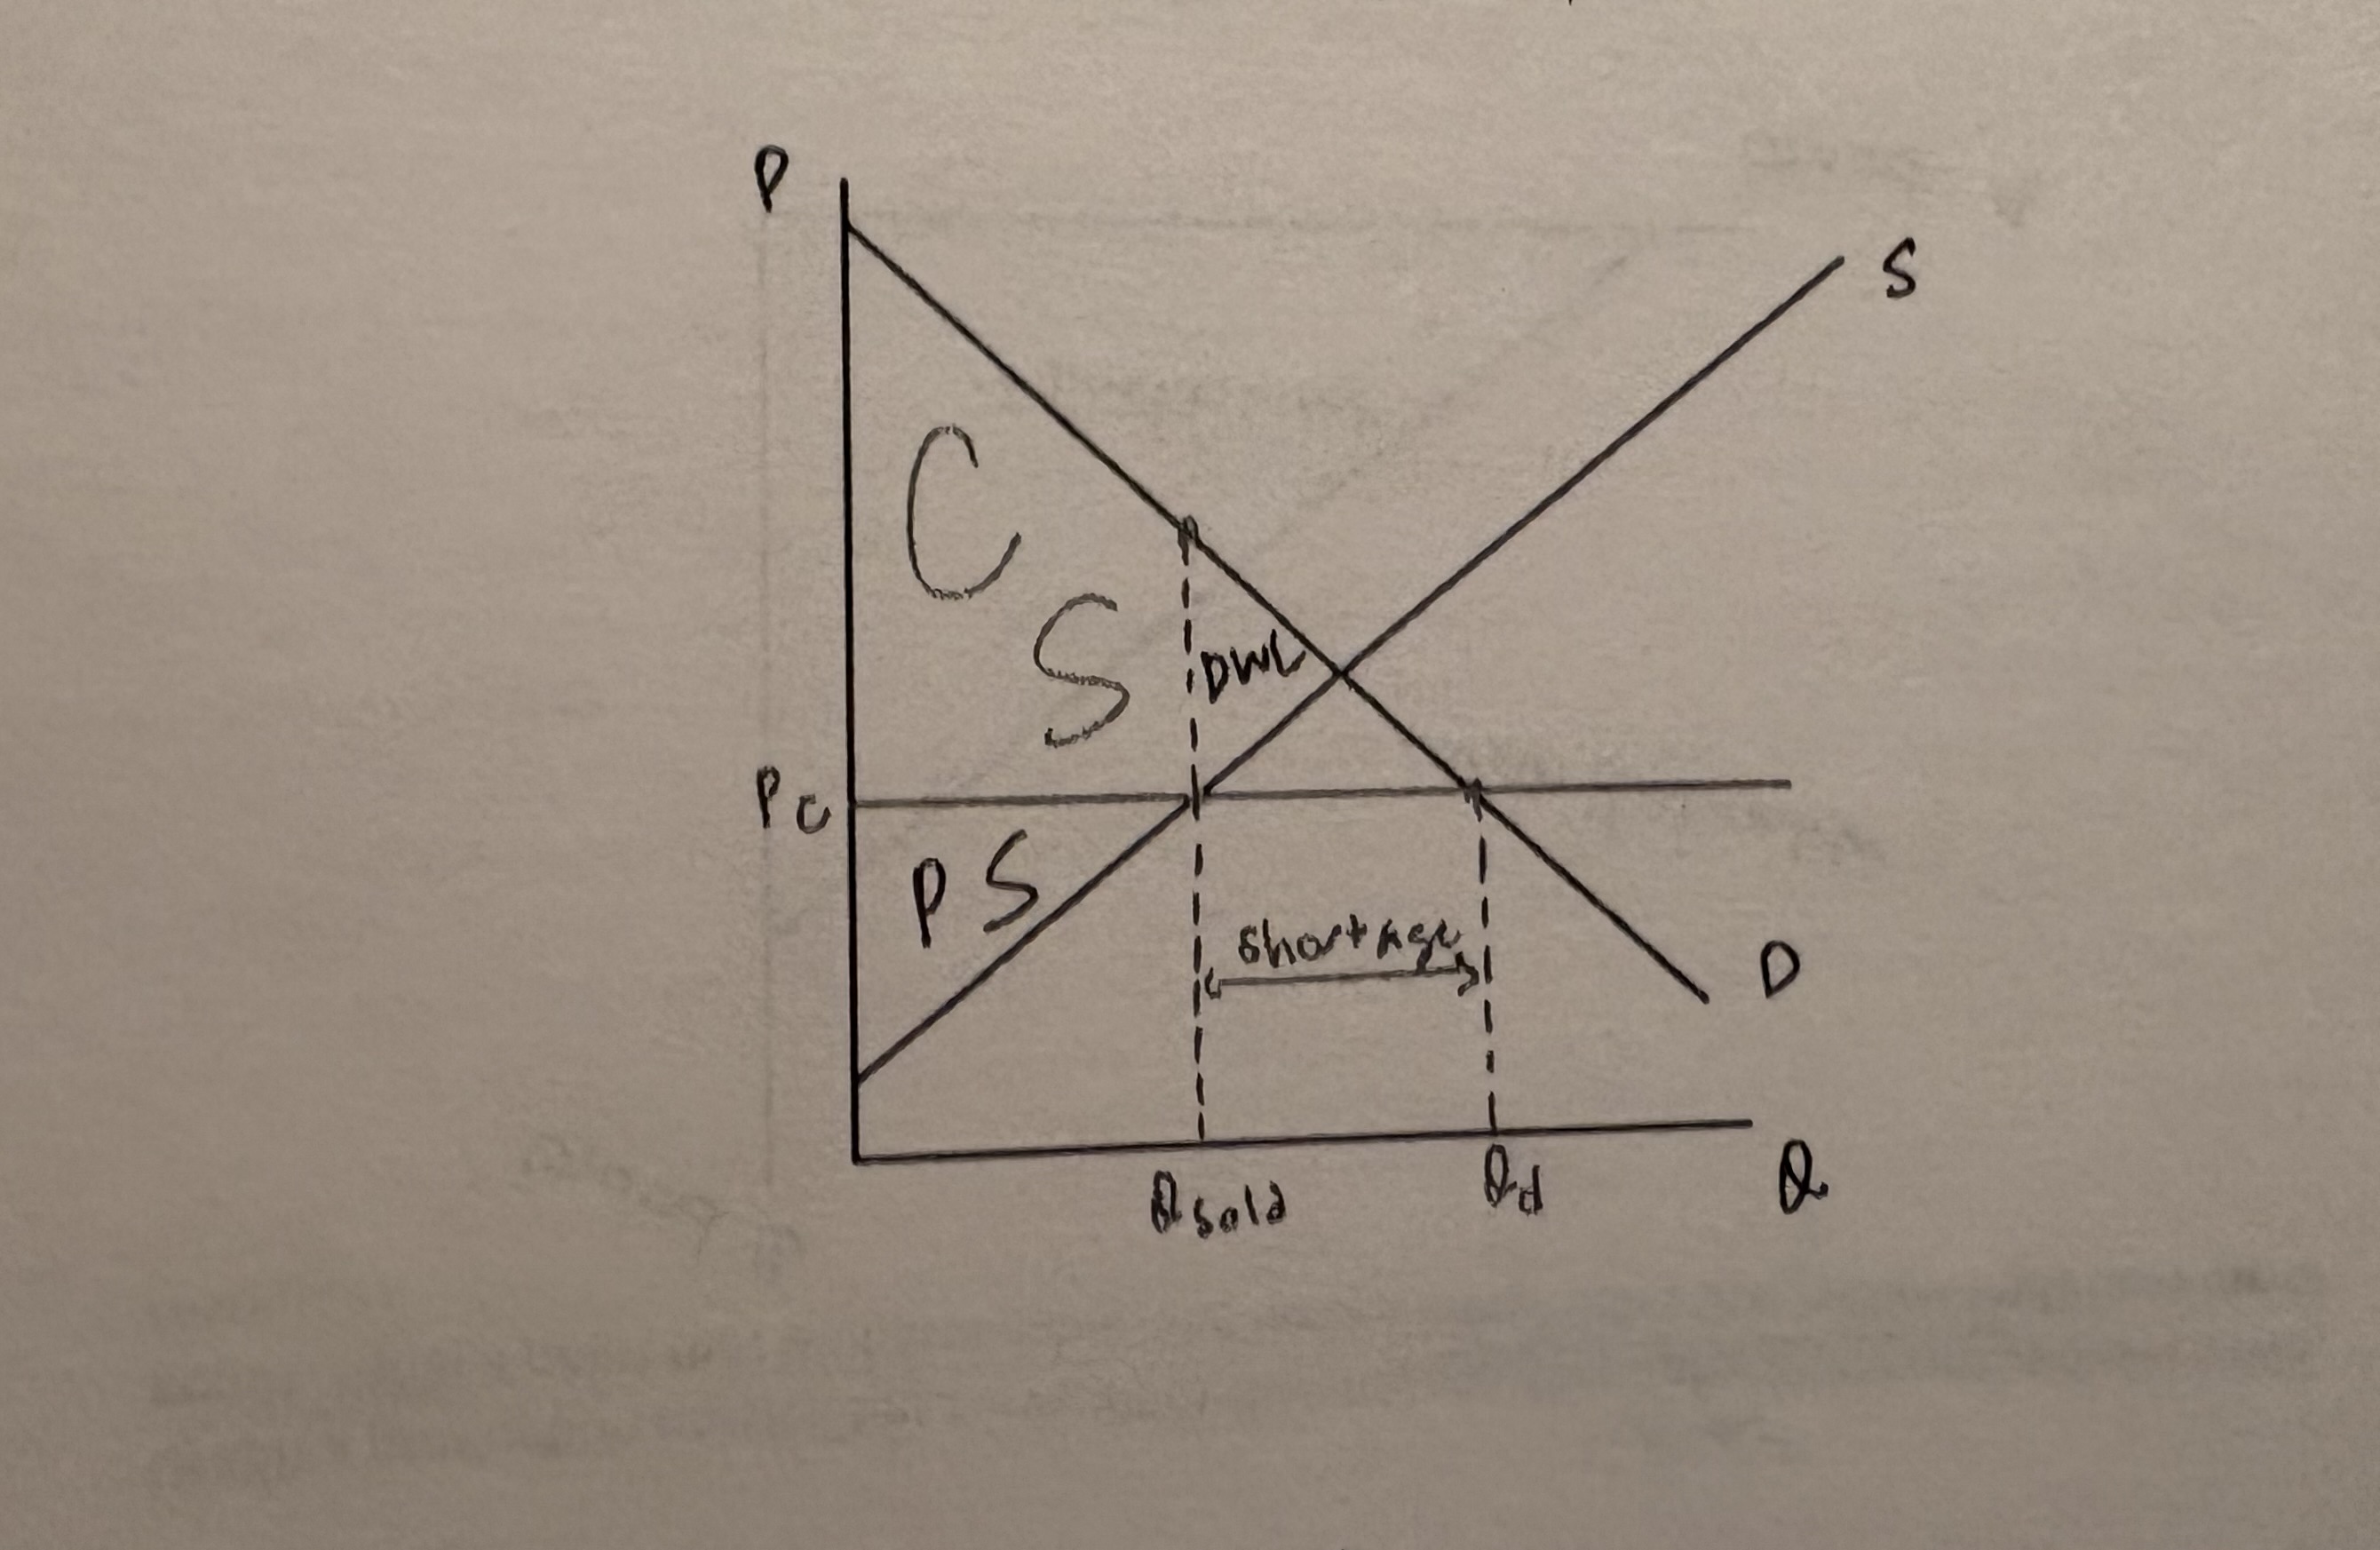
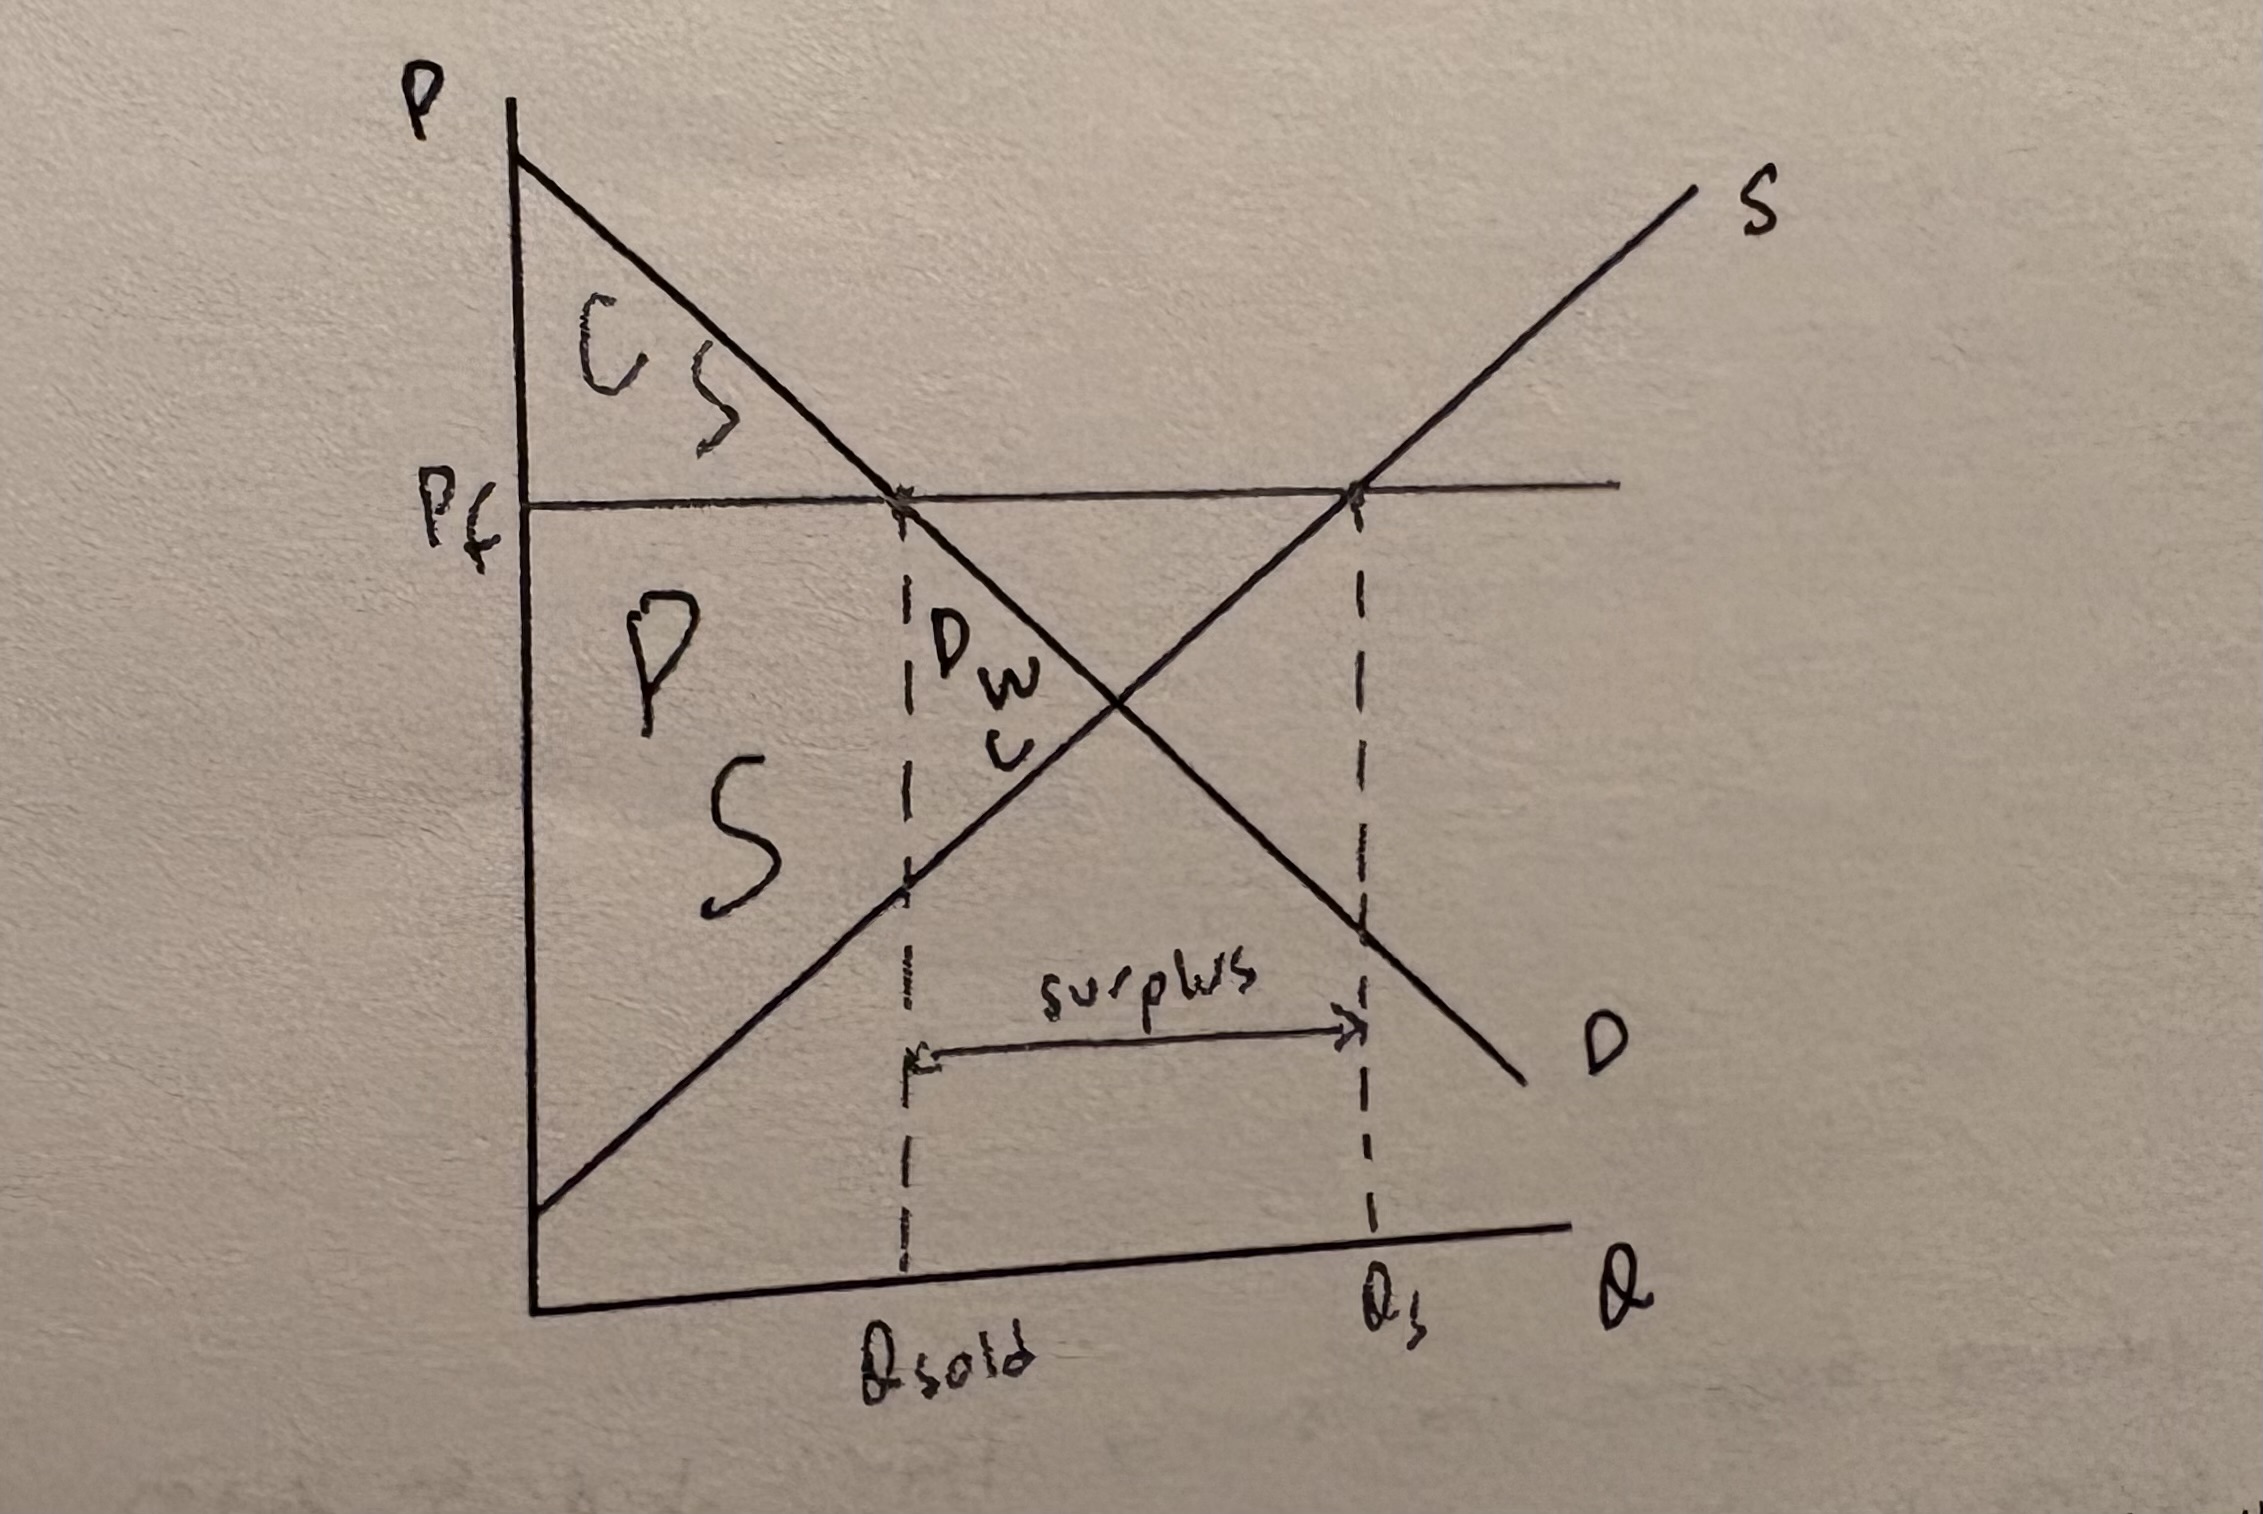
Graph a market with an effective price ceiling. Clearly label quantity sold, price, consumer and producer surplus, deadweight loss, and any shortage or surplus.
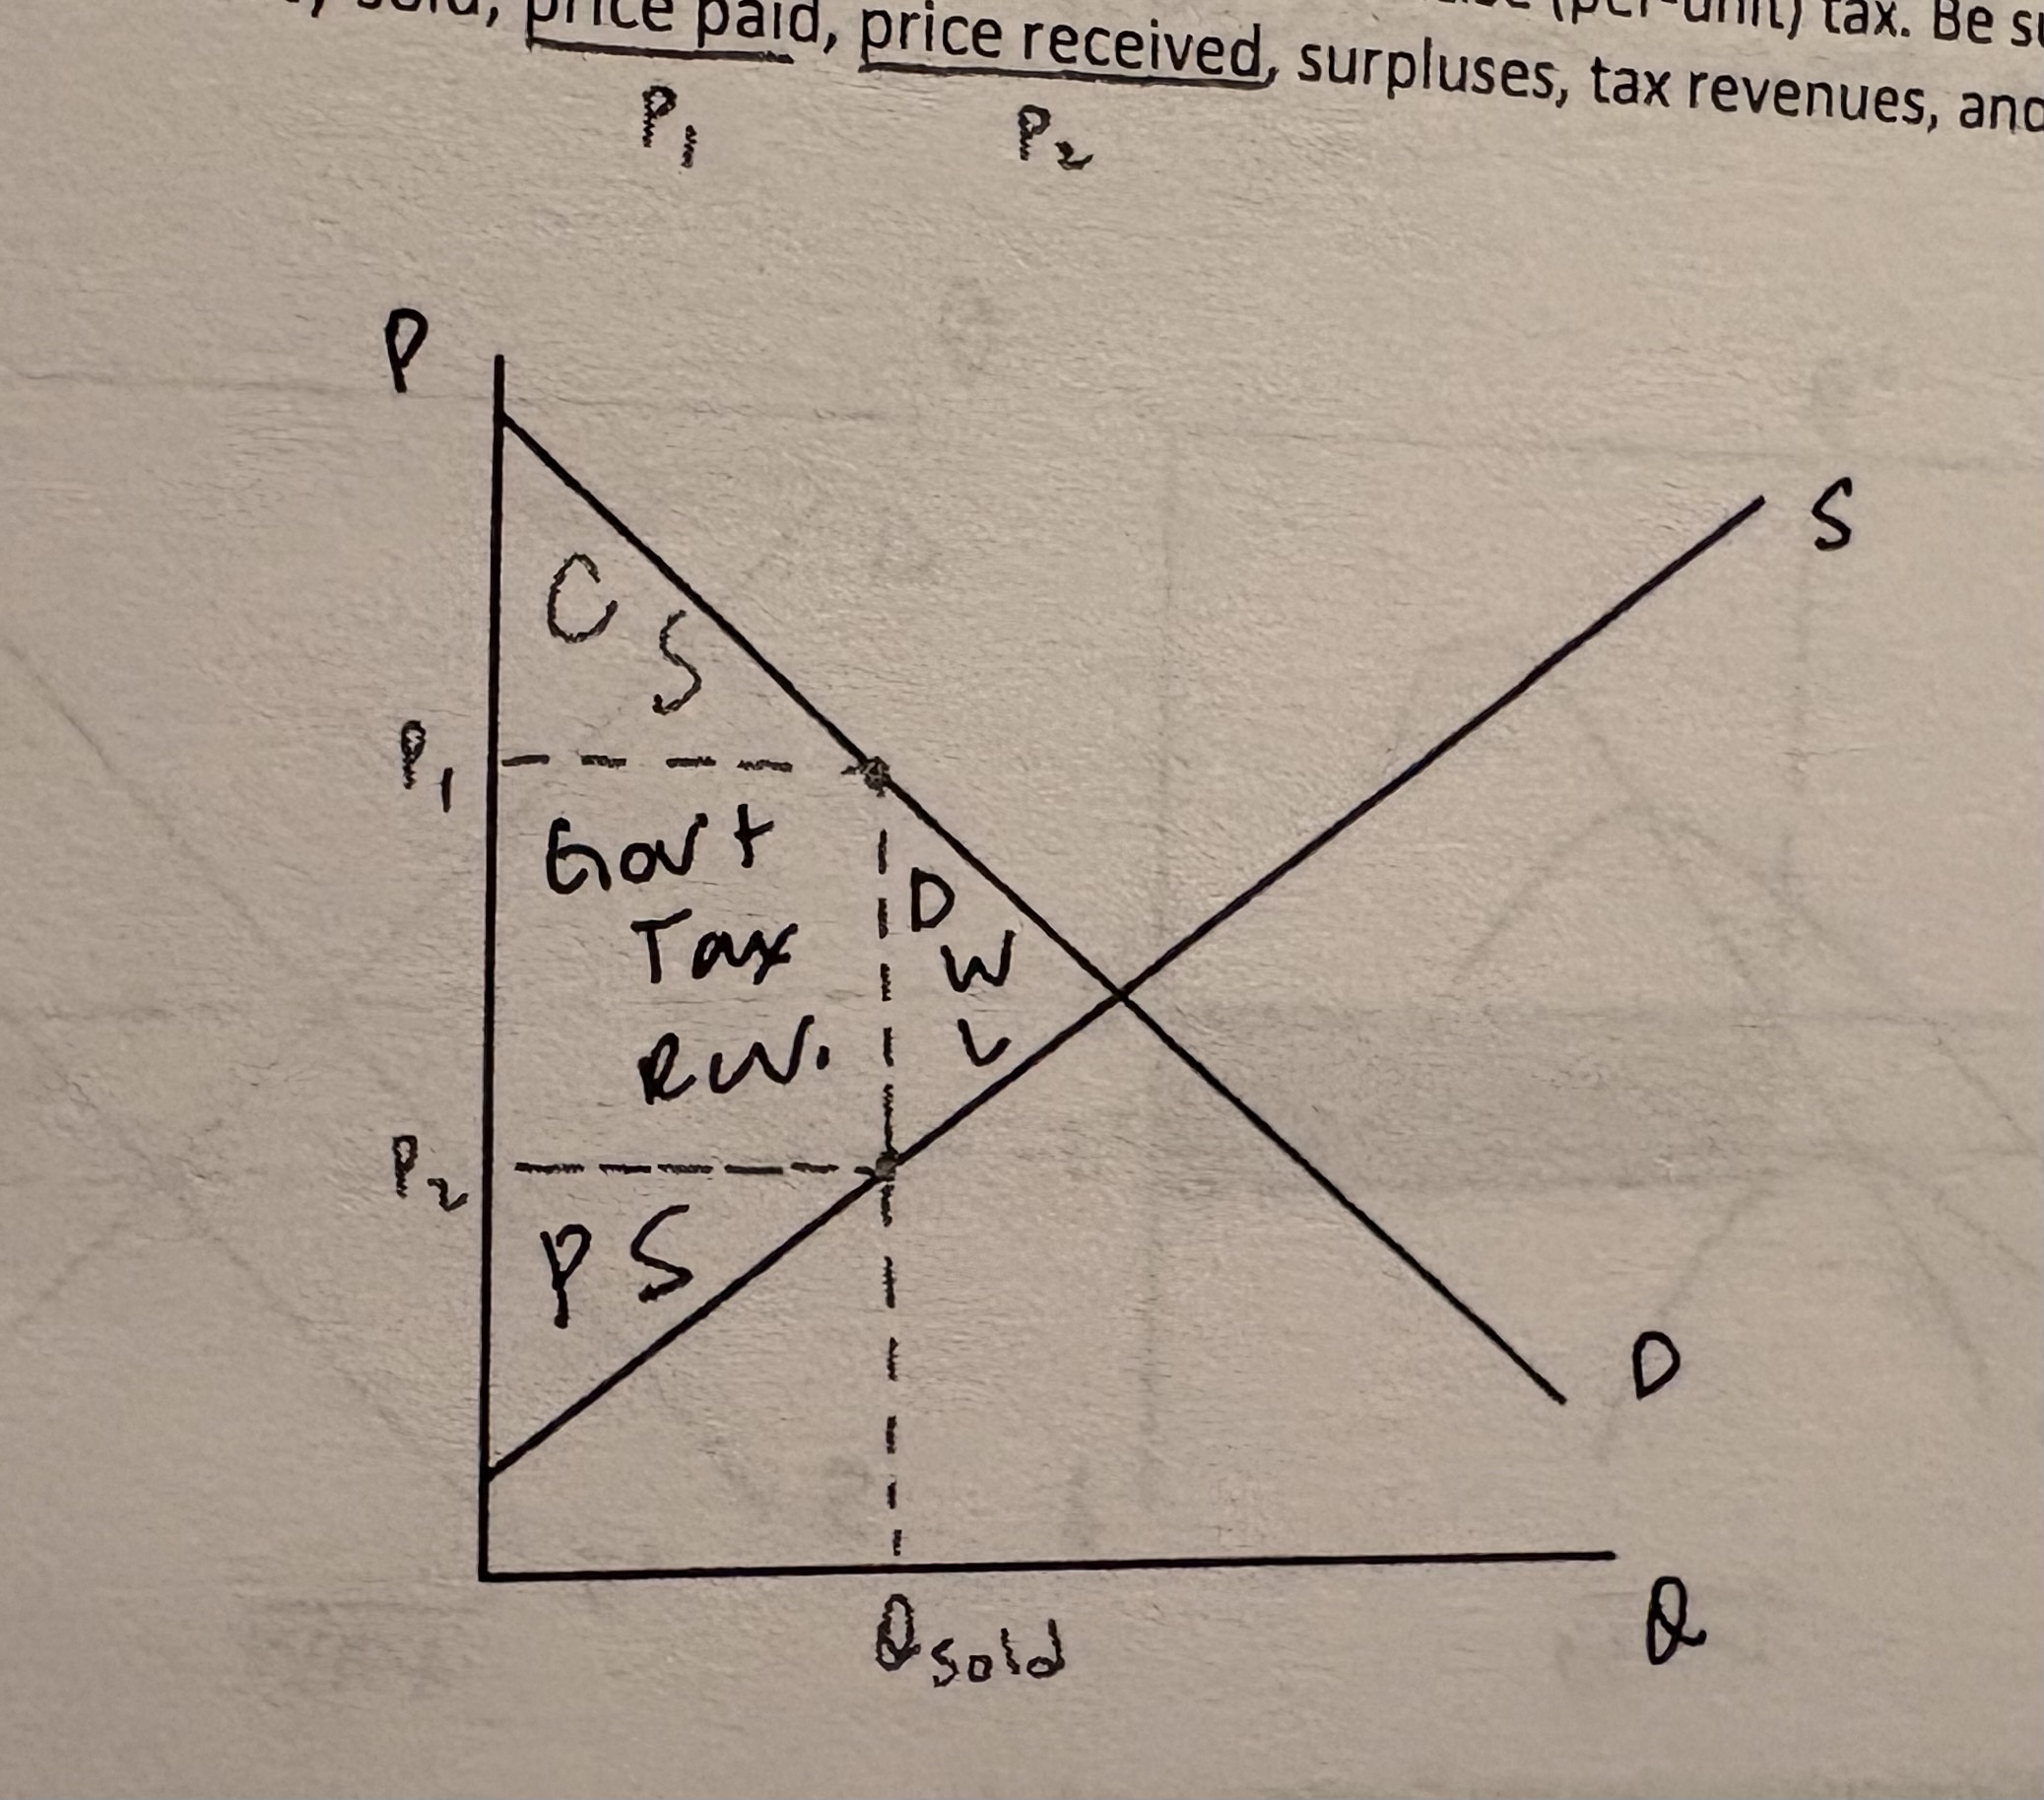
Graph a market for a good, showing the impact of an excise (per-unit) tax. Be sure to show the impact on quantity sold, price paid, price recelved, surpluses, tax revenues, and deadweight loss.