Atomic Structure and Mass spectrometer
1/5
There's no tags or description
Looks like no tags are added yet.
Name | Mastery | Learn | Test | Matching | Spaced |
|---|
No study sessions yet.
6 Terms
The Table of charges and masses of subatomic particles.
Particle | Abbreviation | relative charge | Relative mass |
Proton | p+ | 1+ | 1 |
Neutron | n | 0 | 1 |
Electron | e- | 1- | 1/1836 |
Relative atomic mass Ar
Is the weighted mean mass of an atom of an element relative to 1/12th of the mass of an atom of carbon-12
It takes into account:
The percentage abundance of each isotope
The relative isotopic mass of each isotope
The steps of mass spectrometer
A sample is placed in the mass spectrometer
The sample is vaporised and then ionised to form positive ions
The ions are accelerated. Heavier ions move slowly and are more difficult to deflect than lighter ions, so the ions of each isotope are separated
The ions are detected on a mass spectrum as a mass-to-charge ratio m/z. Each ion reaching the detector adds to the signal, so the greater the abundance, larger the signal.
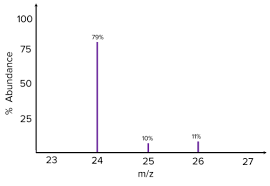
Mass spectrometer graph
The mass spectrum is a graph that shows the isotopes of an atom.
The Y-axis shows the relative abundance of ions, which is given as a percentage
The X-axis is the mass/charge ratio
The example graph shows there are 3 isotopes at 24, 25 and 26
Molecular Ion equation
molecule —— molecule + e-
Fragmentation
Fragmentation- is when a molecular ion splits in the process of the mass spectrometer
This results in a smaller, positive fragment ion and a neutral species (which is not detected)
Examples:
C2H5OH ——— e- + C2H5OH+ ionisation
C2H5OH+ ——— CH3 + CH2OH+ Fragmentation