Neural Convergence and Perception
 Call Kai
 Learn
Learn Practice Test
 Spaced Repetition
 Match
Match Flashcards
 Knowt Play
1/18

There's no tags or description
Looks like no tags are added yet.
Name | Mastery | Learn | Test | Matching | Spaced | Call with Kai | Chat |
|---|
No analytics yet
Send a link to your students to track their progress
19 Terms
Rods and cones send signals vertically (in the diagram on the next slide) through:
WHAT cells
WHAT cells
WHAT axons
Rods and cones send signals vertically (in the diagram on the next slide) through:
Bipolar cells
Ganglion cells
Ganglion axons
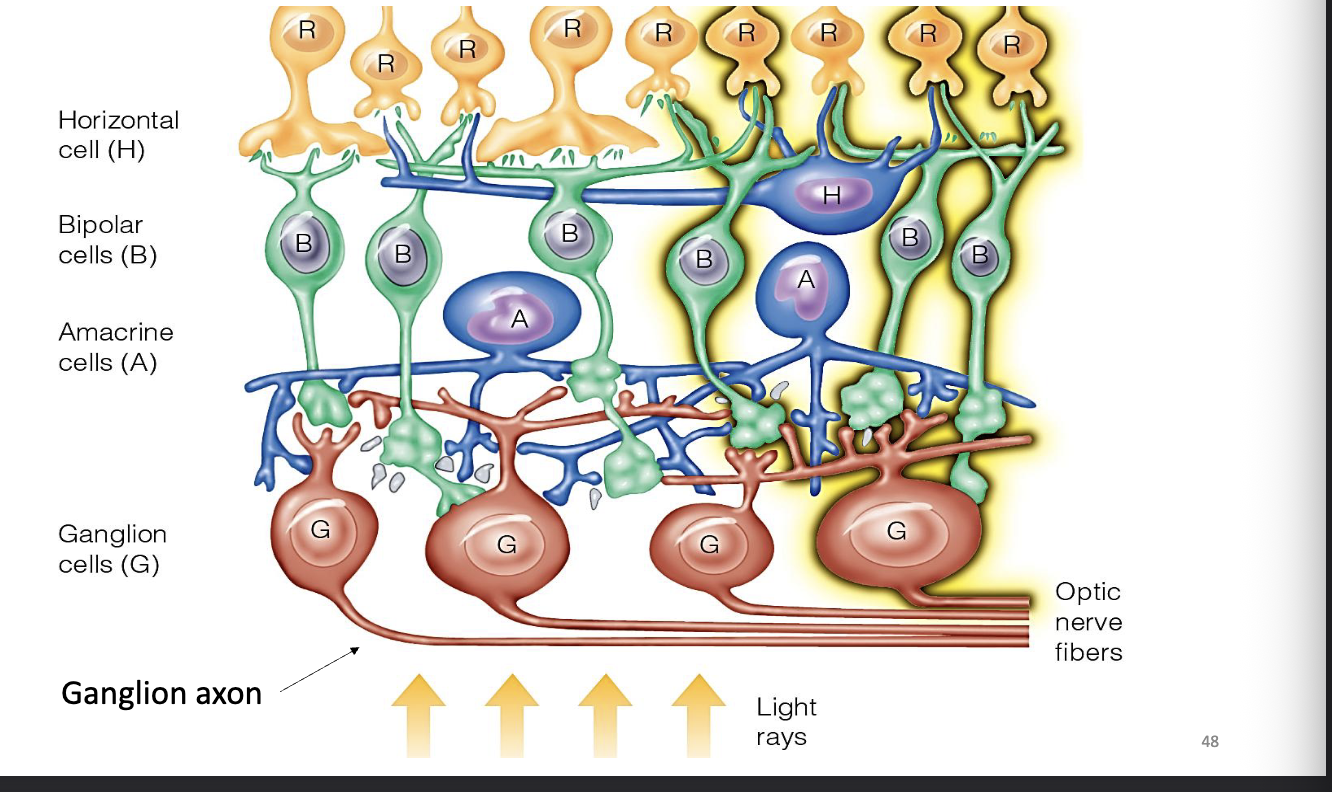
Signals are sent horizontally:
Between WHAT by WHAT cells
Between WHAT and between WHAT cells by WHAT cells
Signals are sent horizontally:
Between RECEPTORS by HORIZONTAL cells
Between BIPOLAR and between GANGLION cells by AMACRINE cells

The rod to ganglion ratio is WHAT to 1
The cone to ganglion ratio is WHAT to 1
The rod to ganglion ratio is 120 to 1.
The cone to ganglion ratio is 6 to 1

Neural Convergence and Perception
WHAT million rods and cones converge to WHAT million ganglion cells.
Higher convergence of WHAT than WHAT
Average of WHAT rods to one ganglion cell
Average of WHAT cones to one ganglion cell
Cones in fovea have WHAT relation to ganglion cells
Neural Convergence and Perception
126 million rods and cones converge to 1 million ganglion cells.
Higher convergence of RODS than CONES
Average of 120 rods to one ganglion cell
Average of 6 cones to one ganglion cell
Cones in fovea have ONE-TO-ONE relation to ganglion cells

Convergence Causes Rods to Be More Sensitive Than Cones
WHAT are more sensitive to light than WHAT.
Rods take WHAT light to respond.
Rods have greater WHAT, which results in WHAT of the inputs of many rods into one ganglion cell, increasing the likelihood of its WHAT.
The trade-off is that rods cannot distinguish WHAT.
Convergence Causes Rods to Be More Sensitive Than Cones
RODS are more sensitive to light than CONES.
Rods take LESS light to respond.
Rods have greater CONVERGENCE, which results in SUMMATION of the inputs of many rods into one ganglion cell, increasing the likelihood of its RESPONSE.
The trade-off is that rods cannot distinguish DETAIL.

Less Convergence Causes Cones to Have Better Acuity
All-cone foveal vision results in high visual WHAT.
One-to-one wiring leads to the ability to discriminate WHAT.
The trade-off is that cones need more WHAT to respond than rods.
Less Convergence Causes Cones to Have Better Acuity
All-cone foveal vision results in high visual ACUITY.
One-to-one wiring leads to the ability to discriminate DETAILS.
The trade-off is that cones need more LIGHT to respond than rods.

Centre-Surround Receptive Fields
A receptive field is an area in the retina that, when stimulated, influences the WHAT of the neuron associated with it
Centre-Surround Receptive Fields
A receptive field is an area in the retina that, when stimulated, influences the FIRING of the neuron associated with it
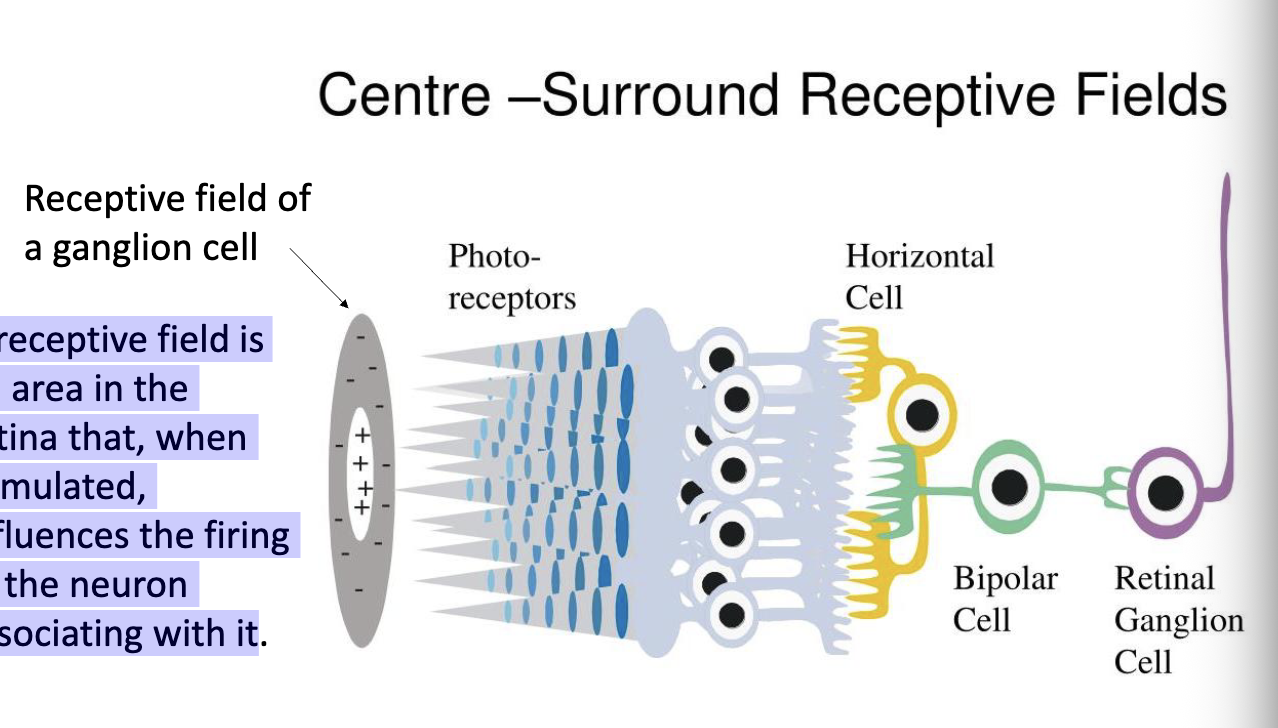
Keffer Hartline was awarded the Nobel Prize in 1967 for his discovery of the WHAT of a WHAT neuron.
Keffer Hartline was awarded the Nobel Prize in 1967 for his discovery of the RECEPTIVE FIELD of a SINGLE neuron.

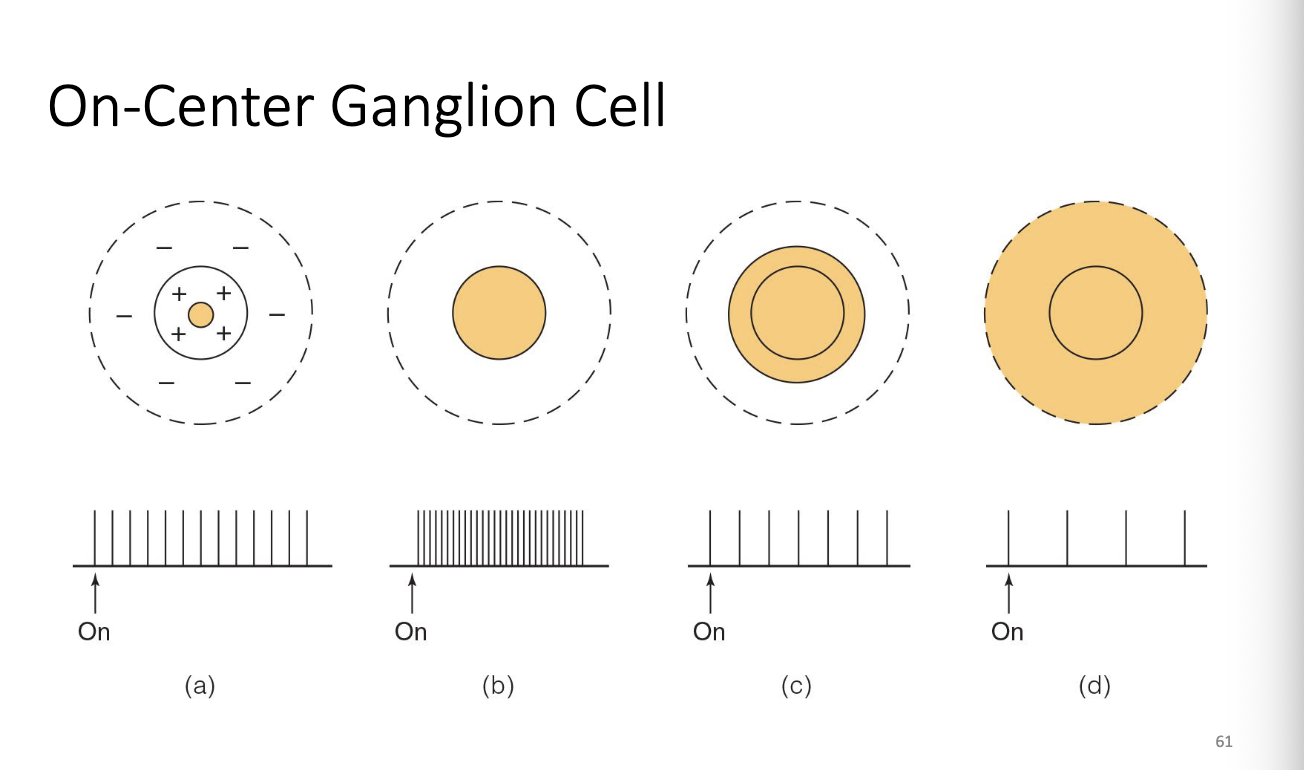
On centre-ganglion cell
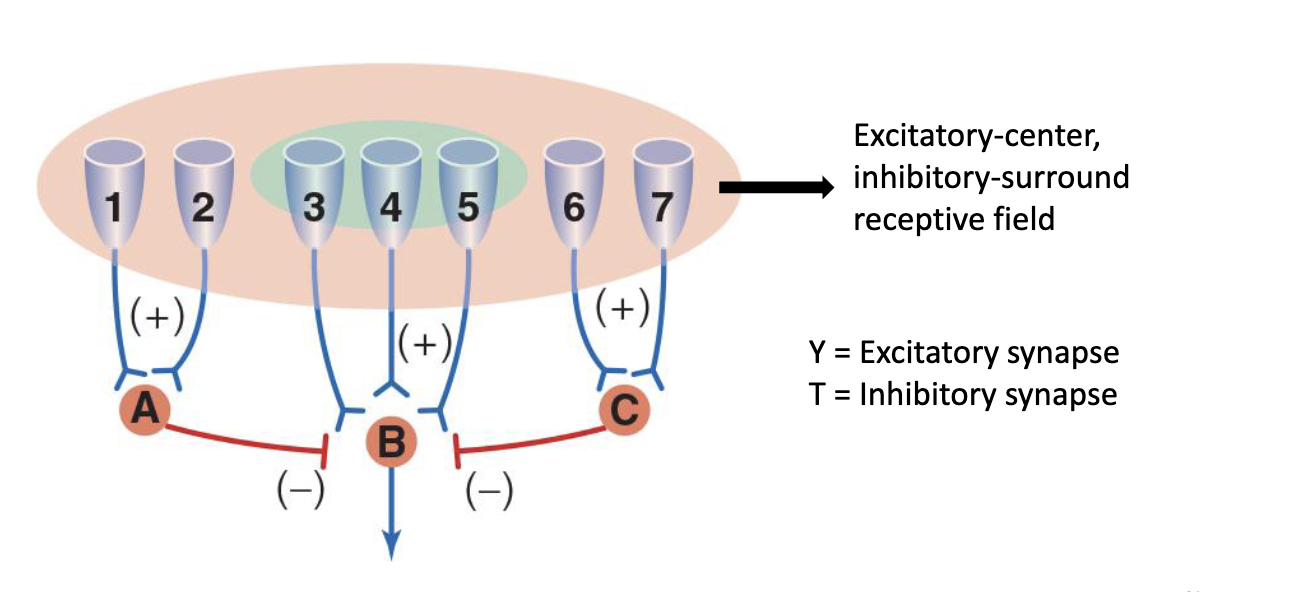
Lateral inhibition
a neural process where an excited neuron reduces the activity of its neighboring neurons

Center-Surround Antagonism
Mach band effect
An optical illusion named after the physicist WHAT
An increase in perceived WHAT at borders between regions of the WHAT (i.e., an edge enhancement effect).
Mach band effect
An optical illusion named after the physicist ERNST MACH
An increase in perceived CONTRAST at borders between regions of the VISUAL FIELD (i.e., an edge enhancement effect).

Chevreul illusion
The perceived light & dark bands at the borders, which are not present in the actual physical stimuli.


Criticism: How about the presence of the OFF-center receptive field?
An OFF-center receptive field produces the OPPOSITE firing pattern, which will offset the ON-center firing pattern. Using only an ON-center receptive field to explain the illusion is a BIASED explanation.

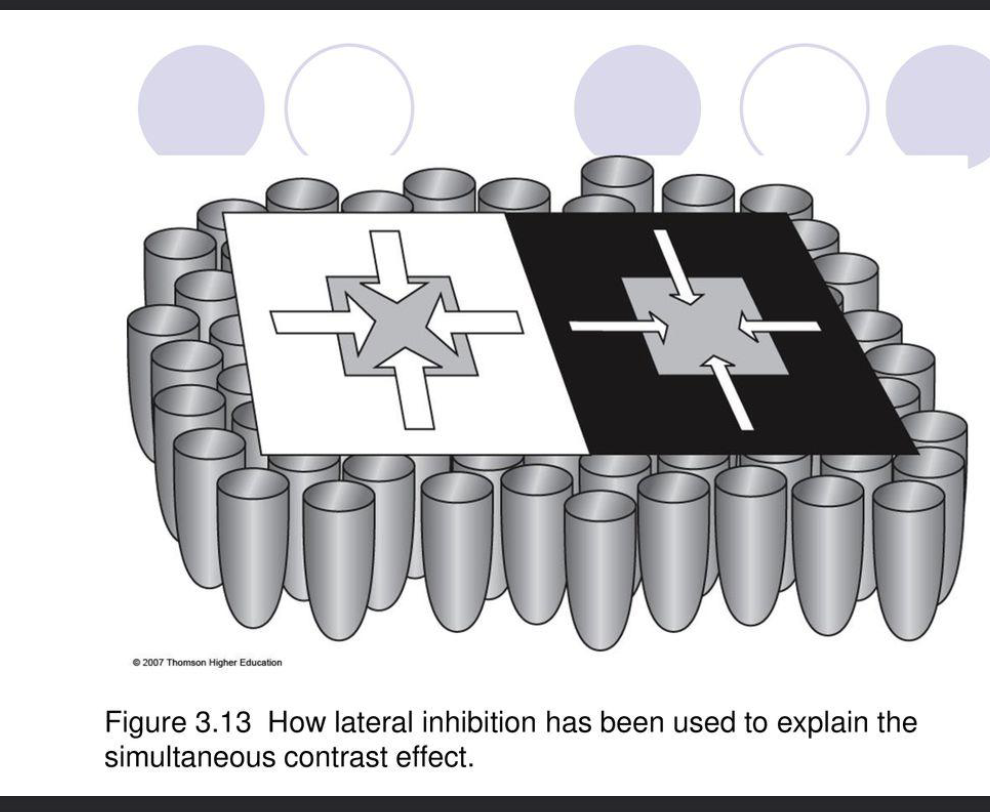
Chevreul effect based on lateral inhibition
Each bipolar cell sends WHAT to its neighbours
If we know the initial WHAT of each receptor and the amount of WHAT, we can calculate the final WHAT of each bipolar cell
Chevreul effect based on lateral inhibition
Each bipolar cell sends INHIBITION to its neighbours
If we know the initial OUTPUT of each receptor and the amount of LATERAL INHIBITION, we can calculate the final OUTPUT of each bipolar cell

The size of an arrow indicates the amount of WHAT inhibition. Because the square on the left receives more WHAT, it appears darker.
The size of an arrow indicates the amount of LATERAL INHIBITION inhibition. Because the square on the left receives more INHIBITION, it appears darker.
Wald
The Wald’s WHAT
WHAT of rods and cones
Wald
The Wald’s VISUAL CYCLE
SPECTRAL SENSITIVITY of rods and cones
Hartline
WHAT recording
WHAT of a single neuron
WHAT network
WHAT (the horseshoe crab study)
Hartline
SINGLE FIBER recording
RECEPTIVE FIELD of a single neuron
OPTICAL NERVE network
LATERAL INHIBITION (the horseshoe crab study)