Statistics Exam 4 Study Guide
1/131
There's no tags or description
Looks like no tags are added yet.
Name | Mastery | Learn | Test | Matching | Spaced |
|---|
No study sessions yet.
132 Terms
Gold Standard
Most accurate test available available to diagnose a disease (used as a benchmark to compare new tests)
Test Variable
Screening Variable (test result: positive or negative)
State Variable
Disease State (does the patient have/doesn’t have disease) or Gold Standard
Sensitivity
True Positive (accurately identifies the presence of a disease)
False Positive
Test indicates a disease is present in that patient, when it actually is not present
Specificity
True Negative (accurately indicates that the disease is not present)
False Negative
Test indicates that the disease is not present in the patient, when it actually is present
Highly Sensitive Test
Very good at identifying the patient with a disease (has a low percentage of false negatives)
Low Sensitivity Test
Limited in identifying the patient with a disease (has a high percentage of false negatives)
If a sensitive test has negative results, the patient is…
Less likely to have the disease
High Specific Test
Very good at identifying patients without a disease (low percentage of false positives)
Low Specific Test
Limited in identifying patients without a disease (high percentage of false positive)
If a specific test has positive results, the patient is…
More likely to have the disease
A
True Positive (# of people who have the disease and the test is positive)
B
False Positive (# of people who don’t have the disease and the test is positive)
C
False Negative (# of people who have the disease and the test is negative)
D
True Negative (# of people who don’t have the disease and the test is negative)
Sensitivity
Probability of having the disease (true positive rate)
Sensitivity Formula
A ÷ (A + C)
Specificity
Probability of the absence of disease (true negative)
Specificity Calculation
D ÷ (B + D)
False Positive Calculation
Probability of no disease but having a positive test result (false positive rate)
False Positive Calculation Formula
B ÷ (B + D)
False Negative Calculation
Probability of having the disease but having negative test
False Negative Calculation Formula
C ÷ (C + A)
Likelihood Ratios
Calculated using sensitivity and specificity to determine the likelihood that a positive test result is a true positive and a negative test result is a true negative
Positive Likelihood Ratio
Ratio of the true positive results to false positive results
Positive Likelihood Ratio Formula
Sensitivity ÷ (1 - Specificity)
Negative Likelihood Ratio Formula
(1 - Sensitivity) ÷ Specificity
Negative Likelihood Ratio
Ratio of true negative results to false negative results
Likelihood Ratio > 1.0
Increased Likelihood of Disease
Likelihood Ratio < 1.0
Decreased Likelihood of Disease
Very High Likelihood Ratio (>10)
“Rule In” → Indicate that the patient has the disease
Very Low Likelihood Ratio (<0.1)
“Rule Out” → Chance that the patient has the disease extremely reduce
Positive Predictive Value (PPV)
Tells you what the probability is that a subject actually has disease given a positive test result
What is Positive Predictive Value (PPV) dependent upon?
Prevalence of Illness + Sensitivity + Specificity
Positive Predictive Value (PPV) Formula
True Positives (A) ÷ Total # Who Tested Positive (A + B)
Prevalence Formula
(A + C) ÷ (A + B + C + D)
Negative Predictive Value (NPV)
If the subject screens negative, this tells you the probability that the patient really doesn’t have the disease
Negative Predictive Value (NPV) Formula
(D) ÷ (C + D)
Efficiency
Measure of the agreement between the screening test and the actual clinical diagnosis
Efficiency Formula
((A + D) ÷ (A + B + C + D)) x 100
Cohort Study
Follows a group of people overtime to see who develops a disease (starts with expose, looks for outcome)
Case-Control Study
Starts with people who have the disease (cases) and compares them to people without it (controls), looks backward to see exposure history
Cross-Sectional Study
Measures exposure and outcome at the same time, snapshot of a population
Relative Risk/Risk Ratio Formula
(A ÷ A + B) ÷ (C ÷ C + D)
RR < 1
The group that was exposed had fewer cases develop than the group that was not exposed (exposure may be a protective factor)
RR = 1
No association between the exposure and the illness
RR > 1
Group that was exposed has a higher incidence rate than the group that was not (exposure may be a risk factor)
P
Value of the associate chi-square indicates whether or not our RR value is statistically significant
Attack Rates
Used to determine the origin of an outbreak (specifically foodborne pathogens like listeria)
Attack Rates Formula
# of sick ÷ # of exposed
Odds Ratio
Obtains an indication of association when IV/DV are dichotomous (ratio of odds of an event occuring in one group to the odds of it occurring in another group)
What type of research design does Odds Ratio utlize?
Randomized Experimental, Quasi, Comparative, and Associational
In Odds Ratio, what must the dependent variable be?
Dichotomous
Odds Ratio Assumptions
No Repeated Measures and Dichotomous Variables
Odds Ratio Formula
AD / BC
Converting OR → Natural Log
Ln(OR)
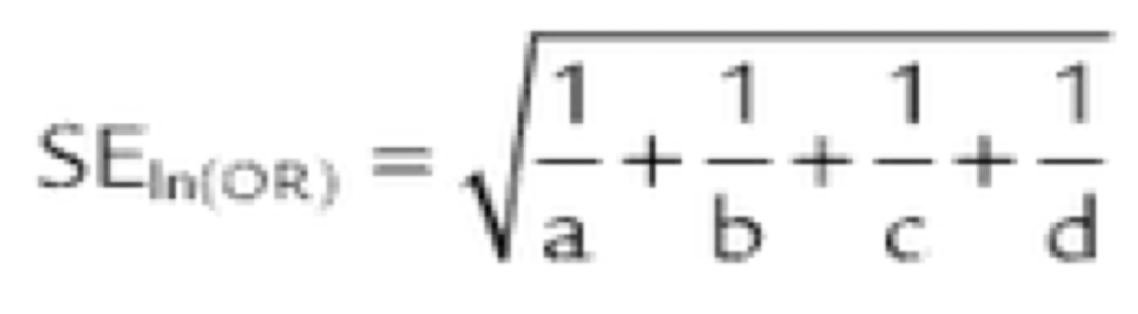
Standard Error of Ln(OR) Formula
95% Confidence Interval Formula
Ln(OR) ± SE(t)
Upper Limit and Lower Limit of CI Formula
ELower Limit of CI
EUpper Limit of CI
OR of = 1.0
No Affect/Relationship
OR of > 1.0
Higher Odds
ANOVA
Examines differences in 3+ groups with repeated measures
Calculated F-Ratio (ANOVA)
Indicates the extent to which group means differ taking into account the variability within the groups
Does the result of an ANOVA test tell us WHERE the difference is or IF there is a difference?
Tells us IF there is a difference
P Value > 0.05
Insignificant
If the results are insignificant, what does the researcher do to the null hypothesis: ACCEPT/DENY?
Accepts Null Hypothesis
One-Way ANOVA (Simplest)
1 Independent Variable, 1 Dependent Variable
Repeated ANOVA
Same variable(s) are repeatedly measured over time (determines the change that occurs in the dependent variable with exposure to independent variable)
ANOVA Assumptions
Randomly Sampled + Normally Distributed
Mutually Exclusive
Equal Variance (Homogeneity)
Indepdent Observations
DV = Interval/Ratio
Statistic for ANOVA
F
Group Degrees of Freedom (ANOVA)
(# of Groups - 1)
Error Degrees of Freedom (ANOVA)
(# of Participants - # of Groups)
What does P indicate in an ANOVA?
Significance of F-Ratio
Post Hoc Analyses
Developed to determine WHERE the differences lie (example: using a experimental, placebo, and comparison group)
What happens to the alpha level in a post hoc analyses when trying to locate the statistically significant difference?
Reduces/decreases in proportion to the number of additional tests required
As the alpha value level is decreased, reaching the level of significance becomes
Increasingly more difficult
Newman-Keuls
Compares ALL possible pairs of means and is the most liberal (alpha value is not as severely decreased)
Tukey HSD
Computes 1 value with which all means within the data set are compared: requires approximately equal sample sizes in each group (more stringent than Newman)
Dunnett
Requires a control group: the experimental groups are compared with the control group without a decrease in alpha
ANOVA Research Designs
Randomized Experimental
Quasi-Experimental
Comparative Design
Independent Variable in ANOVA
Active or Attributional
ANOVA (F) Formula
F = (Variance Between Groups) ÷ (Variance Within Groups)
What does the between groups variance represent?
Difference between the groups/conditions being compared
What does the within groups variance represent?
Differences among/within each group’s data
Pearson Chi-Square
Inferential statistical test to examine differences among groups with variables measure at the nominal level
Pearson Chi-Square Statistic
X2
Pearson-Chi Square Assumptions
Nominal level, adequate sample size, independent observations
What does Pearson-Chi Square compare?
Compares the frequencies that are observed with the frequencies that are expected (Calculated X2 values are compared with the critical X2 values)
If the result is greater than or equal to the value in the table… (Pearson-Chi Square)
Significant differences exist and thus the null hypothesis is rejected
Pearson Chi-Square Degrees of Freedom
(Rows - 1) (Columns - 1)
Example: In a 2×2 table → (2 - 1) (2 - 1) = 1
Pearson Chi-Square Research Design
Randomized experimental, quasi-experimental, comparative design
Pearson Chi-Square Variables
Active and/or Attributional
One Way X2
Statistic that only compares different levels of 1 variable only
Two Way X2
Statistic that tests whether proportions in levels of 1 nominal variable are significantly different from proportions of the second nominal variable
What analysis determines the location of the difference?
Post Hoc Analysis
What is the weaker statistical test used? (The results are only reported if statistically significant results were found)
Pearson Chi Square (X2)
Pearson Chi-Square Requirements
1 data entry made for each subject, nominal level, mutually exclusive and exhaustive, sensitive to small sample sizes and other tests
Alternative to Pearson’s R
Spearman Rank