Chapter 7: Sampling Distributions
1/18
There's no tags or description
Looks like no tags are added yet.
Name | Mastery | Learn | Test | Matching | Spaced |
|---|
No study sessions yet.
19 Terms
Random Sample
A sample derived from a particular probability sampling method with 𝑛 observations
(𝑿𝟏, 𝑿𝟐, … ,𝑿𝒏), 𝑛 is the measure taken from the 𝑛th element in the sample
Definition of random sample of size n from an finite population
A sample with n distinct elements from a population consisting of N elements, using a probability sampling method, and consisting of Xi being the measure taken from the ith element in the sample.
Conditions for a random sample of size n from a FINITE population
Sample selected by SRSWOR
n elements are distinct
Definition of random sample of size n from an infinite population
A sample generated by a series of 𝑛 INDEPENDENT trials that are performed under IDENTICAL conditions (independent and identically distributed)
Conditions for a random sample of size n from an INFINITE population
Sample selected via SRSWR
if replacement is done, then trials are independent from one another & population does not change every draw
Does not depend on the physical population nor values of Xi,
Statistic
A random variable that is any function of 𝑋1, 𝑋2 , …, 𝑋𝑛
Conditions of a statistic
value depends on the outcome of the random experiment (probability sampling)
must have a probability distribution of a CDF or a PMF/PDF
has an expected value, variance, and standard deviation
Sampling Distribution
A probability distribution of the statistic
Standard Error
The standard deviation of a statistic, used to measure the reliability of our statistic
Standard deviation vs. Standard error
Standard Deviation → measures the variation within a set of measurements
Standard error → same as standard deviation, but the measurements are the possible values of a certain statistic
Central Limit Theorem
If 𝑋̅ is the mean of random sample of size 𝑛 taken from a large or infinite population with mean 𝜇 and variance 𝜎², then the sampling distribution of 𝑋̅ is approximately normally distributed with mean 𝐸(𝑋̅) = 𝜇 and variance 𝑉𝑎𝑟(𝑋̅) = 𝜎²/𝑛 , as long as 𝑛 is sufficiently large.
Condition for CLT to work
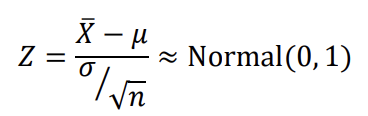
Even if the population from where the sample came from is not normally distributed, as long as it has finite mean and finite variance, then 𝑋̅ is approximately distributed as Normal (𝜇, 𝜎²/𝑛 ) given a sufficiently large sample size (𝑛 > 30)
Formula to standardize the random variable 𝑋̅
T-distribution charactaristics
one parameter —- degrees of freedom (v)
𝑋~𝑡(𝑣)
similar to standard normal distribution
bell-shaped
symmetric about 0
tails approach the x-axis without ever touching it
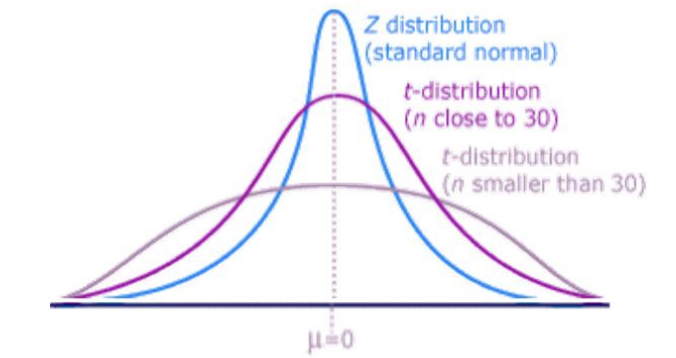
Difference between normal distribution and t-distribution
t-distribution has a larger variance than N(0,1)
as v increases, the variance of the t-distribution goes to 1
when v > 30, the t-distribution is almost the same as N(0,1)
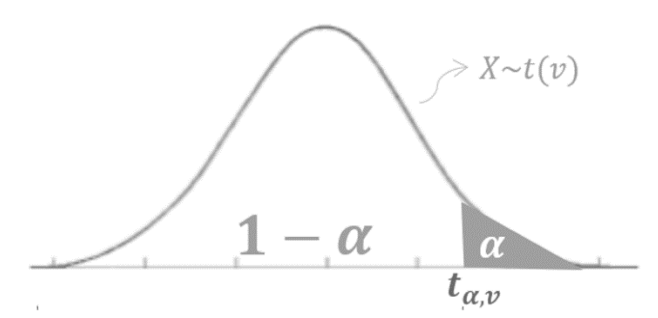
t-table interpretation
The 𝑡-table gives the values of 𝑡𝛼,𝑣, or the 100(1 − 𝛼)th percentiles of 𝑡(𝑣)
𝛼 = 0.10, 0.05, 0.025, 0.01, 0.005
𝑣 = 1,2, … ,30.
Definition: 𝒕𝜶,𝒗 is a number in the 𝑥-axis such that the area under the PDF of 𝑡(𝑣) to the right of 𝑡𝛼,𝑣 is 𝛼
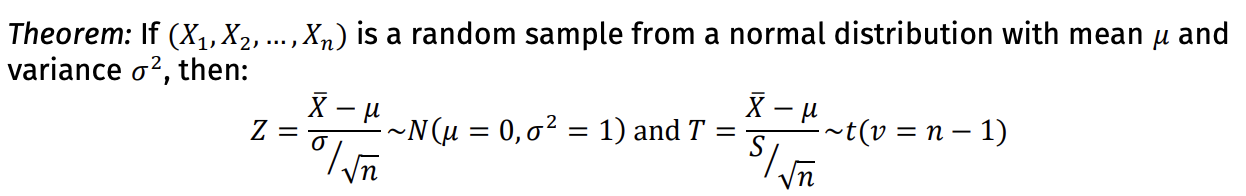
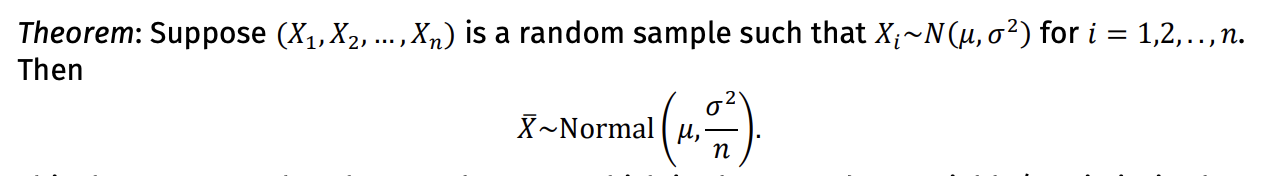
Theorem for the Sampling Distribution of the Sample Mean from a Normal Population
The sample mean (a random variable/statistic) is also normally distributed
the mean of the sample means is the same as that of the parent population
the variance of the sample means is the variance of the parent population divided by the sample size
Difference between CLT and “Theorem on sampling distribution of the sample mean from a normal population”
Theorem assumes all Xis are normally distributed & 𝑋̅ is exactly normally distributed (does not require a large n)
CLT has the parent population as any large/infinite population & 𝑋̅ is approximately normal
Theorem on Sampling Distributions of Some Common Statistics based on a Random Sample from a Normal Distribution