APES Unit 3 Test Review (MCQs)
1/43
Earn XP
Description and Tags
the terms look really long, but its just because they are in multiple choice format. also, i gave explanations for the answers, but bolded the answers themselves, so you don't have to read the answer explanations if you don't want to
Name | Mastery | Learn | Test | Matching | Spaced |
|---|
No study sessions yet.
44 Terms
the biotic potential of a population
a. occurs at the population’s carrying capacity
b. depends on the limiting resources of the population
c. increases as the population size increases
d. occurs only under ideal conditions
D, occurs only under ideal conditions; this is true because biotic potential is modeled on an exponential growth model, where there are no limiting resources to limit growth or cause carrying capacity, or in other words, ideal conditions
which is expected for a niche generalist?
a. many food sources
b. a narrow temperature range
c. limited adaptability to changing conditions
d. few suitable habitats
A, many food sources; this is true because only this option is the only one that gives an example of how generalists can live in a wide variety of biotic conditions
an r-selected species characteristically has
a. a type I survivorship curve
b. few offspring
c. a population near carrying capacity
d. a fast population growth rate
D, a fast population growth rate; only this option fits the description of a r-selected species because r-selected species typically have a type III survivorship curve, many offspring, a population that constantly experiences overshoot and dieback (far from carrying capacity), and a fast population growth rate
which is true of a population overshoot?
a. it occurs when reproduction quickly responds to changes in food supply
b. it is typically followed by a dieback
c. it is common in K-selected species
d. it occurs when a species stops growing after reaching the carrying capacity
B, it is typically followed by a dieback; this is true because when population overshoot occurs, that means that it exceeds the carrying capacity and that there is not enough resources to sustain the growth, leading to deaths (think of it like pouring water in a cup: if you pour more water than the cup can hold, the cup will overflow because it cannot sustain the amount of water being poured)
which of the following is not common in K-selected species?
a. long time to reproductive maturity
b. little parental care
c. long lifespan
d. small number of offspring
B, little parental care; this is the answer because K-selected species DO take a long time to reach reproductive maturity, DO have long lifespans, and DO have a small number of offspring, whereas r-selected species give little parental care to their offspring
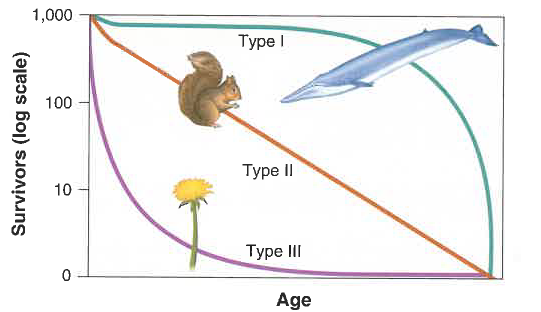
black bears have lifespan of 18 yrs, have 2-3 cubs at a time, cubs remain with mother for 2 yrs. black bears likely fall under which survivorship curve?
a. type I
b. type II
c. type III
d. not enough info
C, type III; this is the answer because the black bears have a relatively long lifespan and are given extensive parental care, which is typical of K-selected species, and K-selected species typically display type III survivorship when modeled on a survivorship curve
raccoons: live in wide variety of environments, feast on virtually everything because they are omnivores
koalas feed only on eucalyptus leaves, only can live in a few environments
based on this, which of the following describes the raccoons and the koalas?
a. raccoons are specialists only
b. koalas are generalists only
c. raccoons are generalists and koalas are specialists
d. raccoons are specialists and koalas are generalists
C, raccoons are generalists and koalas are specialists; this is the answer because the raccoons can live in a wide range of biotic conditions (making them generalists) and the koalas can only thrive in a narrow range of biotic conditions (making them specialists)
the J-shaped curve is a classic representation of
a. a population at the carrying capacity
b. declining populations
c. exponential growth
d. growth under limiting conditions
C, exponential growth; this is the answer because exponential growth, which models population growth according to biotic potential, makes a J-shape when graphed
which is true about a population’s carrying capacity?
a. it is denoted as C
b. it is determined by a limiting resource
c. it is controlled by density-independent factors
d. it is always known
B, it is determined by a limiting resource; this is the answer because carrying capacity is determined by density-dependent limiting resources, such as food, because if food is limited, then a population can not grow to full biotic potential
logistic growth models incorporate a time with almost unlimited growth and
a. a time with growth that approaches the carrying capacity
b. a time with no growth
c. nothing else
d. a time with a rapid decrease in growth
A, a time with growth that approaches the carrying capacity; this is the answer because logistic models (S-curves) show a period of rapid growth which eventually levels off to an asymptote (carrying capacity)
which is true of a population overshoot?
a. it occurs when reproduction quickly responds to changes in food supply
b. it is followed by a dieback
c. it is most likely to be experienced by K-selected species
d. it occurs when a species stops growing after reaching the carrying capacity
B, it is followed by a dieback; this is correct because when a population exceeds or overshoots it’s carrying capacity, members die because the environment can not sustain the growth → dieback
what usually happens when a resource base decreases?
a. the population grows
b. the carrying capacity increases
c. population growth decreases
d. the predator population normally increases
C, population growth decreases; this is the answer because as a resource base decreases, the population and its growth decreases, carrying capacity decreases, and the predator population does not increase as a result of a resource base decrease
which is an example of a density-independent factor?
a. limited water for plants
b. limited prey for predators
c. a fixed amount of grass for dairy cows
d. a hurricane
D, a hurricane; this is the answer because a hurricane makes a population decrease because it is a natural disaster, whereas the other answer choices are quantitative, biotic factors that, if limited, would devastate a population (density-dependent)
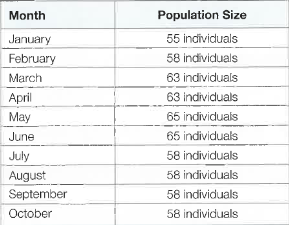
in the table shown, the population goes up and down seasonally; this is known as
a. overshoot
b. dieback
c. oscillation
d. carrying capacity
C, oscillation; this is correct because ‘oscillation’ is a term that refers to the cycle of overshoot and dieback, which is seen in this table; it would also not make logical sense if the answer were any of the other terms
thomas malthus introduced
a. the study of human demographics
b. the hypothesis that humans could exceed earth’s carrying capacity
c. the concept of variation in replacement-level fertility due to differences in industrialization
d. the age structure diagram
B, the hypothesis that humans could exceed earth’s carrying capacity; this is correct because this aligns with his belief that while food production grows linearly (/), human population grows exponentially (J), which means we will exceed our carrying capacity at some point
a country has a net migration rate of 3 per 1000, a CBR of 9 per 1000, and a CDR of 11 per 1000. what is the growth rate of this country (%)?
a. 0.1 percent
b. 0.2 percent
c. 0.5 percent
d. 1 percent
A, 0.1 percent; this is correct given the formula in the image. the net migration rate being positive means that there are 3 more immigrants per 1000 than there are emigrants per 1000, meaning that this is added to the birth rate of 9 per 1000 to represent growth (and you get 12). after this, we subtract 11 from our answer and get net growth of 1 person (per 1000), and 1/10 = 0.1%.

replacement level fertility in a developed country is roughly equal to
a. 1.5
b. 1.8
c. 2.1
d. 2.4
C, 2.1; this is correct because most countries have a RLF of about 2.0-2.1 once developed
an age-structure diagram that is a pyramid shape indicates that a country is
a. experiencing more deaths than births
b. growing rapidly
c. not growing
d. gradually decreasing in population size
B, growing rapidly; this is correct because pyramid-shaped age-structure diagrams indicate a rapidly growing population, a high infant mortality, and a little percentage of the population being of old age
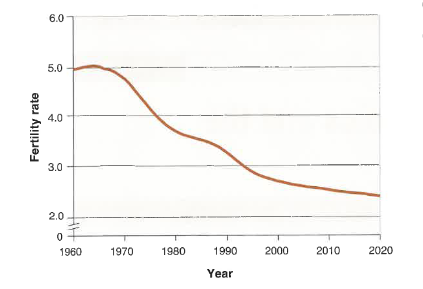
the total fertility rate of the world population over time is shown in this graph. explain the best cause of the pattern seen in total fertility in this time period.
a. TFR has decreased due to the decrease in available birth control
b. TFR has increased due to the education of women
c. TFR has decreased because employment and education conditions have improved for women
d. TFR has decreased because of employment and education conditions for men
C, TFR has decreased because employment and education conditions have improved for women; this is correct because as education and workforce opportunity for women increases, TFR typically decreases
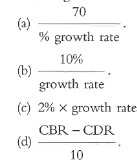
doubling time can be approximated mathematically by (choices in image)
A, 70 / % growth rate; this is correct according to the rule of 70, which approximates doubling time
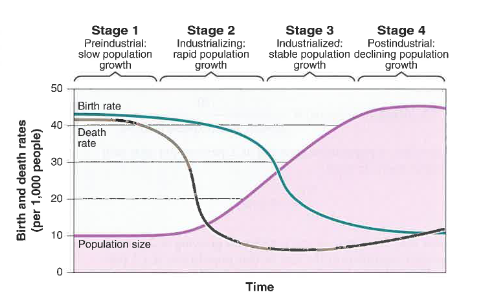
according to the theory of demographic transition, countries move through growth stages in which order?
a. stable growth, rapid growth, slow growth, declining growth
b. rapid growth, slow growth, stable growth, declining growth
c. slow growth, declining growth, rapid growth, stable growth
d. slow growth, rapid growth, stable growth, declining growth
D, slow growth, rapid growth, stable growth, declining growth; this is correct because according to the stages of demographic transition depicted in this image, population growth is very slow in the pre-industrial stage, but begins to grow quickly in the industrializing stage. then, there is stable growth in the industrialized stage, and then finally declining growth in the postindustrial stage
which of the following likely reduces fertility rate the most?
a. birth control for men
b. government ad campaigns for birth control
c. decreasing income of populations
d. increased education of women
D, increased education of women; this is correct because in comparison to the other choices, increased education of women most directly reduces fertility rate. things like birth control for men, government campaigns, and income do not bear as great an impact on TFR
the IPAT equation was developed to estimate
a. the affluence of a country’s population
b. the rate of demographic transition
c. the impact of human lifestyles on earth
d. the gross domestic product of a country
C, the impact of human lifestyles on earth; this is correct because IPAT represents 3 major factors that influence environmental Impact: Population, Affluence, Technology
approximately what percentage of the population of developed countries lives in urban areas?
a. 44 percent
b. 50 percent
c. 75 percent
d. 86 percent
D, 86 percent; this is correct because the majority of people living in developed countries live in urban areas (over 80%, to be exact), and this answer choice is the closest representation of this
which is true regarding limiting resources?
a. a limiting resource is an important density-independent factor
b. a limiting resource is common to all members of a population
c. abundance of predators is an example of a limiting resource
d. the number of reproducing individuals in a population is a limiting resource
C, abundance of predators is an example of a limiting resource; this is correct because predators’ abundance limits the extent to which a population can grow. also, limiting resources are density-dependent factors, are not always common to all members of a population, and the number of reproducing individuals is not a limiting resource
which characteristic will species with a type III survivorship curve most likely exhibit?
a. slow population growth rate
b. density-dependent population regulation
c. little to no parental care
d. large body size
C, little to no parental care; this is correct because a type III survivorship curve most accurately models a r-selected species’ survivorship, and r-selected species have little to no parental care, but the other answer choices describe k-selected species
which of the following will lead to an increase in the carrying capacity of the global human population?
a. consuming food at a higher trophic level
b. decrease in technological advancements
c. increase in per capita consumption rate
d. lower consumption of meat products
D, lower consumption of meat products; this is correct because this will result in less resources being required per capita for food, because consuming food at a lower trophic level provides more efficient energy, and using less resources per capita will ultimately increase carrying capacity
in vietnam, there were 16 births and 6 deaths out of every 100 people in 2011. using rule of 70, estimate doubling time for vietnam’s population
a. 0.7 years
b. 7 years
c. 0.14 years
d. 1.4 years
B, 7 years; this is correct given the doubling time/rule of 70 formula, which states that 70 / % growth rate = doubling time (in yrs). to find the growth rate percentage, we first can multiply the 16 births per 100 and 6 deaths per 100 by 10 to get CBR and CDR, which ends up being 160 and 60, respectively. then, we can put these into the growth rate formula (CBR-DBR) / 10 to get the percentage, which ends up being (160-60) / 10 → 10%. lets plug this into the doubling time formula: 70/10=7
which of the following is most likely to describe a population in a developing country?
a. replacement-level fertility is less than 2.1
b. infant mortality is at 10 per 1000 live births or more
c. immigration is very high
d. the age structure will be shaped like a pyramid
D, the age structure will be shaped like a pyramid; this is correct because the pyramid shape of the age-structure diagram indicates high birth rates, lower life expectancy, and rapid population growth. though b could be correct, it is not as definite as d

which of the countries above is likely to have the highest growth rate?
a. democratic republic of congo
b. united states
c. germany
d. unable to determine
A, democratic republic of congo; this is correct because pyramid-shaped age-structure diagrams indicate a rapid growing population, and therefore a very high growth rate
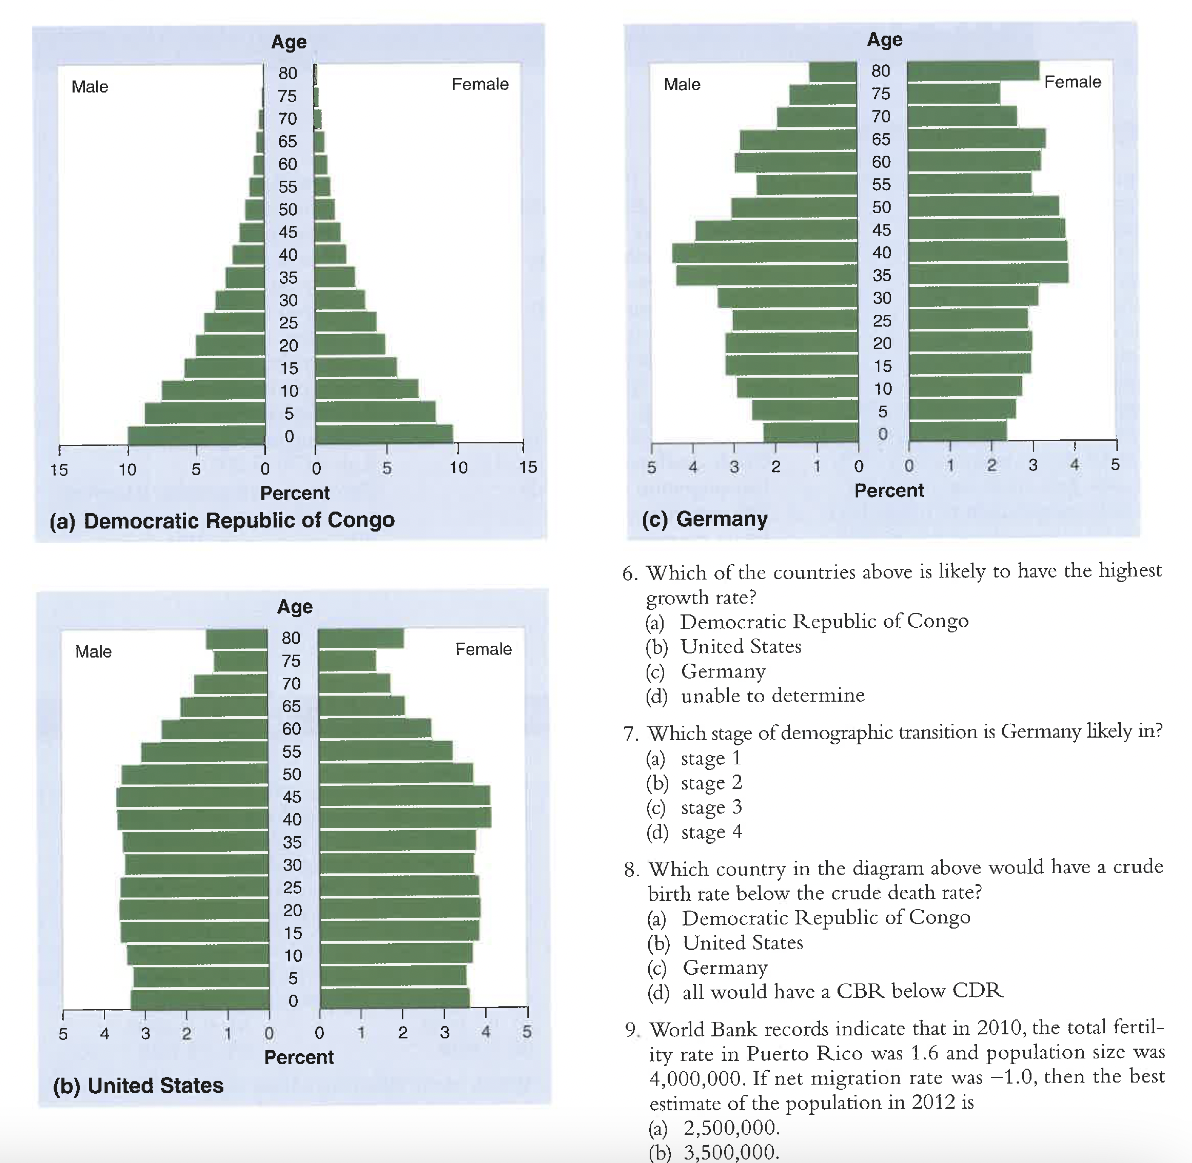
which stage of demographic transition is germany likely in?
a. stage 1
b. stage 2
c. stage 3
d. stage 4
C, stage 4; this is correct because stage 4 is the postindustrial stage, when much of development has occured, the population is high, and there is not a high birth rate or a high death rate. it looks most like the inverted age-structure diagram that corresponds with stage 4

which country in the diagram would have a crude birth rate below the crude death rate?
a. democratic republic of congo
b. united states
c. germany
d. all would have a CBR below CDR
C, germany; this is correct because germany displays an inverted age-structure diagram, meaning that there are not many births and the births are likely outbalanced by deaths because of the postindustrial population demographic stage. the other populations are more densely populated with younger people, unlike germany
world bank records indicate that in 2010, the total fertility rate in puerto rico was 1.6 and population size was 4,000,000. if net migration rate was -1.0, then the best estimate of the population in 2012 is
a. 2,500,000
b. 3,500,000
c. 4,000,000
d. 4,500,000
B, 3,500,000; this is correct because the TFR is below replacement-level (2.1) and there is an equivalent of 4,000 people emigrating from the country per year. in the span of 2 years, this means that there are 8,000 people lost over the period. going from 4,000,000 to 3,500,000 indicates a 12.5 percent decline in population over the 2 years, which is reasonable and makes sense in the context
a developing country with a total fertility rate of 4.0 and a net migration rate of -3.5 is likely to have an age structure
a. shaped like a pyramid
b. shaped like an inverted pyramid
c. shaped like a column
d. that is variable depending on the demographic
A, shaped like a pyramid; this is correct because developing countries have a rapidly growing population and typically a pyramid-shaped age structure diagram. the negative migration rate affects the number of people, but not the diagram itself
which statement is true under the theory of demographic transition?
a. improved sanitation and health care lead to reduced population growth
b. population momentum holds birth rates stable while death rates increase
c. density independent factors slow economic growth
d. education reduces the growth rate of a population
D, education reduces the growth rate of a population; this is correct because according to the theory of demographic transition, as more education opportunities open for women, there are less babies born, and therefore a lower growth rate
increasing the gross domestic product of a nation ultimately leads to which of the following?
a. a decrease in population
b. an increase in birth and death rates
c. an increase in population size
d. a decrease in educational opportunities
C, an increase in population size; this is correct because GDP opens opportunities for better healthcare, resulting in less infant, child, and general mortality rates, as well as better nutrition, sanitation, and quality of life
a city has a CBR of 17 and a CDR of 15. ignoring immigration and emigration, when will the population double?
a. 20 years
b. 35 years
c. 200 years
d. 350 years
D, 350 years; this is correct because the doubling time can be calculated using the rule of 70, where 70 / % growth rate = years until the population will double. in this case, there is a growth rate of 0.2%, meaning that it will take 70 / 0.2 years to double, or 350 years.

which of the following is one of the author’s claims in the text?
a. immigration in the US is keeping growth rate high
b. there may be positive environmental impacts to declining population
c. US population is currently on the rise
d. the US population is declining but is expected to rise
B, there may be positive environmental impacts to a declining population; this is correct because the author addresses that the declining population could offer benefits to the environment such as “reducing environmental stresses” and “unwanted consequences of overcrowding”
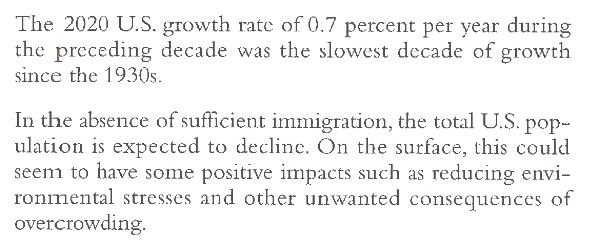
which of the following would be an environmental impact of a declining population?
a. less production of CO2 from vehicles
b. less resources available for fuel and production
c. more habitat loss for human living spaces
d. more water pollution due to more intensive farming practices
A, less production of CO2 from vehicles; this is correct because as population decreases, less vehicles would be used, resulting in less production of CO2 from vehicles. the other choices would happen because of a population increasing in size, not declining

a more developed country, like the US, consumes more beef than a less developed country even though a more developed country has a lower population. how much more land is required for beef than poultry meat?
a. 320 m2
b. 550 m2
c. 12 m2
d. 120 m2
A, 320 m2; this is correct because it best approximates the difference in land requirement between beef and poultry meat according to the graph (about 330 m2 - 10 m2

which of the following foods in a country in stage 2 of demographic transition most likely consume more of?
a. lamb and mutton
b. rice
c. beef
d. cheese
B, rice; this is correct because it sustains the rapidly growing population: because it is at a lower trophic level, it provides a more efficient source of energy by allowing people to obtain more energy from their food with minimal land usage (hint: look for the answer that stands out; all of the other choices are near the tippy top of the graph, rice is near the bottom)
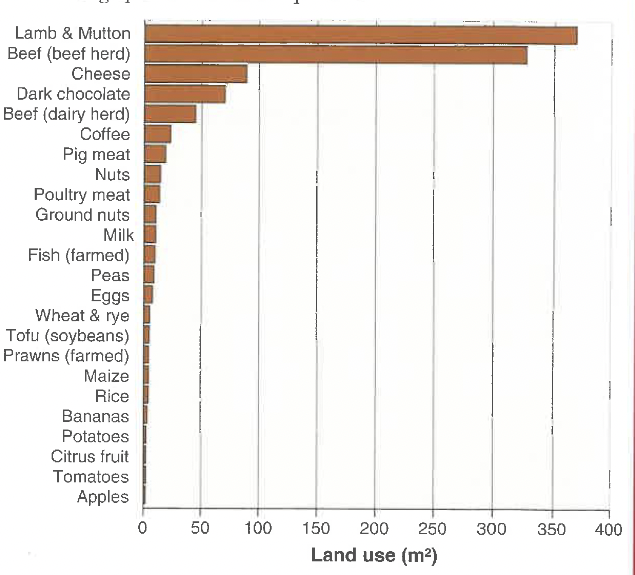
what conclusion can be made from the data in this graph?
a. populations consuming meat require much more land than those consuming plants and vegetables
b. populations consuming plants require much more land than those consuming meat
c. a population’s food consumption plays no impact on land use
d. if a population is using land to grow more meat, it is likely in stage 1 of demographic transition
A, populations consuming meat require much more land than those consuming plants and vegetables; this is correct because plants provide more efficient energy because they are at a lower trophic level, and thus require less land usage for the same amount of energy
as a country moves into stage 2 of the demographic transition, you would expect replacement level fertility to ____________ and crude death rate to ______________.
a. increase; decrease
b. decrease; increase
c. increase; increase
d. decrease; decrease
A, increase, decrease; this is correct because in stage 2 of demographic transition, there is a rapid increase in population, meaning that birth rate / RLF increases and death rate begins to decrease
if a population of 3.5 million people has a growth rate of 2.7 percent per year in 2010, what year would the population reach 14 million people?
a. 2062
b. 2036
c. 2088
d. 2050
A, 2062; this is correct because when plugging in 52 (the difference in years between 2062 and 2010) into the formula (initial population)(1 + growth rate decimal)years, you get (3500000)(1+0.27)52, which, when plugged into the calculator, is the solution closest to 14 million than any of the other options