Lvl2: Alternative Investments
1/36
There's no tags or description
Looks like no tags are added yet.
Name | Mastery | Learn | Test | Matching | Spaced | Call with Kai |
|---|
No analytics yet
Send a link to your students to track their progress
37 Terms
Energy
Natural gas can be consumed almost immediately after extraction from the ground
Crude oil, in contrast, has to be transformed into something else
pipeline and tanker reliability, seasonality (summer/winter), adverse weather (cold, hurricanes), automobile/truck sales, geopolitical instability, environmental requirements, economic (GDP) growth
Industrial/Precious Metals
most flexible life cycle
can be stored for months (if not years) resistance to spoilage
primarily influenced by central bank monetary policy, geopolitics, economic (GDP) growth
Livestock
grows year round, but good weather and access to high-quality pasture and feed accelerate weight gain
high risk of spoilage but advances in cryogenics
Speed of maturation to slaughter weight, economic (GDP) growth/consumer income, disease, adverse weather
Grain
demand for grains is year round
primarily influenced by weather (moisture, temperature), disease, consumer preferences, genetic modification, biofuel substitution, population growth
Softs
Coffee, cocoa, cotton, and sugar
primarily influenced by weather (moisture, temperature), disease, consumer preferences, biofuel substitution, economic (GDP) growth/consumer income
Commodities
tangible items with an intrinsic (but variable) economic value
do not generate future cash flows beyond what can be realized through their purchase and sale
derivative contracts
incurs transportation and storage costs
backwardation vs contango
backwardation: spot price > futures price - positive calendar spread
contango: futures price > spot price - negative calendar spread
insurance theory
normal backwardation
futures price has to be lower than the current spot price as a form of payment or remuneration to the speculator who takes on the price risk
but normal backwardation is not normal
Hedging Pressure Hypothesis
when both producers and consumers seek to protect themselves from commodity market price volatility with hedges
If the two forces are equal in weight, then one can envision a flat commodity curve
if producers are more interested in selling forward, then backwardation
if consumers are more interested in hedging, then contango
One issue is that producers generally have greater exposure to commodity price risk than consumers do
Theory of Storage
a commodity that is regularly stored should have a higher price in the future (contango) to account for those storage costs
supply dominates demand > contango
a commodity that is consumed along a value chain that allows for just-in-time delivery and use
demand dominates supply > backwardation
Futures price = Spot price of the physical commodity + Direct storage costs (such as rent and insurance) − Convenience yield.
total return
price return + roll return + collateral return + rebalance return
Price return = (Current price − Previous price)/Previous price
Roll return = [(Near-term futures contract closing price − Farther-term futures contract closing price)/Near-term futures contract closing price] × Percentage of the position in the futures contract being rolled. i..e., contango = negative roll return
collateral return = yield for bonds used to maintain investors futures position
rebalance return - from rebalancing the index’s component weights
roll return
industrial metals, agriculture, livestock, precious metals, and softs have statistically strong negative mean roll returns
Only energy has a statistical possibility of a positive mean roll return - but diminished after 2010
commodity swap
risk management and risk transfer
total return swap - returns = change in the level of the index
Basis swap - periodic payments are exchanged based on the values of two related commodity reference prices that are not perfectly correlated
Variance/volatility Swaps - periodically exchange payments based on the proportional difference between an observed/actual variance in the price levels of a commodity and some fixed amount of variance
commodity index
used as a benchmark to evaluate broader moves in commodity pricing
for macroeconomic or forecasting purposes
basis for an investment vehicle or contract
rebalancing frequency
rebalancing is more important if a market is frequently mean reverting
frequent rebalancing can lead to underperformance in a trending market because the outperforming assets are sold but continue up in price, whereas the underperforming assets are purchased but still drift lower
net operating income
NOI = Effective gross income – Operating expenses – Property maintenance allowance
effective gross income: gross rent * rentable space - vacancies
operating expenses: tax, insurance, service, repairs, utilities
property maintenance allowance: improvements/ maintenance capex (not to upgrade significantly)
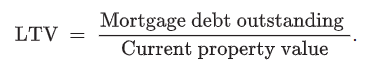
LTV ratio
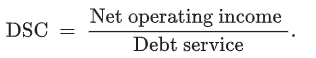
debt service coverage ratio
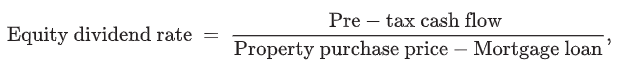
equity dividend rate
Pre-tax cash flow = Net operating income – Debt service.
After tax cash flows
After-tax cash flow = Pre-tax cash flow – Taxes
Taxes = t × (NOI – Interest expense – Depreciation expense)
REOCs vs REITS vs MBS
REOCs are taxable corporations that own, operate, and manage commercial real estate with few restrictions
located in countries that do not have a tax-advantaged REIT regime
development of for-sale real estate properties
offer other non-qualifying services, such as brokerage and third-party property management
REITs are restricted to primarily owning and operating rental properties or purchasing mortgages and are required to distribute nearly all or all of their earnings to investors to avoid paying corporate income tax
equity REITs - own real estate
mortgage REITs - make or invest in loans secured by real estate
MBS
rights to receive cash flows from portfolios of mortgage loans
FFO - Funds from operations
common measure of REIT performance
FFO = Net income + Depreciation + Amortization – Net gains from property sales
Investors believe that real estate maintains its value to a greater extent than other business assets so depreciation deductions under IFRS and US GAAP do not represent economic reality
Real estate - appraisal based vs transaction index
Appraisal: combine valuation information from individual properties
Transaction: actual transactions
Appraisal based - tend to lag a rising/falling market
may not be appraised every quarter
If the index is used for comparison with other asset classes that are publicly traded, however, appraisal lag is more of an issue
appraisal-based indexes may underestimate the volatility of real estate returns
Adjustment for Appraisal Lag
Rt* = aRt + (1 – a)Rt–1*.
a reflects the speed at which actual returns are reflected in appraisal-based returns - higher a represents more rapid 0<a<1
Rt is actual return
Net Asset Value Approach
includes:
value of any non-asset-based income streams (e.g., fee or management income)
value of non–real estate assets, including cash
net of the value of any contingent liabilities
value added by management of the REIT or REOC
NAVPS = (Market value of assets – Market value of liabilities)/Number of shares
NOI = (Gross rental revenue – Estimated vacancy and collections loss – Operating expenses).
goodwill, deferred financing expenses, and deferred tax assets will be excluded to arrive at a “hard” economic value for total assets
“soft” liabilities as deferred tax liabilities will be removed
remove non-cash rent from straightlining
Investing in REITs
Liquidity
Transparency: Readily available share prices and transaction histories
Diversification of property holdings: By property type, geography, and underlying tenant credit
High-quality portfolios
Active professional management
Potentially stable income
Tax efficiency: passthrough structures avoid corporate income taxation, leaving only the investor to pay taxes on dividends received - single tax
Lack of retained earnings
Regulatory costs
Limited in types of assets owned
Relative Value Approach
Adjusted funds from operations
AFFO = (FFO – Non-cash rent – Recurring capex)
P/FFO and P/AFFO
P/FFO and P/AFFO Multiples advantages & disadvantages
widely accepted in evaluating shares across global stock markets and industries.
FFO estimates are readily available through market data providers
can be used in conjunction with such items as expected growth and leverage levels to deepen the relative analysis
may not capture the intrinsic value of all real estate assets held e.g. non-income-producing assets
does not adjust for the impact of recurring capital expenditures
more difficult to compute with increased level of such one-time items as gains and accounting charges,
Characteristics of hedge funds
less regulatory constraints (except liquid alts)
flexible mandates
large investment universe
aggressive investment style - risky
liberal use of leverage
liquidity constraints
high fee structures- % of AUM for management fees and 10-20% of annual returns for incentive fees
classification of funds
single manager fund - one strategy
multi-strategy fund - multiple diff strategies
fund of funds - capital allocated to separate hedge funds that themselves run a range of diff strategies
single hedge fund strategies
equity-related - equity markets
event-driven - M&A, bankruptcy, other events
relative value - relative valuation between 2 or more securities - credit and liquidity risks e.g., fixed income arbitrage, convertible bond arbitrage
opportunistic - top down multi-asset; e.g., global macro and managed futures
specialist - niche opps that require specilized skill or knowledge e.g., volatility involving options and reinsurance
multi-manager - multi-strategy or funds of funds
equity hedge funds
long/short equity - long undervalued companies; short overvalued - defined by manager stock-selection skill - performance during market crisis periods is important
dedicated short selling and short-biased - short-biased will balance with a modest index long exposure - stock selection -
equity market neutral - take opp positions in similar or related equitues with divergent valuations - stub trading - parent & sub - multi class trading - classes of shares in same co - security selection and market timing - higher levels of diversification and turnover ratios - high levels of leverage
event driven strategies
Merger arbitrage: buy the acquirer sell the target; equivalent to a short put and riskless bond
Distressed securities -
relative value strategies
fixed income arbitrage - long/short positions across a range of debt securities - require substantial leverage - carry trade to long a high yield security and short a lower yield security - yield curve trade to long/short at different points on the yield curve
convertible bond arbitrage - hedge other risks embedded in the convertible security (ir rate, credit, market) to access the cheap convertible option - buy undervalued convertible bond and short overvalued stock - liquidity risk
opportunistic strategies
Global macro strategies - wide range of asset classes - relative economic health and central bank policies of different countries - anticipatory
managed futures - using futures, options on futures, forwards and swaps - pattern recognition trigger that is momentum/trend based
specialist strategies
volatility trading - buy cheap volatility and sell expensive volatility -
reinsurance/life settlements - life insurance - low surrender value low ongoing premiums will die earlier
multi-manager strategies
FoF - diversification but double layer of fees lack of transparency
multi strategy - can reallocate capital more quickly; full transparency; general partner absorbs the netting risk - quite levered