Multiple linear Regression
1/63
There's no tags or description
Looks like no tags are added yet.
Name | Mastery | Learn | Test | Matching | Spaced |
|---|
No study sessions yet.
64 Terms
The Regression process
Check if dependant variable is continuous
Estimate the model
Analyse residuals
Check is the assumptions are verified
examine the goodness of fit model
Is the overall fit significant
Is the model the best
5 assumptions of multiple linear regression
Linearity
homoskedacity
Independance of errors
Normality of residuals
No collinearity
Scatterplot matrix
Helps to better understand the model
Scatter plot of residual against dependant variable
detect outliers
Scatter plot of residual against dependant variable
confirm outliers and look for broken assumptions
normal q-q plot
Compare the distribution of the residuals to a normal distribution
Partial regression coefficient
Coefficient that describes the effect of a one-unit change in the independent variable on the dependent variable, holding all other independent variables constant.
If a regression model is estimated using all five independent variables
any prediction of the dependent variable must also include all five variables
R²
Sum of square regression / Sum of square total
Evolution of R² When you add variables
R² can not decrease
Problems with R²
R² Do not say wether coefficient are statistically significant
R² do not say anything about biases
R² do not say if the model is a good fit
Overfitting
model is too complex, meaning there may be too many independent variables relative to the number of observations in the sample
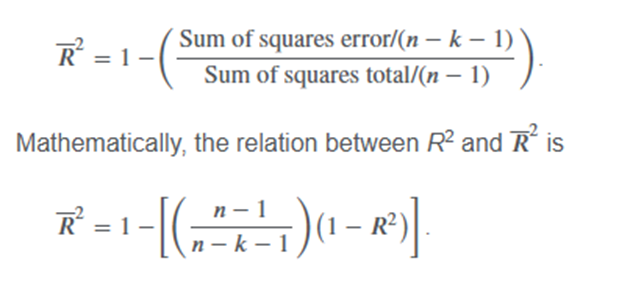
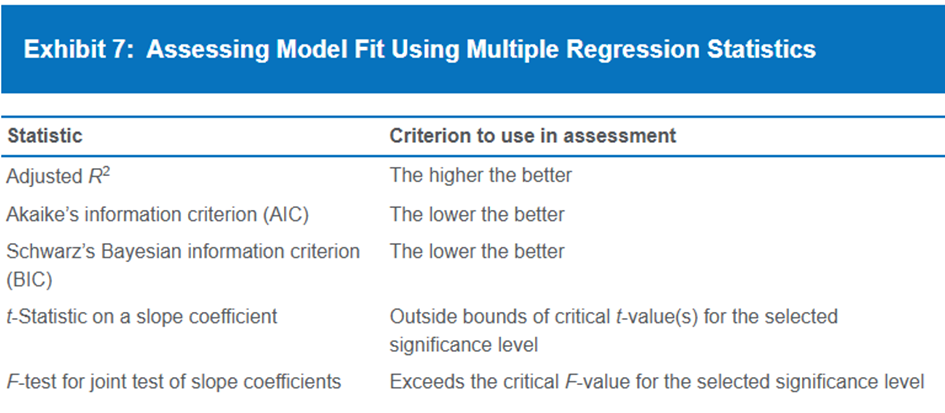
Adjusted R²
What does it mean if adjusted R² increase or decrease
new coefficient t stat is superior / inferior to 1
Who is bigger R² or adjusted R²
R²
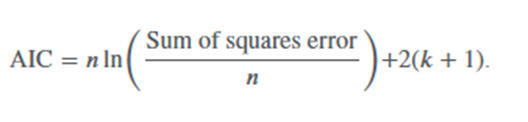
AIC
BIC
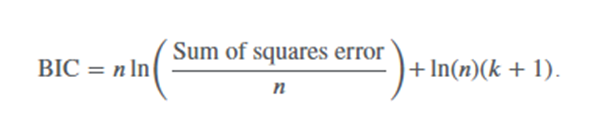
BIC impose a greater penalty on more complex model
When do you use AIC or BIC
AIC is for prediction
BIC is for testing fit
Nested model
Models in which one regression model has a subset of the independent variables of another regression model.
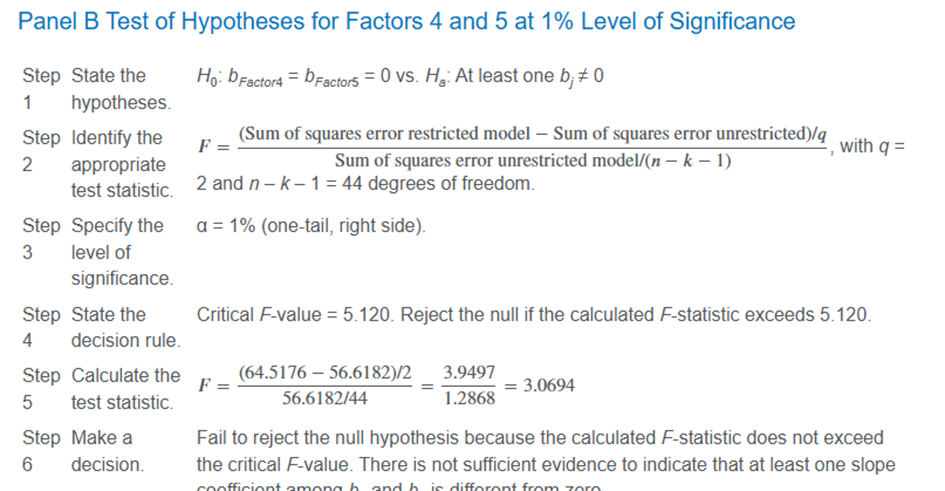
F stat for restricted model
Summary Model Fit
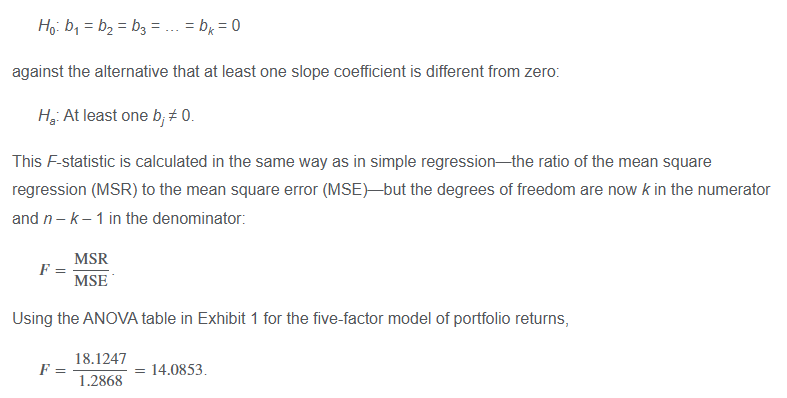
general linear F test
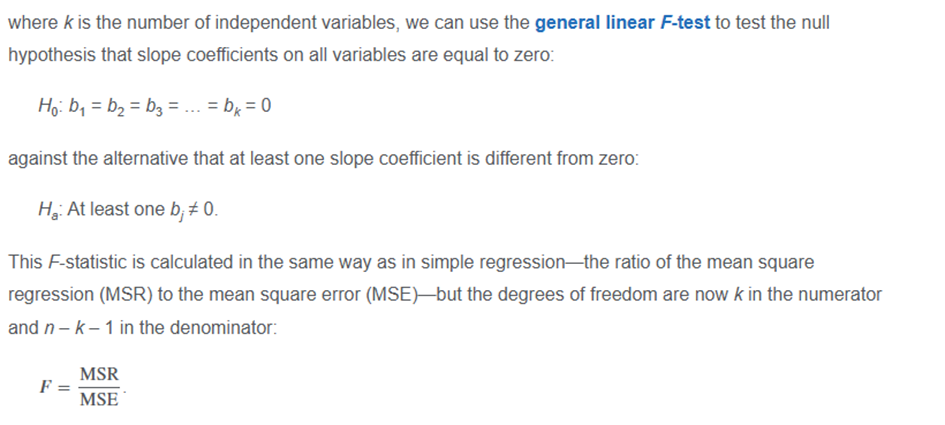
R2 and adjusted R2 are not generally suitable for testing the significance of the model’s fit; for this, we explore the ANOVA further, calculating the F-statistic and other goodness-of-fit metrics.
ok
Principles of model specification
Grounded in economic reasoning
Parsimonious
Perform on other samples
Model should adapt to non linearity
Model should satisfy regression assumptions
Failures in regressions
Omitted variables
Innapropriate form of variables
Inaproprate variable scaling
Innapropriate data pooling
Heteroskedacity
Variance of residuals differs across observation
Interpretation of Breusch Pagan test
the null hypothesis is that there is not heteroskedacity. This is a one tail risght side test.
What model should you use if there is heteroskedacity
Robust standards errors
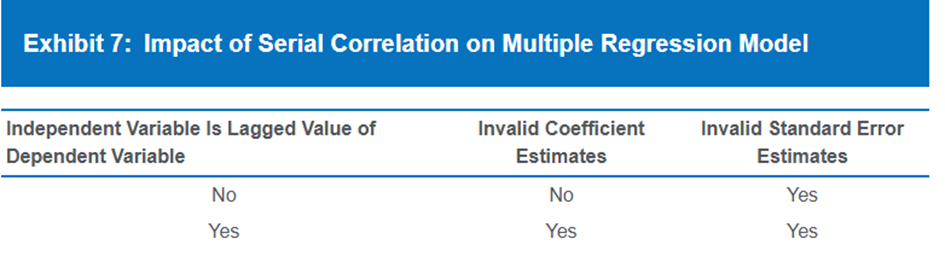
Serial Correlation
Often found in time series. Residual are correlated
Impact of Serial Correlation on Multiple regression model
First order serial correlation
The correlation is about the adjacent residuals
VIF interpretation
VIF > 5 so investigate
VIF > 10 serious multicolinearity
How you correct multicollinearity
Exclude variables
Using a different proxy
Increasing the sample size
high leverage point
An observation of an independent variable that has an extreme value and is potentially influential.
An outlier
An observation that has an extreme value of the dependent variable and is potentially influential.
How to identify ouliers and high leverage points
Scatterplot
Leverage
A value between 0 & 1 to identify how far is the high leverage point (1 being the highest)
How to detect high leverage point
Higher than 3 x (K+1/N)
Method to identify outliers
Studentised residuals
degree of freedom for studentised residuals
n-k-2
Conclusion of studentised resiudals
if studentised residuals are higher than Critical value then it is an outlier
Number of dummy variable for N categories
N-1
Qualitative dependant Variables
logistic regression
The log of the probability of an occurrence of an event or characteristic divided by the probability of the event or characteristic not occurring.
Model used to estimate coefficient in logisitic regression
Maximum likelyhood ratio
error distribution for logistic regression
the distribution’s shape is similar to the normal distribution but with fatter tails.
how to assess logistic model fit
Likelyhood ratio test
LR = −2 × (Log-likelihood restricted model − Log-likelihood unrestricted model)
Interpratting log likelyhood test
log-likelihood metric is always negative, so higher values (closer to 0) indicate a better-fitting model.
General linear F test