Contemporary Urban Environments
 Call Kai
 Learn
Learn Practice Test
 Spaced Repetition
 Match
Match Flashcards
1/15

There's no tags or description
Looks like no tags are added yet.
Name | Mastery | Learn | Test | Matching | Spaced | Call with Kai | Chat |
|---|

16 Terms
Urban areas
Areas characterised by extensive infrastructure & majority not working in agriculture
Urbanisation
The process by which an increasing proportion of a country’s population lives in towns and cities
Global patterns in urbanisation
% living in urban areas: 30% (1950) > 59% (present) > 66% (2050)
90% concentrated in Africa/Asia
Most urbanised: North America
China/India/Nigeria: 37% of projected growth of world urban population
Consequences of urbanisation/urban growth
Urban sprawl
Shortage of (affordable) housing in LICs
Lack of urban services e.g. waste disposal
Un(der)employment
Transport issues
Suburbanisation
Movement of people from inner to outer urban areas, relies on transport
Urban Resurgence
The movement of people and investment back into urban areas that previously experienced decline
Montreal: Urban Resurgence
Ubisoft: computer-animation firm with 2,700 employees
Resurgence > PME but gentrification
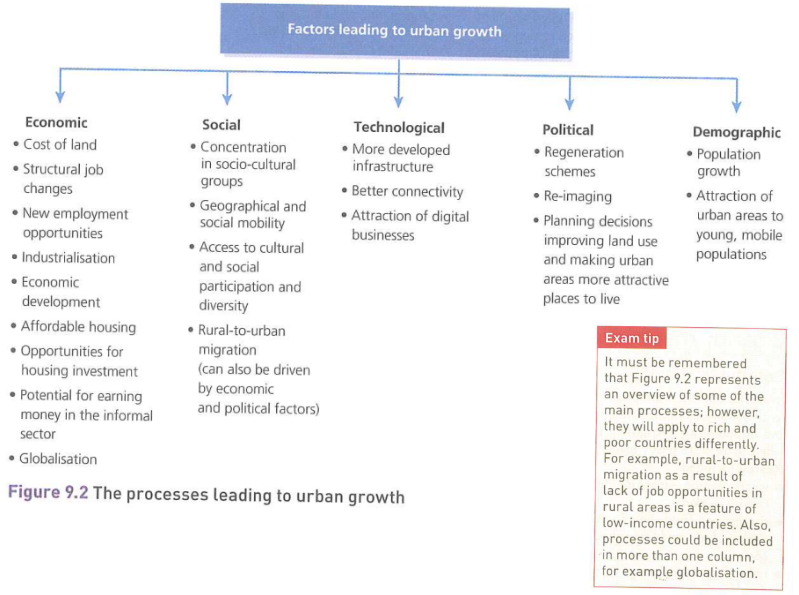
Factors leading to urban growth (incl. Bangalore vs London)
Economic:
Tech. industry (Texas Instruments), Indian “Silicon Valley”
Informal Clothes manufacturing
Cost of land highest in CBD/Chelsea (as close to work/transport/shops)
De-industrialisation > better air quality/less traffic congestion
Social:
Economic opportunities > rural-urban migration
Cost of land cheaper elsewhere & public transport/motorways > outward migration
Technological:
95% use mobiles
Tanzania mobile banking > UK (as cheaper than building physical banks)
Political:
“Hi-tech city”, business parks
Demographic:
<18s: 30% of pop.
<18s: 23% of pop.
De-industrialisation (incl. causes of decline, trends, cities affected most)
Loss of jobs in manufacturing sector
Mechanisation cheaper, international competition, lower demand for traditional products as new materials/technologies developed e.g. coal/oil being replaced by natural gas
60% decrease in UK jobs e.g. Sheffield, Manchester, Liverpool (affected most due to over-specialisation)
Decentralisation
Movement of people away from industrialised centre
Why service economy rises
Financial services
Increased tech. sophistication
Wealthier incomes
Urban Policy: Thatcher
Right to Buy: 33%-70% home discount for council tenants (who rent council-provided homes)
Urban Development Corporation
Using government money to attract FDI e.g. London Docklands (which was bombed)
Successes:
80k jobs
£1 of public money > £3 in private investment (£8.7 billion)
200,000 trees
Failures:
Locals didn’t benefit
City Challenge Partnership
Works with local community/private companies to improve inner city e.g. Hulme City challenge
Successes:
Cities compete for govt regen grant > higher standards
40k homes improved, 53k jobs, 2k hectares of derelict land restored
Failures:
Resources thinly spread
Better plan exceeds greater necessity
Inefficiency: spending on bids rather than regen
New Deal for Communities
Designed to transform 39 (most)-deprived neighbourhoods in England e.g. Devonport
Successes:
32/36 areas: core indicators improvement e.g. crime
Lower inequality between local/national authority
Failures:
Changing place over people > education/worklessness unchanged
Factors influencing land-use patterns, economic inequality, cultural diversity (LA/Mumbai)
LA:
Water/coast, gold, cars > suburbanisation
Cheaper in subur
Mumbai:
Growing middle class > Colaba Causeway Corner (shopping centre), cheap/skilled labour > tech