Natural Hazards Exam 1
 Call Kai
 Learn
Learn Practice Test
 Spaced Repetition
 Match
Match Flashcards
 Knowt Play
1/80

There's no tags or description
Looks like no tags are added yet.
Name | Mastery | Learn | Test | Matching | Spaced | Call with Kai | Chat |
|---|
No analytics yet
Send a link to your students to track their progress
81 Terms
Define hazards
Something that may cause the loss of human life, property damage, social and economic disruption, or environmental damage (threat to humans).
Define disaster
An event that causes huge disruption to human communities and compromises their ability to recover and recovery resources.
Define risk
The probability of the occurrence of a hazardous event that causes negative impacts
High physical exposure + high vulnerability = high risk
If either is low, risk drops.
Threats of natural hazards/disasters:
To people’s health
(death, injury, disease, mental stress)To goods
(property damage, economic loss)To the environment
(loss of biodiversity, pollution, loss of ecosystem services, loss of amenities)
Scales of natural hazards:
Local
Regional
National
Global
What are natural hazards?
Hazards that originate in nature and impact humans
What are technological hazards?
Hazards caused predominately by humans / human inventions
What are socionatural hazards?
Natural hazards that are made worse by human activity
(quasi - almost natural or socionatural hazards)
What are Na-tech (Natural-Technological) socionatural hazards?
Technological hazards that are triggered by natural hazards
Examples of natural hazards:
Volcanic
Seismic (Earthquakes)
Tornadoes
Wildfires
Flooding
Hurricanes
Drought
Heavy rain / snow
(Many natural hazards can be considered socionatural hazards)
Examples of socionatural hazards:
Landslides
Flooding
Droughts
Wildfires
Diseases
Examples of technological hazards:
Air pollution
Oil spills
Human-caused wildfires
Water pollution
Powerplant failures
Dam Failures
Examples of Na-tech socionatural hazards:
Powerplant failures after or during extreme weather
Dam failures after or during hurricanes
Water pollution after rain
Bridge failure because of earthquake / soil liquefaction
Define physical exposure:
The degree to which people or property are located in a hazard-prone zone
Example: A house next to a river has a high physical exposure to flooding, which a house on a hill nearby does not.
Define human vulnerability:
How well a person can handle, survive, or recover from a hazard. Depends on things like income, health, and support systems.
Physical exposure Vs human vulnerability
Physical exposure: Whether people or property are located in a hazard prone area
Human vulnerability: A person / community’s ability to recover from a hazard’s impacts
Define paradigms:
Paradigms are models and frameworks used to guide on how to do research or create policies to manage problems
(Paradigms change and evolve as limits as understood or realized)
Engineering paradigm:
The idea that hazards can be controlled and contained through technology, engineering, and military operations, like dams and flood walls.
Behavior paradigm:
The idea that land-use planning is key, and that government, insurance companies, and real-estate markets should guide society on where to live safely
Development paradigm:
The idea that vulnerability to hazards is caused by economic development, where lower income communities aren’t able to prepare for or recover from disasters
Complexity paradigm:
Combines social and natural sciences evenly to understand the different ways people experience hazards, shaped by ideas about sustainability
ideas about sustainability: Using just the right resources without creating problems for the future or other communities
Hurricanes in Central Marica: Mitch (1998)
Category 5 hurricane
Hit Central America, mainly Honduras
Caused Mudslides and flash floods
11,000 people killed
$5 billion in damages
Hurricanes in Central America: Felix (2007)
Category 5 hurricane
Hit Nicaragua and Honduras
Moved faster than Mitch, so less rainfall but very strong winds
133 people killed
Complexity perspective: Mitch vs Felix
Mitch moved slowly, dropping massive rainfall that caused deadly mudslides and floods.
Felix moved fast, so less rain, but its strong winds destroyed homes
Bam Earthquake (Iran 2003)
Magnitude 6.6 earthquake in Southern Iran
Population of 128,000
Around 26,000 - 43,000 killed
70% of buildings collapsed
Bam earthquake: Physical reasons for severity
Rupture happened on a lesser known fault
Shaking lasted 15 seconds
Shallow hypocenter sent seismic energy directly into the city
Bam earthquake: Social reasons for severity (buildings)
Old buildings made of adobe (clay and straw) which collapses easily
Newer buildings didn’t meet seismic codes (too much sand in cement, untreated termite damage on buildings)
Likely under-enforced because Bam had no recent history of earthquakes, despite being in an earthquake prone area
Bam earthquake: Social reasons for severity (emergency response)
Most emergency facilities were destroyed, half of emergency personnel killed
Trapped survivors died of hypothermia overnight
Conflicts between Iranian agencies and no clear protocol for international aid delayed help
Swiss cheese model
Disasters happen when weaknesses (holes) in different layers of protection line up.
Each layer = a safeguard (building codes, emergency responses, etc.)
In Bam: weak buildings + poor emergency responses = more severe disaster
Main hazard impacts:
Deaths
Economic loss
damage to property and crops
Reporting disaster: Reinsurance companies and their biases
Purpose: Insurance and catastrophe risk assessment
Tracks events relevant to insurance losses, including many smaller events
Use detailed loss modeling, insurance claims, industry estimates
Insurance losses are their major focus and are well recorded
Uninsured losses often estimated using models, less reliable
Reporting disaster: CRED / ED-DAT
EM-DAT = Emergency Events Database, maintained by CRED
Purpose: humanitarian / disaster risk monitoring (not insurance focused)
Preferred database of UN agencies
Covers natural and technological disasters
Counts as “significant disaster” if: 10+ deaths, 100+ people affected, state of emergency declared, OR international aid requested
Reporting disaster: The media and their biases
Tends to focus on dramatic, high death toll, or visually striking disasters
Can underreport smaller or “quieter” disasters (slow-onset, less visual)
Coverage often shaped by proximity to wealthy western counties
Can skew public perception of which hazards are most frequent or dangerous
Issues with databases: Inconsistencies in standards and purpose of organization/company
No standardized methodology across organizations for counting deaths / damages
Each organization’s purpose shapes what it counts (humanitarian Vs insurance Vs media attention)
Disagreement on what counts as a “disaster” or where it starts/ends
Secondary hazards (landslides after earthquakes) may or may not be counted as part of the same event
Results: same disasters can have different reported numbers depending on the source
Time trends: Number of disasters 📈
Overall number of recorded disasters (natural + technological) has increased over time (due to climate change)
Technology has also improved, which has inflated the number due to reporting being more accurate
Technological events are included in the overall disaster count, not tracked separately
Time trends: Total deaths
Total death trends contradicts the idea that fewer people are dying from disasters
Global pattern of declining deaths (excluding COVID) is inconsistent in more recent data
Likely due to new challenges in hazard risk management
Time trends: Death rate (deaths / number of disasters)
Death rate = death / number of disasters
Dearth rate is lower in 2000 - 2009 compared to 1980-1999
Deaths per events are likely going down globally, while disasters are happening more frequently due to climate change
Spatial patterns: HDI (Human Development Index) and Disaster Risk Management
HDI: scale 0-1, measures health, education, and standard of living
Disaster Risk Index: scale 0-8, measures risk of disaster related death
Spatial patterns: Risk Vs Development
Low/Medium Human Developed countries (LHD/MHD): higher deaths from disasters
Medium Human Developed countries (MHD): higher disaster affected people
Medium/High Human Developed countries (MHD/HHD): higher economic loss
Vulnerability: Indicators
Income, access to food, age, gender
Race/ethnicity, health, sexual orientation
Occupation, religion, education, political system
homelessness, disability
Vulnerability: Gender
More men die from occupational hazards (construction accidents, mining collapses, black lung disease)
More women may die during heatwaves as they tend to live longer, with elderly isolated women being more vulnerable
Vulnerability: Burundi’s (food crisis example)
Floods, landslides, and droughts destroyed farmland, causing a food crisis that affected 1.2 million people
Refugees from DR Congo increased demand for aid
2024 funding cuts let to reduced food rations (aid only reached 50% of recommended daily calories)
Vulnerability: Cuba (car example)
Us embargo/sanctions make it hard to import new cars or parts
Older cars stay in use with missing/replacement parts, making them more hazardous
Define resilience
The ability of a system, community, or society to resist, absorb, accommodate, and recover from a hazard’s effects in a timely way, including restoring basic structures and functions
Resilience: Colorado example
The City of Boulder Colorado restricts new development or repairs in flash flood areas
Resilience: North Caroline example
Statewide law restricts development on mountain ridges at 3,000+ feet
Redevelopment focus:
- public education on landslide risks
- managing vegetation
- drainage / slope grading
Define earthquakes
Caused by sudden rock movement along a fault (a zone of weakness in rock)
(When slow building stress exceeds the strength of the rock along the fault, the rock breaks creating fractures. The original subsurface area of rupture is called the hypocenter or focus. Depth: 0.700 km)
Earthquake: Hypocenter / Focus
The original underground area where the rupture starts
Earthquake: Epicenter
The point on the surface directly above the hypocenter
Earthquakes: factors linked to impact / shaking
Depth of hypocenter: shallower = stronger shaking
Distance from epicenter: closer = stronger shaking
Direction of rapture: can make shaking stronger in some directions
Rock / soil conditions: soft soil and loose rock fragments amplify shaking
Building type: older + poorly built = more damage
Earthquakes: foreshocks and aftershocks
Foreshocks: a quake that happens before the main shock
Aftershock: A quake that happens after the main shock
Earthquakes: Intensity
Describes how strong the shaking feels as a specific location. One earthquake has many different intensity values depending on where you are
Earthquakes: Magnitude (moment scale)
Moment magnitude (MW) is today’s standard, replacing Richter’s local scale.
Based on:
Area of the fault that broke
Displacement
Average rigidity of rock
One rock has only one magnitude value
Earthquakes: Intensity vs Magnitude
Magnitude: one single value per earthquake, measures total energy released
Intensity: many values per earthquake, measures shaking/effects at different locations
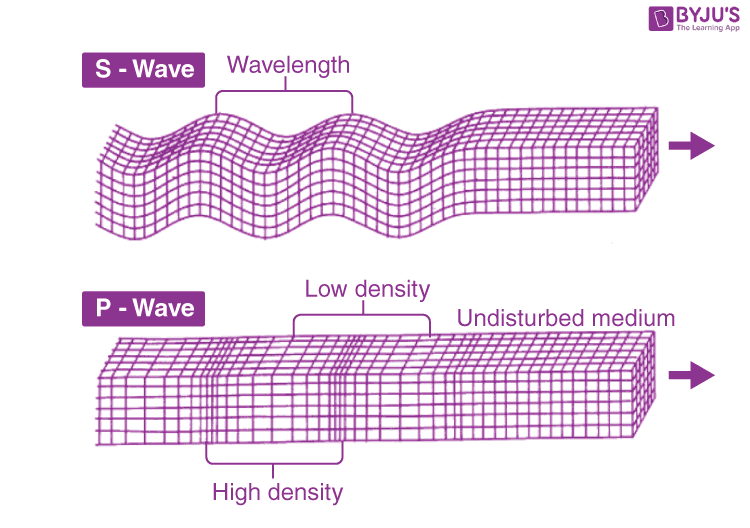
Earthquake waves: P waves
Also called primary / pressure waves
Body waves (travels first, fastest)
Compression motion: travels through solids AND liquids/gases
Speed: 8 km
Shakes houses mostly vertical, sometimes not felt

Earthquake waves: S waves
Also called secondary / shear waves
Body wave ( second to arrive, 60% slower than P waves)
Shear motion: only travels through solids
Speed: 4-5 km
Shakes house complex, mostly horizontal
Causes more damage than P waves
Earthquake waves: Love waves
Surface wave
Moves side to side (like shaking a rug horizontally)
Forms when body waves reach the surface
Earthquake waves: Rayleigh waves
Surface waves
Moves up and down like water waves
Complex motion: Both vertical and horizontal
Earthquake waves: Body waves
Travels through the inside of the earth
Arrives first (P waves, then S waves)
Faster than surface waves
Earthquake waves: Surface waves
Travels along the Earth’s surface only
Arrives later than body waves
Slower but lasts longer and cause more damage
Can shake an area for 30+ seconds
Earthquake waves: Early warning systems
Sensors detect the fast P-wave first, giving seconds to minutes of warning before the more damaging S-wave hits. Used to shut off gas lines, stop elevators, and trigger alarms
Earthquake waves: foundation anchorage
Steel anchor bolts and mental framing ties lock the house to its foundation so S-waves dont slide it off it’s base
Earthquake waves: Shear walls
Plywood or diagonal bracing panels absorb the sideways twisting force caused by S-waves
Earthquake waves: Flexible material
Wood and steel framing bend under stress instead of cracking, unlike brick or concrete
Earthquake waves: internal strapping
Heavy furniture and appliances are bolted to wall studs so they dont tip over during shaking
Resilience: Financial capital
access to money and insurance
Resilience: Natural capital
Access to useful natural resources: Land, water, minerals, forests
Wetlands, biodiversity, stable soils
Resilience: Social capital
Family, friends, neighbors, trust, mutual help
Community centers, and similar
Resilience: Human capital
Education, skills, good health
Resilience: Physical capital
Infrastructure, roads, shelter, transportation, sanitation
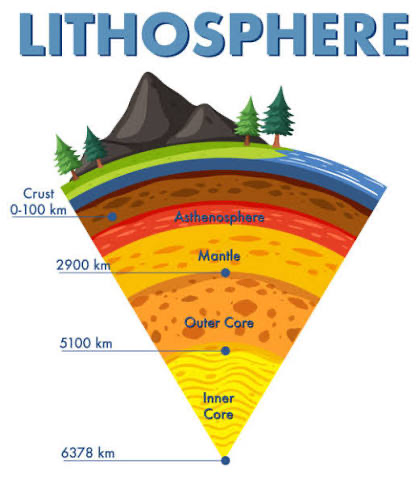
Define Lithosphere
The rigid outer layer of the Earth, broken into plates that move on top of the asthenosphere
Convergent boundaries
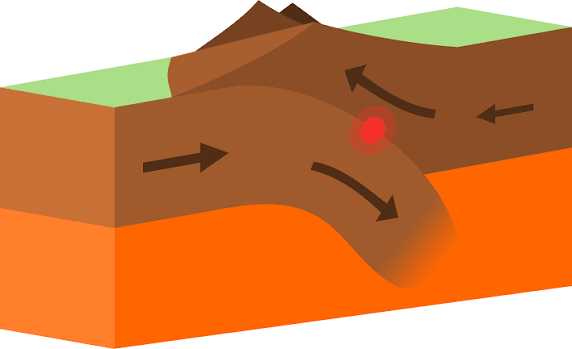
Often cause earthquakes because plates collide and become locked, building stress. Subduction zones can produce very large earthquakes
Transform boundaries
Commonly cause earthquakes as plates slide past each other and friction causes them to stick and then slip. May not be as strong as quakes linked to convergent boundaries

Divergent boundaries
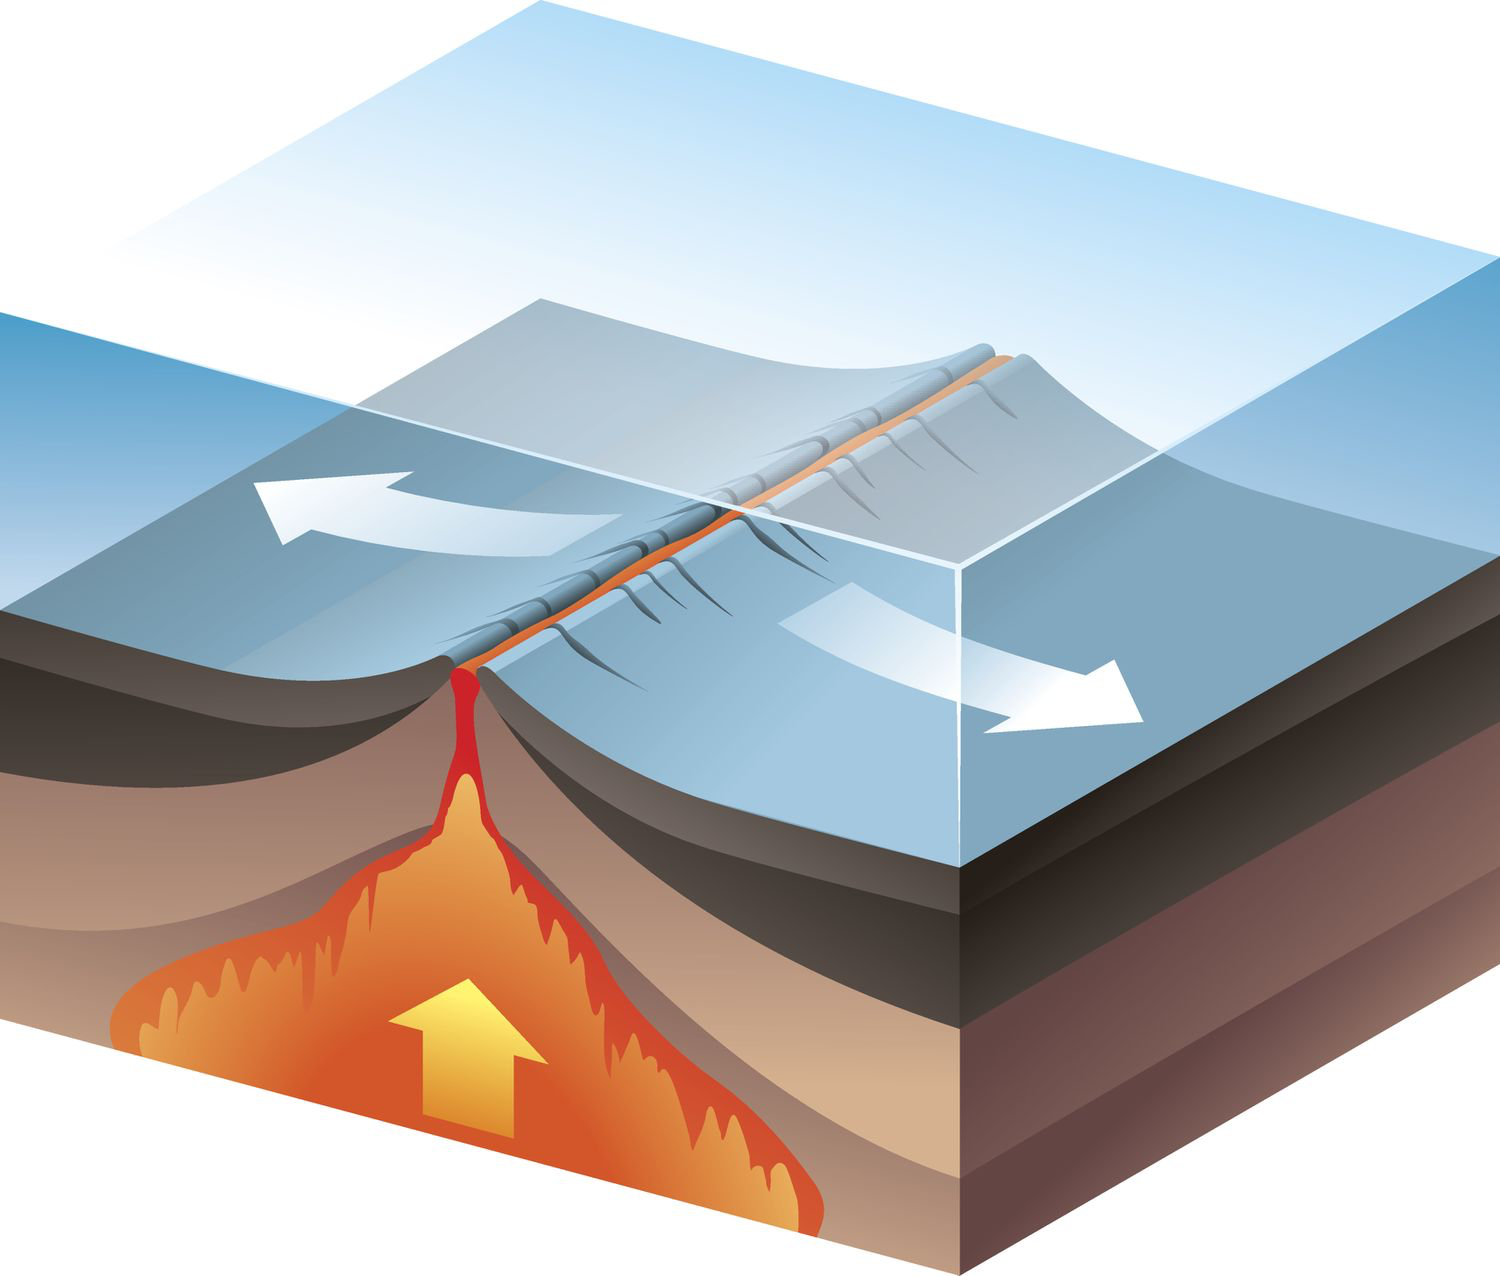
Can cause earthquakes as plates pull apart and magma rises, but these earthquakes are smaller
Define fault
A fracture in the Earth’s crust where blocks of rock have moved past each other
Define fault plane
The underground surface along which the fault’s movement happens

Define fault line
Where the fault plane meets the Earth’s surface
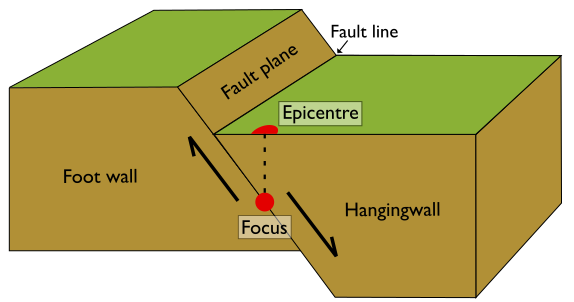
Normal fault
Vertical / oblique movement: the footwall stays down while the hanging wall moves up

Reverse fault
Vertical oblique movement: the footwall stays down while the hanging wall moves up

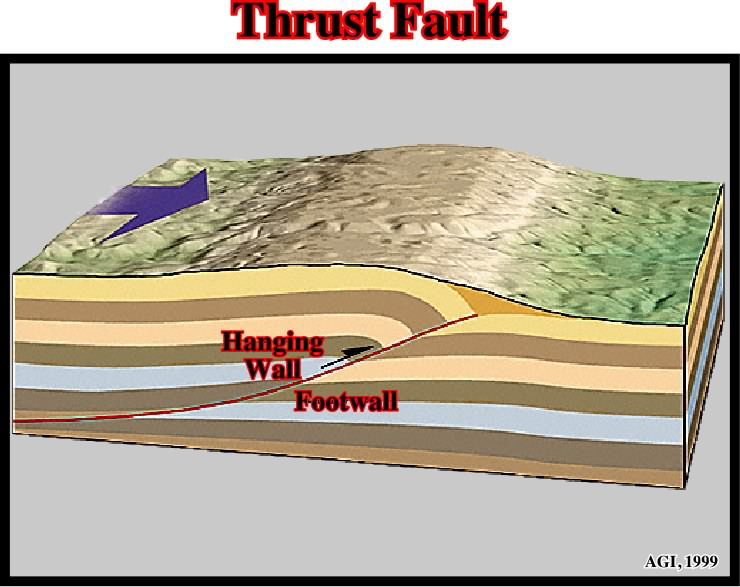
Thrust fault
Oblique movement, similar to a reverse fault but with stronger horizontal displacement
Strike-slip fault
Horizontal movement: the two blocks of rocks slide sideways past each other
