Light: Quantum Model
1/17
There's no tags or description
Looks like no tags are added yet.
Name | Mastery | Learn | Test | Matching | Spaced | Call with Kai |
|---|
No analytics yet
Send a link to your students to track their progress
18 Terms
Blackbody Radiation and Blackbodies
the radiation emitted by a black body at a constant temperature
Blackbody - idealised object that absorbs all electromagnetic radiation it encounters
Perfect absorber of EM radiation ∴ any EM radiation it emits must be made by itself
Any radiation emitted comes from the particles on the surface of the BB
Any radiation from inside the object is absorbed and re-emitted
The closest thing we have in the universe are stars
Thermal radiation – electromagnetic radiation emitted by an object due to its temperature
Colour it glows depends on
TEMPERATURE: Temp increases = wavelength shortens (more kinetic energy), brightness increases (E∝A^2)
Low temperature thermal radiation is mostly in infrared (not observable = black)
As temperature increases, object glows more red → yellow → white → blue (less short wavelengths)
The properties of the object: its elemental composition
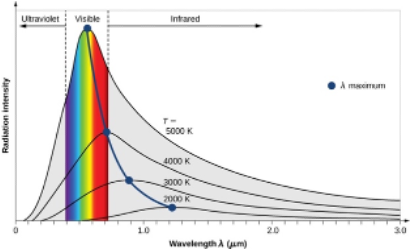
Nature of Blackbody radiation
Typical blackbody spectrum: (power/intensity/energy vs wavelength)
Area under the line = total energy produced by star
Intensity is zero at short wavelengths
As temperature increases:
The graph shape shifts to the left → more shorter wavelengths
λ_max increases (higher peak)
since P_total ∝〖Temp〗^4
Higher intensity/power for all wavelengths
Follows Wein’s Law: λ_max∝1/T
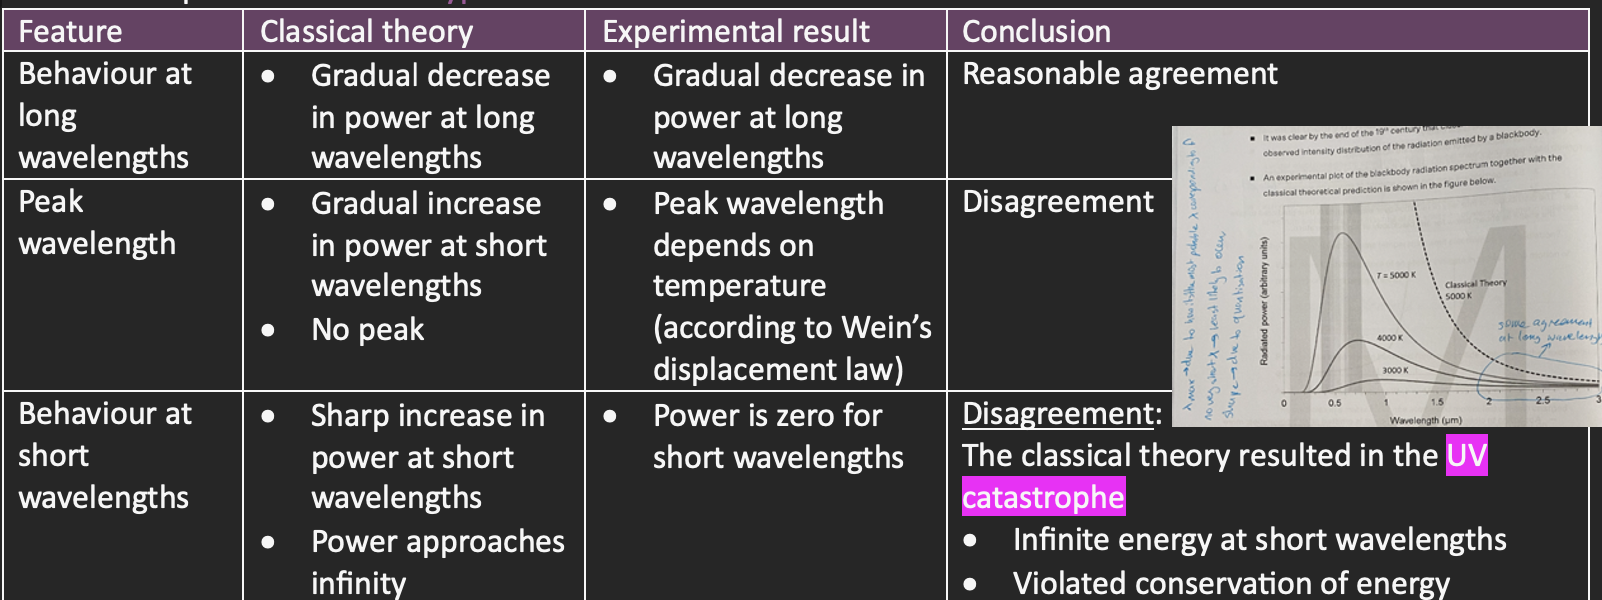
Classical Explanation of BB radiation vs Experimental results
Classical theory of thermal radiation
Developed during the 19th century using Wein’s law and Maxwell’s theory of light
An object at some temperature would emit EM radiation
Having temperature = has kinetic energy = particles are oscillating in the object
Particles would collide exchanging energy
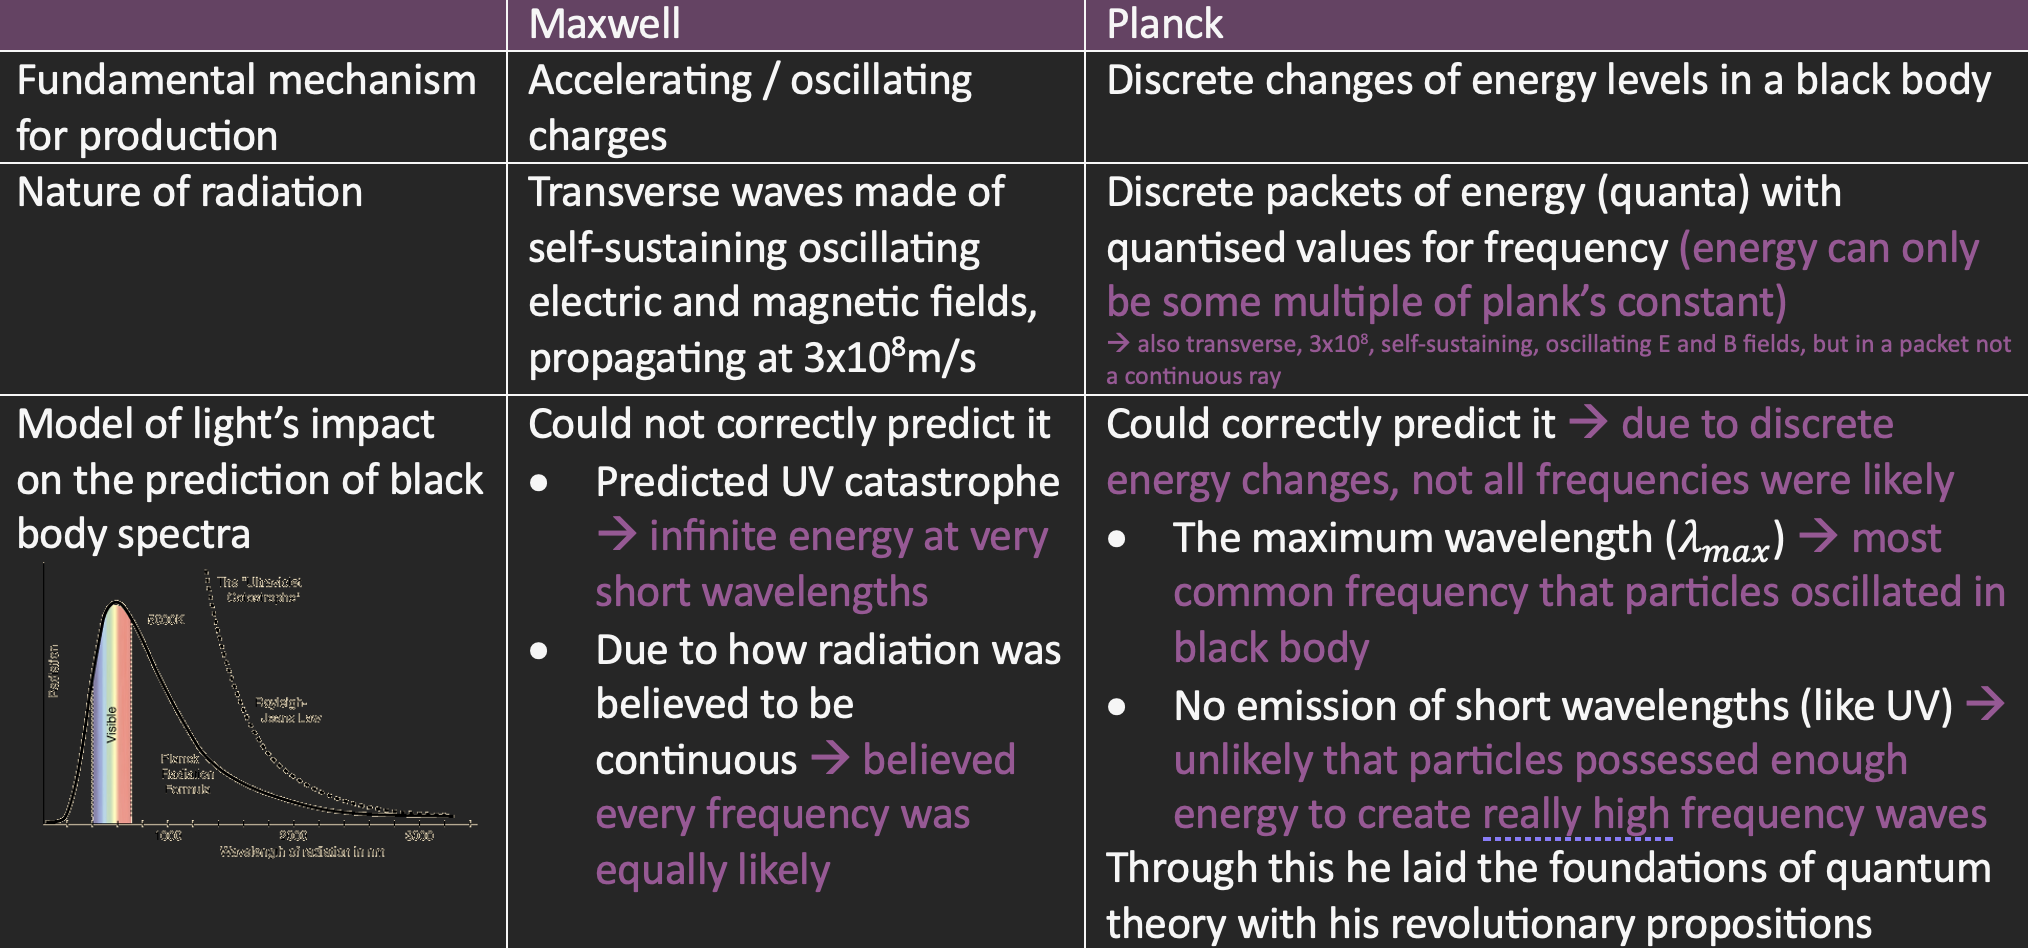
Particles are accelerating = produces EM waves → according to Maxwell’s model of light
Thermal radiation originates from accelerating charged particles
Classical prediction of the blackbody spectrum
All frequencies of oscillation are equally likely
More power is emitted at higher frequencies since there are more high frequencies (shorter wavelength)
Each particle emits radiation at the frequency at which it oscillates
Each particle will emit the same amount of energy on average (amplitude)
High energy particles will cancel out the low energy ones
Equal power is emitted at all frequencies
This resulted in the UV catastrophe, as at short wavelengths, an infinite amount of energy was being emitted
→ Could not explain experimental results, so a new theory regarding the nature of light was required
Classical theory vs experimental result table comparison
Planck’s Model of EM Radiation Emitted by Black Bodies (Quantum Era)
Assumptions made by planck
All frequencies were not equally likely → maximum wavelength was the most common frequency
Each particle will not emit the same amount of energy on average → each particle has different energy levels due to its elemental composition, and when moving to different levels, it will need to release or absorb a specific amount of energy (E=hf)
Intensity of radiation would increase by fixed amounts depending on the frequency: f = ΔE/h
These fixed amounts are thought of quanta (discrete packets of energy)
Hypothesised that
All accelerating charges can only oscillate at specific frequencies, and thus have discrete energies
EM radiation was released in quanta (before called photons) with energy E=hf, not waves
At each temperature, there is some frequency of oscillation that is most likely for the charges
Since on average, more charges are oscillating at this frequency, it will be more emitted instantly
Higher frequencies require individual charges to have lots of energy → unlikely for these charges to poses enough energy to emit them = no emission of very short wavelengths
Temp of BB increases = Kinetic energy of charges increases = They move faster, collide more frequency =Emit more quanta of EM radiation per second = brightness/power increases = More quanta are at higher frequencies = shift towards shorter wavelengths
Plank’s Contributions
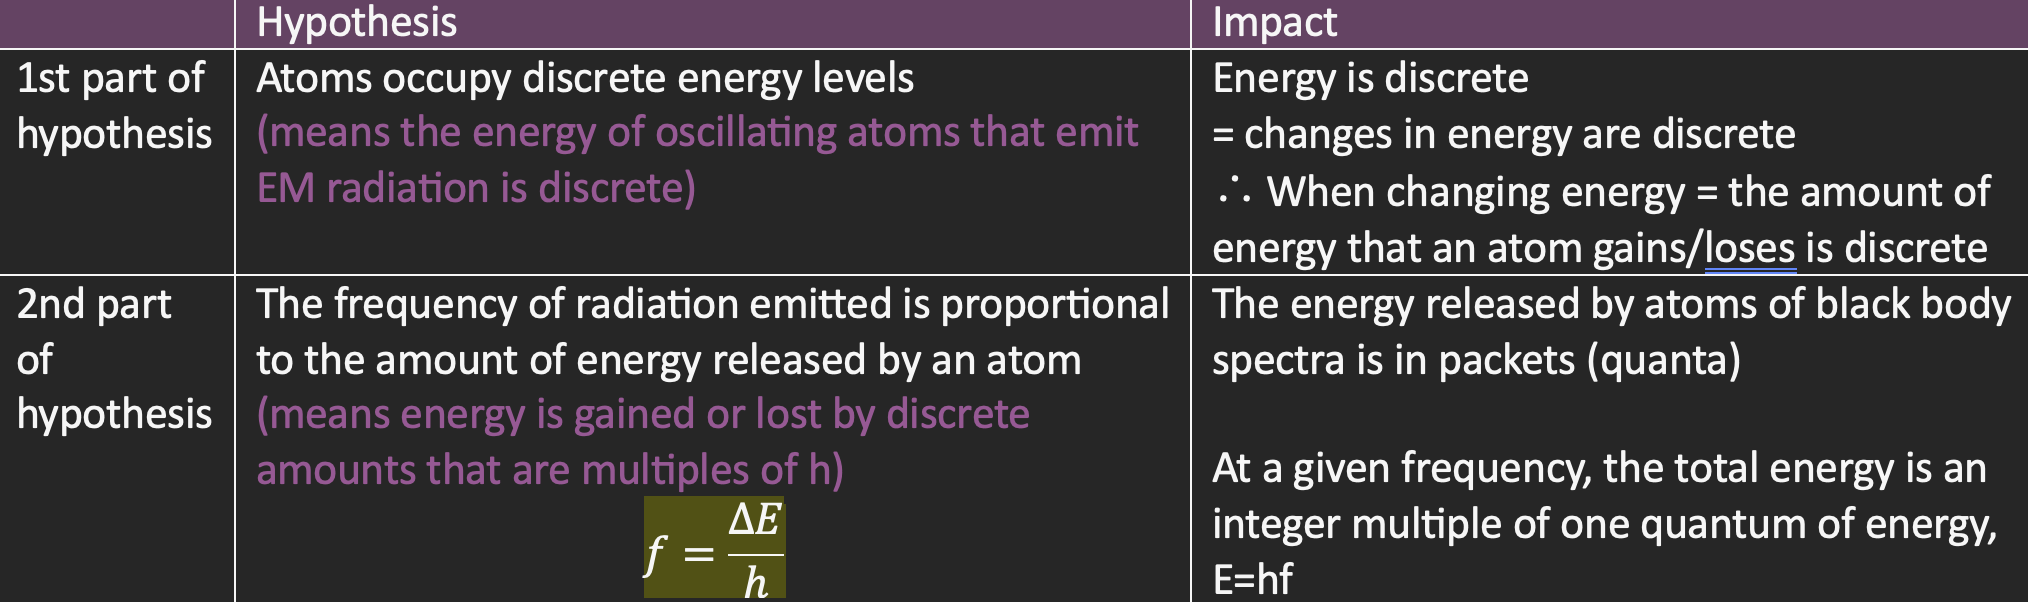
atoms occupy discrete energy levels → energy is released in quanta → frequencies are discrete → total energy released is integer multiples of e=hf
Maxwell’s vs Planck’s view of EM radiation
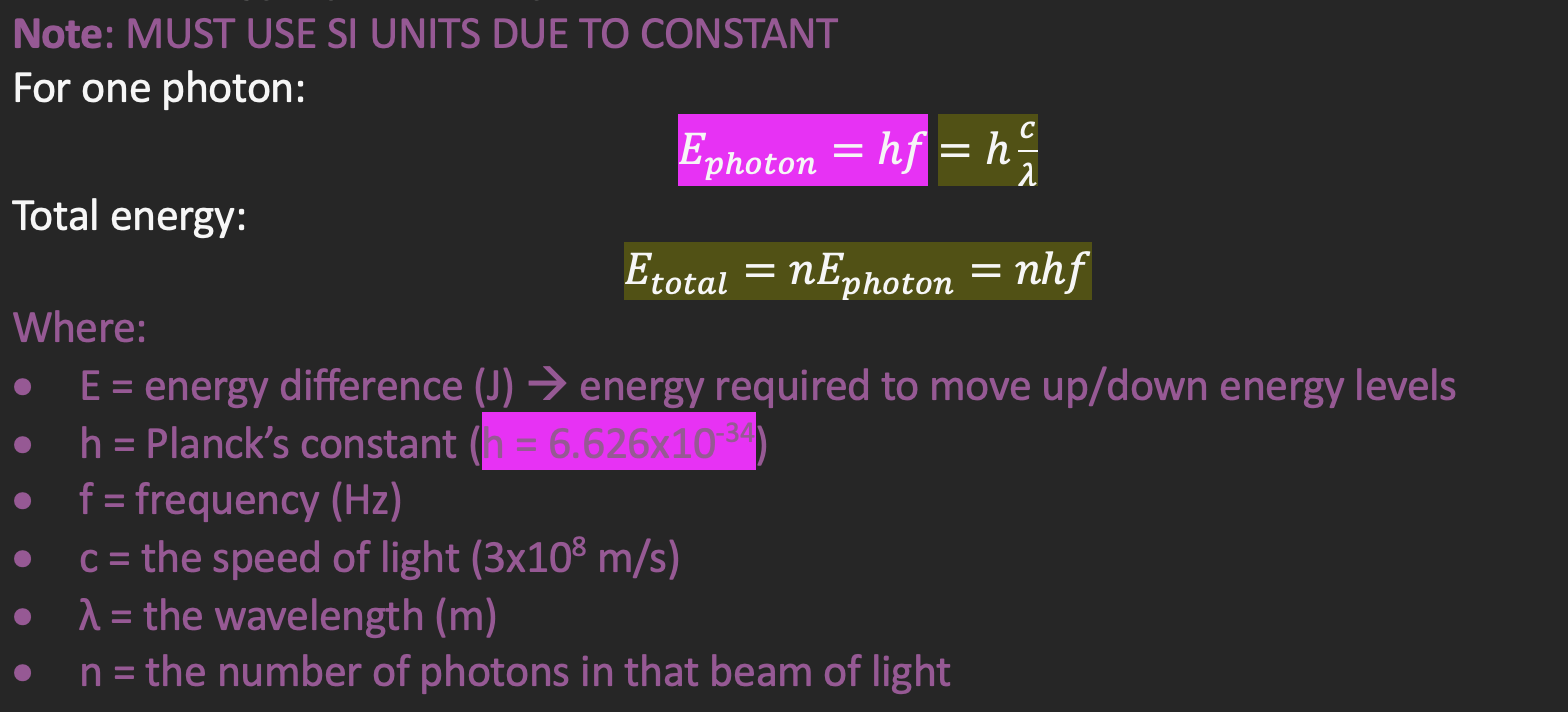
Plank’s energy equation for photons
Energy can be measured in eV
Electron volt (eV) – the energy (ΔE) gained by a particle moving through a potential difference, which is equal to the charge (e) times the potential difference (V
Uses equation W=qV
A unit of energy: 1eV = 1.602x10⁻¹⁹J
J → (÷ 1.602x10⁻¹⁹) → eV (going to a bigger number)
eV → (x 1.602x10⁻¹⁹) → J (going to a smaller number)
Wein’s Law
relates temperature of a blackbody with its peak wavelength
λmax=b/T
Where
λ_max = the peak wavelength (m)
b = Wein’s displacement constant (b = 2.898x10⁻³)
T = temperature (K or Kelvin) → MUST BE IN KELVIN (SI UNITS) DUE TO CONSTANT
Kelvin = Celsius + 273
0K = -273°C
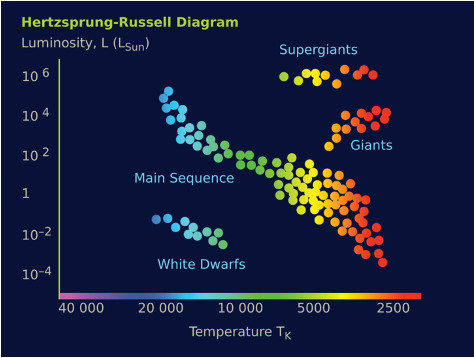
Hertzsprung-Russell diagram
Impact of peak wavelength
Red stars are cooler than blue stars
Impact of size (radius)
Larger stars are brighter than smaller stars (red supergiants are more luminous than red stars on the main sequence)
For main sequence stars where most stars are located on the graph
Hotter temperature (bluer) = more luminous
Impact of mass (no. of charges inside)
Larger mass = more gravitational force = higher pressure in core = more nuclear fusion = hotter = shorter life span = more luminous (for main sequence)
Smaller mass = less fusion = cooler = less luminous (for main sequence)
Over a star’s life cycle, it can change where it lies on the graph
→ Note: its mass doesn’t change on a broader level (atomically, it does since E=mc² but its density and chemical composition does
Einstein’s Photon Theory of Light
Einstein extended Planck’s concept of quantisation of electromagnetic radiation in order to explain the photoelectric effect
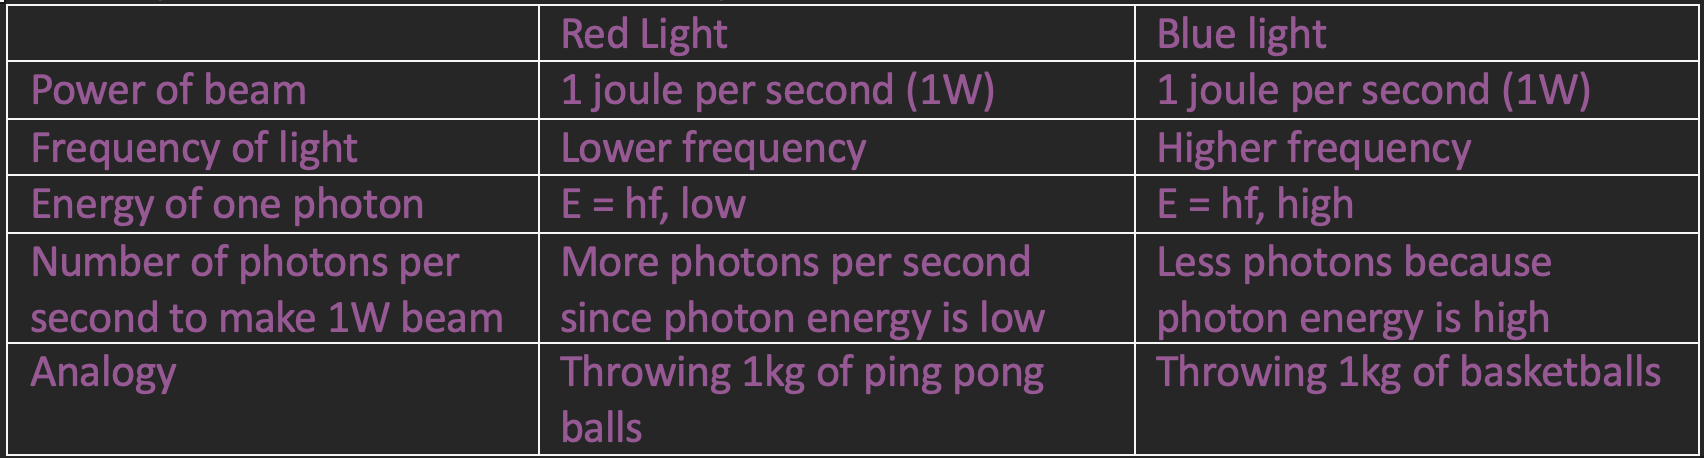
Frequency is related to the amount of each energy a photon carries
Intensity is related to the number of photons per second
He postulated:
Light (any EM radiation) is a stream of massless, fundamental particles called photons
Each photon contains the energy E=hf, as determined by Planck
Energy of the beam of light is localised to each photon, not spread across the wavefront of the light beam
There is always a one-to-one interaction between photons and electron → one photon is absorbed/released by one electron at a time
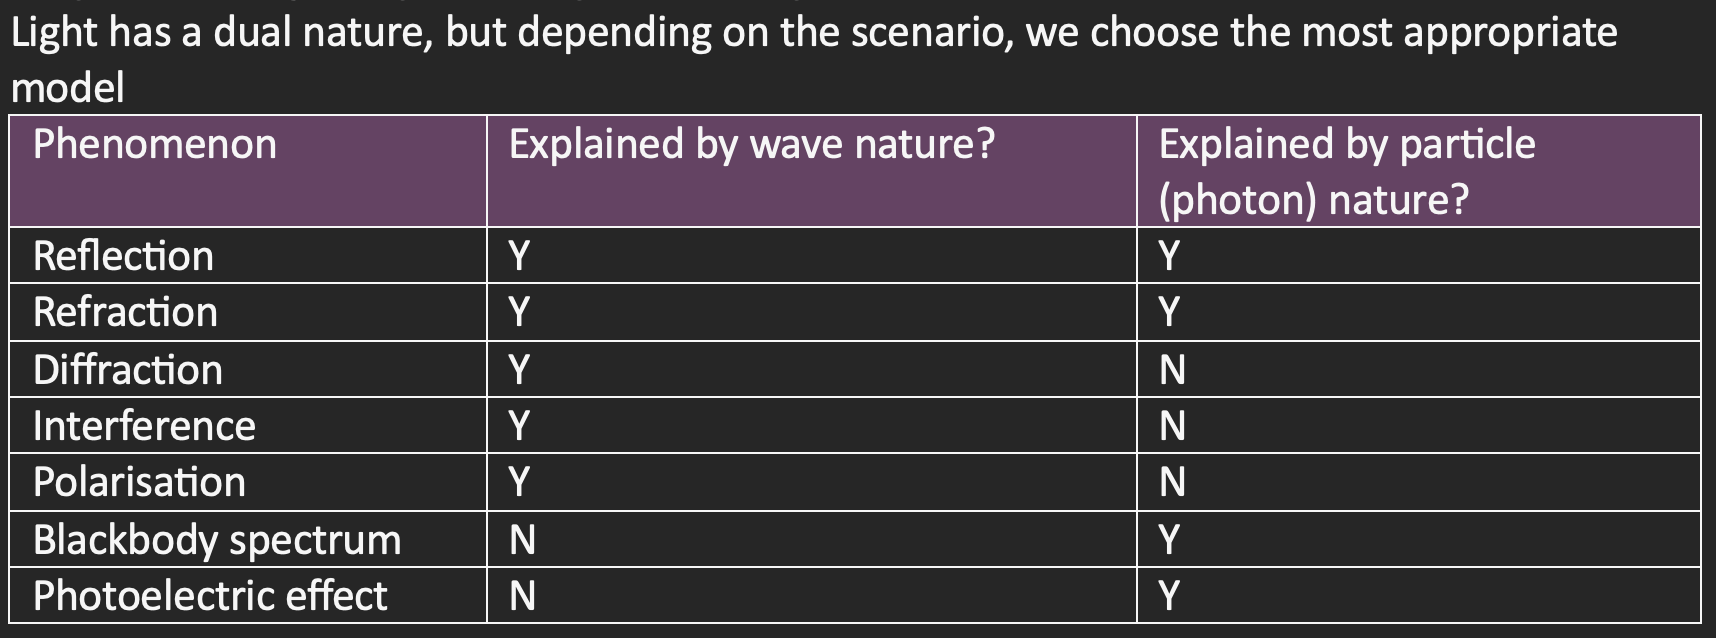
Properties of light explained by wave and particle behaviour
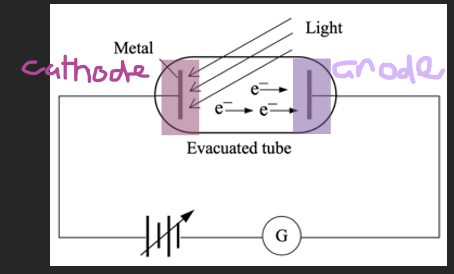
The Photoelectric Effect and competing theories
phenomenon where electrons are ejected from a metal when light is shone on the metal surface
Photoelectrons – electrons emitted by photoelectric effect
Whether it occurs depends on the frequency of light
Theory | Maxwell (transverse) | Einstein (photon) |
Location of energy | Across wavefronts | In photons |
Absorption of energy | Continuous | Discrete |
Explanation of photoelectric effect | Classical theory → all frequencies of EM can cause effect, emission only depends on time and intensity
| Quantum theory
|
Factors that impact the properties of photoelectric transmission | No. of photoelectrons and their Kmax are dependant on intensity of light | No. of photoelectrons per second → Depends on: Intensity of light + must be above threshold frequency for emission in the first place Largest (initial) kinetic energy of photoelectrons →Depends on: Frequency of light (higher frequency above threshold frequency = more energy in photon = more energy leftover after overcoming work function= Kmax increases) |
Was it correct? | No | Yes |
Experimental set up for photoelectric effect
A high potential difference between the cathode end (- side) and the anode (+ side)
This potential difference creates electric field lines
When a light of a specific frequency or higher is shone onto the cathode, electrons can break free and jump off the metal
They then accelerate to the anode
Pass through the anode and an ammeter measures the current (rate of photoelectrons passing through)
Results of photoelectric experiment → impact of different factors on photoelectric current
Impact of frequency on current (no. of photons emitted) | Electric current remains constant as light frequency increases (flat line) |
Impact of Intensity on current (no. of photons emitted) | Current increases with the intensity of light (LINEAR), not frequency
|
Impact of changing the voltage difference between plates on current | As anode voltage becomes negative it is called the stopping electrode
As voltage increases, the photoelectrons can accelerate from the cathode to the anode faster, increasing the current, but it reaches a limiting value
|
Measuring maximum kinetic energy of the photoelectrons
Use ammeter to measure photoelectric current
We slowly increase the V (make it more negative) until current = 0
That is V stopping
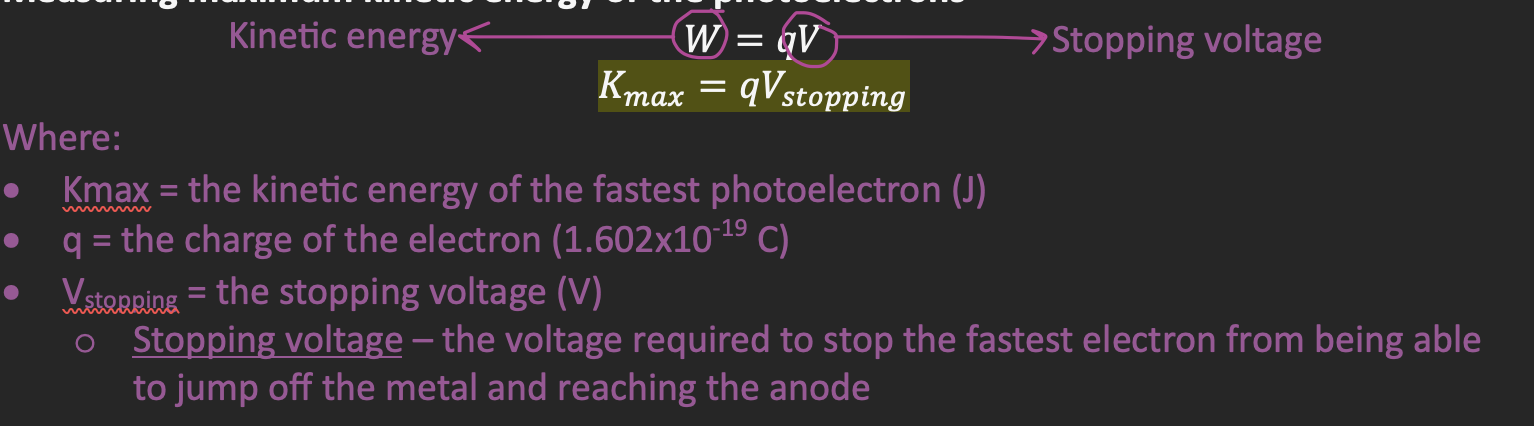
Quantitative data on the photoelectric effect
If we plot Kmax vs frequency of incident light (SI units), the gradient is plank’s constant
Gradient is only Planck’s constant if it is in SI units, and the y-axis is energy
If Y-axis is voltage/potential difference, just multiply it by 1.602x10⁻¹⁹ to get W=qV
Then using y=mx+b, we get the equation: Kmax=hf-ϕ
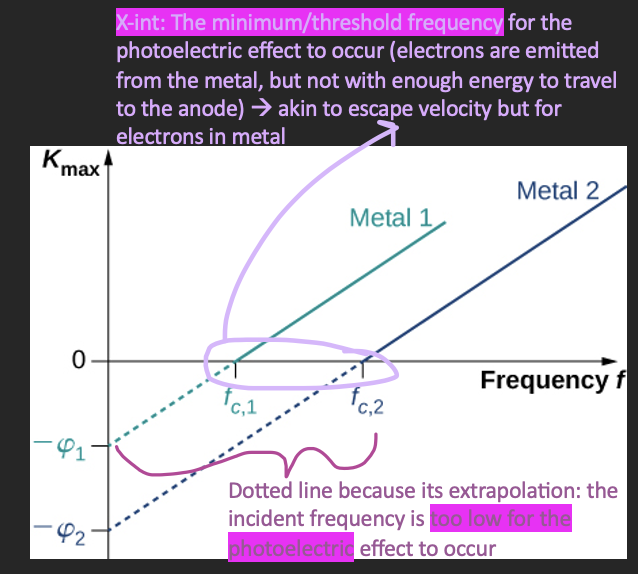
The work function
the minimum energy with which an electron is bound in the metal
Different for each metal
Can be determined if:
We know the y-intercept → ϕ is the y-int
We know the threshold frequency (x-intercept)
Light at the threshold frequency gives just enough energy for electrons to overcome the work function
It is free from the atom, but doesn’t have enough energy to jump off the metal
If f = f0, then Kmax = 0 → hf0 = ϕ
Any leftover energy after overcoming the work function becomes kinetic energy