set 2: ocean warming & coastal change
1/13
There's no tags or description
Looks like no tags are added yet.
Name | Mastery | Learn | Test | Matching | Spaced | Call with Kai |
|---|
No analytics yet
Send a link to your students to track their progress
14 Terms
why has there been a worldwide coral decline
human activity results in lower abundance
less diversity leads to less structural complexity etc
points from Hughes T.P
measured changes in percentage cover of coral and percentage cover of seaweed
across 20 years it massively declined from 60% coverage to 10% coverage
this was replaced by an increase in algal cover
reef has undergone a phase shift
what is a phase shift
when a reef goes from being dominated by one thing to being dominated by another
what are the driving factor of coral cover decline in the GBR
crown of thorns starfish and cyclones
climate change and heat stress
what are the three brand categories of human disturbances on reefs
fishing
coastal development
biological disturbances
how was the limited number of scientists and funding to monitor all reefs combated
Gregor Hodgson developed reef check
training amateur diver volunteers to do assessments of the reefs
suggestion that the reefs around more human activity were in a poorer state
what is coral bleaching
is the visible loss of the microscopic algae that inhabits the coral
the symptom of the breakdown in the symbiosis caused by temperature stress
when was the first global mass bleaching
1998
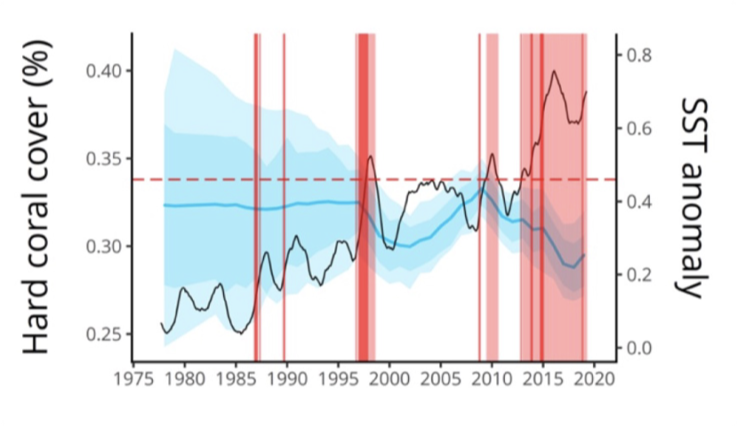
explain the recent GCMRN report
black line: sea surface temperature for coral reefs around the world
red vertical lines: thermal anomalies - annual temperature was higher than normal
big shaded blue areas are confidence intervals
coral cover between 1975 and 1995 was relatively stable
however big confidence intervals and dat amounts prior to 1995 were slim
after 1998 there is a sharp decline
big spike in temperature (black line), and thermal anomalies
el-nino year
mass coral bleaching
confidence intervals get smaller due to increased monitoring and surveys
within 10 years coral cover increases again and recovers to pre 1998
2010
second mass coral bleaching event
thermal anomalies and temperature spike
small confidence intervals
decrease in coral cover
a continued period of continued heat stress from 2012/13 - 2019
highest heat spike
big decline
small confidence intervals