Final Exam Review for Earth and Space Science
1/70
There's no tags or description
Looks like no tags are added yet.
Name | Mastery | Learn | Test | Matching | Spaced | Call with Kai |
|---|
No analytics yet
Send a link to your students to track their progress
71 Terms
Scientific Method
A systematic process used to find new knowledge.
Steps of the Scientific Method
1. Ask a Question 2. Do research to know more about your topic 3. Construct a Hypothesis 4. Experiment/test your hypothesis 5. Make a Conclusion 6. Share Results
Good Scientific Question
A question that includes an independent variable, a dependent variable, and is measurable.
Measurable Variables
Examples include Height, Weight, Speed, Heat.
Non-Measurable Variables
Examples include Opinions, Emotions, and unclear words like 'better,' 'prettier,' or 'healthier'.
Hypothesis
An educated guess or prediction of what will happen or how something works, which can be tested.
Hypothesis Structure
Must be written in the format: 'If (independent variable)... then (dependent variable).'.
Independent Variable
The variable that impacts the dependent variable.
Dependent Variable
The variable that is impacted by the independent variable.
Constant Variable
Any variable that the scientist keeps the same on purpose to prevent it from influencing the experiment.
Importance of Constant Variables
They ensure that the experiment is not influenced by other variables but only the independent variable.
Identifying Constant Variables
Everything that stays the same in an experiment is a constant.
Control Group
The group in an experiment that does not receive the experimental treatment.
Importance of Control Group
It remains unaffected, allowing for comparison with the experimental group.
Experimental Group
The group in an experiment that receives the experimental treatment.
Senses for Observations
Sight, Hearing, Taste, Touch, Smell.
Qualitative Observations
Observations that describe qualities or characteristics.
Examples of Qualitative Observations
Red, Soft, Sour, Dry.
Quantitative Observations
Numbers that describe something.
Examples of Quantitative Observations
12 meters, 20 hours, 34.5 degrees Celsius, 24 lbs.
Units for Mass
Grams.
Units for Time
Seconds, Minutes, Hours.
Units for Volume
Not specified in the notes.
Units for Temperature
Kelvin, Degrees Celsius, Degrees Fahrenheit.
Units for Speed
Meters per second.
Units for Length/Distance
Meters.
Kilo
1000 x unit
Hecto
100 x unit
Deka
10 x unit
Deci
1/10 unit or .1
Centi
1/100 unit or .01
Milli
1/1000 unit or .001
1 foot (ft)
12 inches (in)
1 yard (yd)
3 feet (ft)
1 mile (mi)
1,760 yards (yd)
1 tablespoon (tbsp)
3 teaspoons (tsp)
1 fluid ounce (fl oz)
2 tablespoons (tbsp)
1 cup
8 fluid ounces (fl oz)
1 pint (pt)
2 cups
1 quart (qt)
2 pints (pt)
1 gallon (gal)
4 quarts (qt)
1 ounce (oz)
16 drams
1 pound (lb)
16 ounces (oz)
1 ton (short ton)
2,000 pounds (lb)
Celsius to Fahrenheit
F = (C x 9/5) + 32
Fahrenheit to Celsius
C = (F - 32) x 5/9
Celsius to Kelvin
K = C + 273.15
Fahrenheit to Kelvin
K = [(F - 32) x 5/9] + 273.15
Convert 25°C to Fahrenheit
45°F
Convert 77°F to Celsius
25°C
Convert -15°C to Kelvin
258.15 K
Convert 140°F to Kelvin
333.15 K
5 components needed to create a good graph
Title, Labels, Units, Scale, Key/Legend
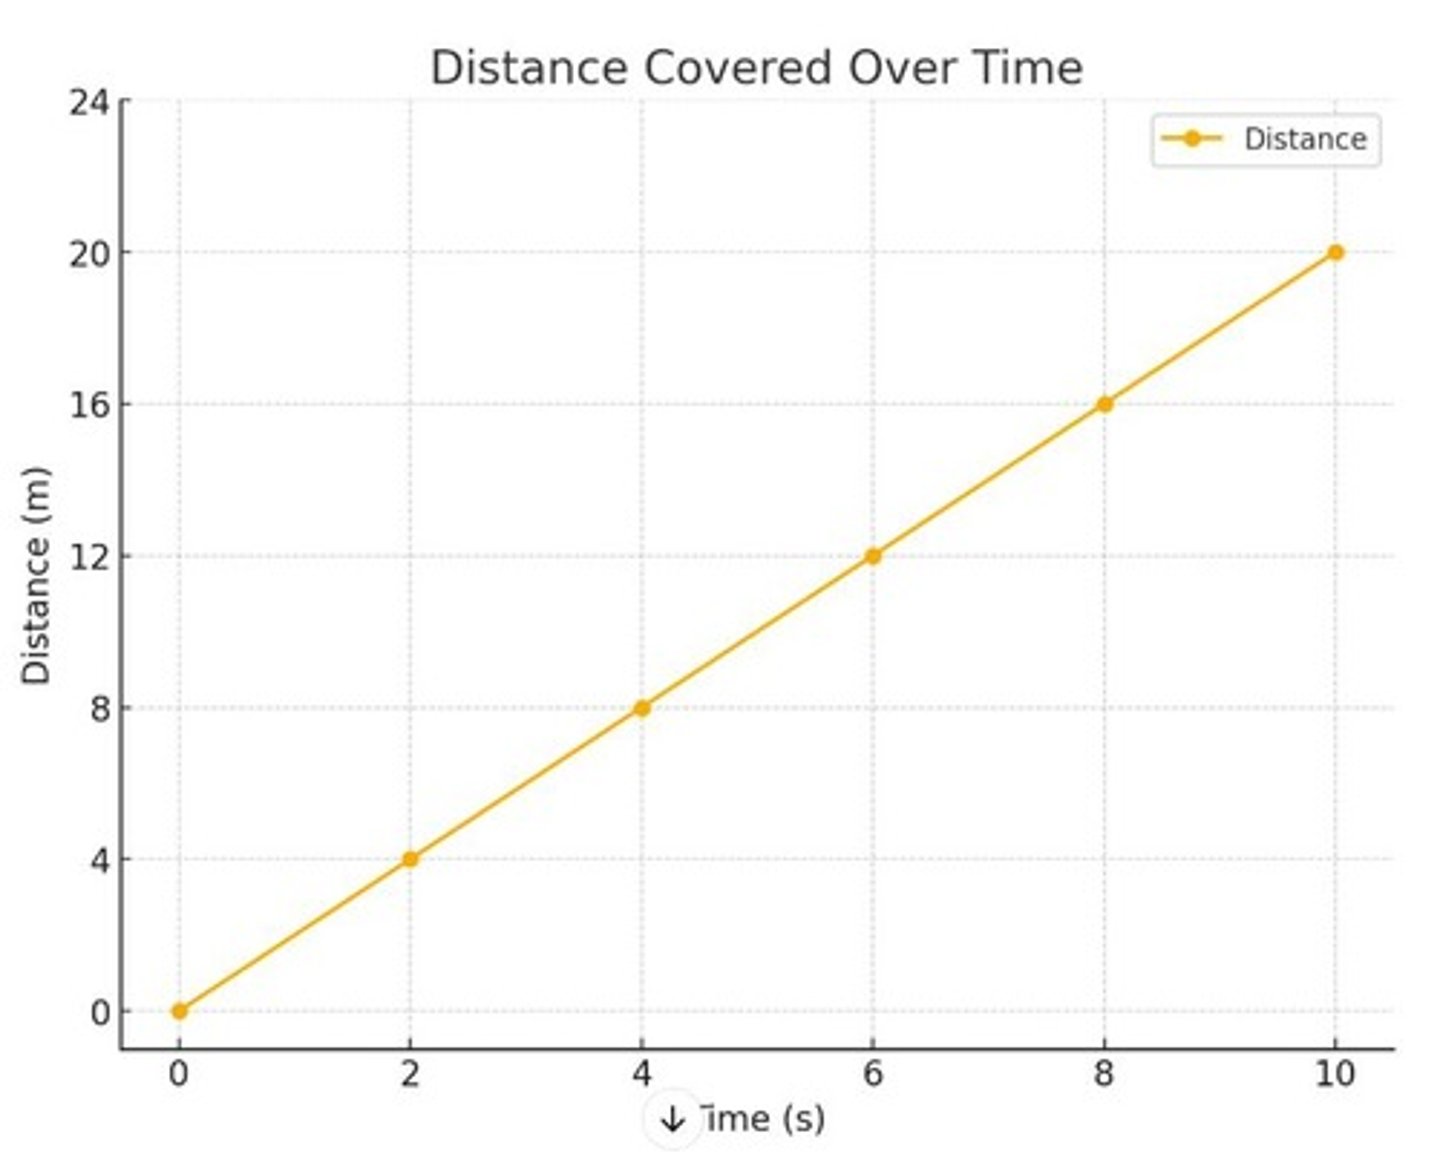
Unit of distance measured on graph
Inches, Meters, Yard, Miles
Unit of time measured on graph
Milliseconds, Seconds, Minutes, Secondaries
Rate at which distance is covered between Time = 2 s and Time = 10 s
2 miles/hour, 16 miles/hour, 2 meters/s, 16 meters/s
Total distance covered in 10 seconds
20 miles, 20 meters, 60 miles, 60 meters
Missing graph component in bar graph
Title, Units, Key, Labels
Variable measured on the y-axis
Angle, Application, Force, Degrees
Energy used by Appliance B in the kitchen
10 kWh, 35 kWh, 40 kWh, 55 kWh
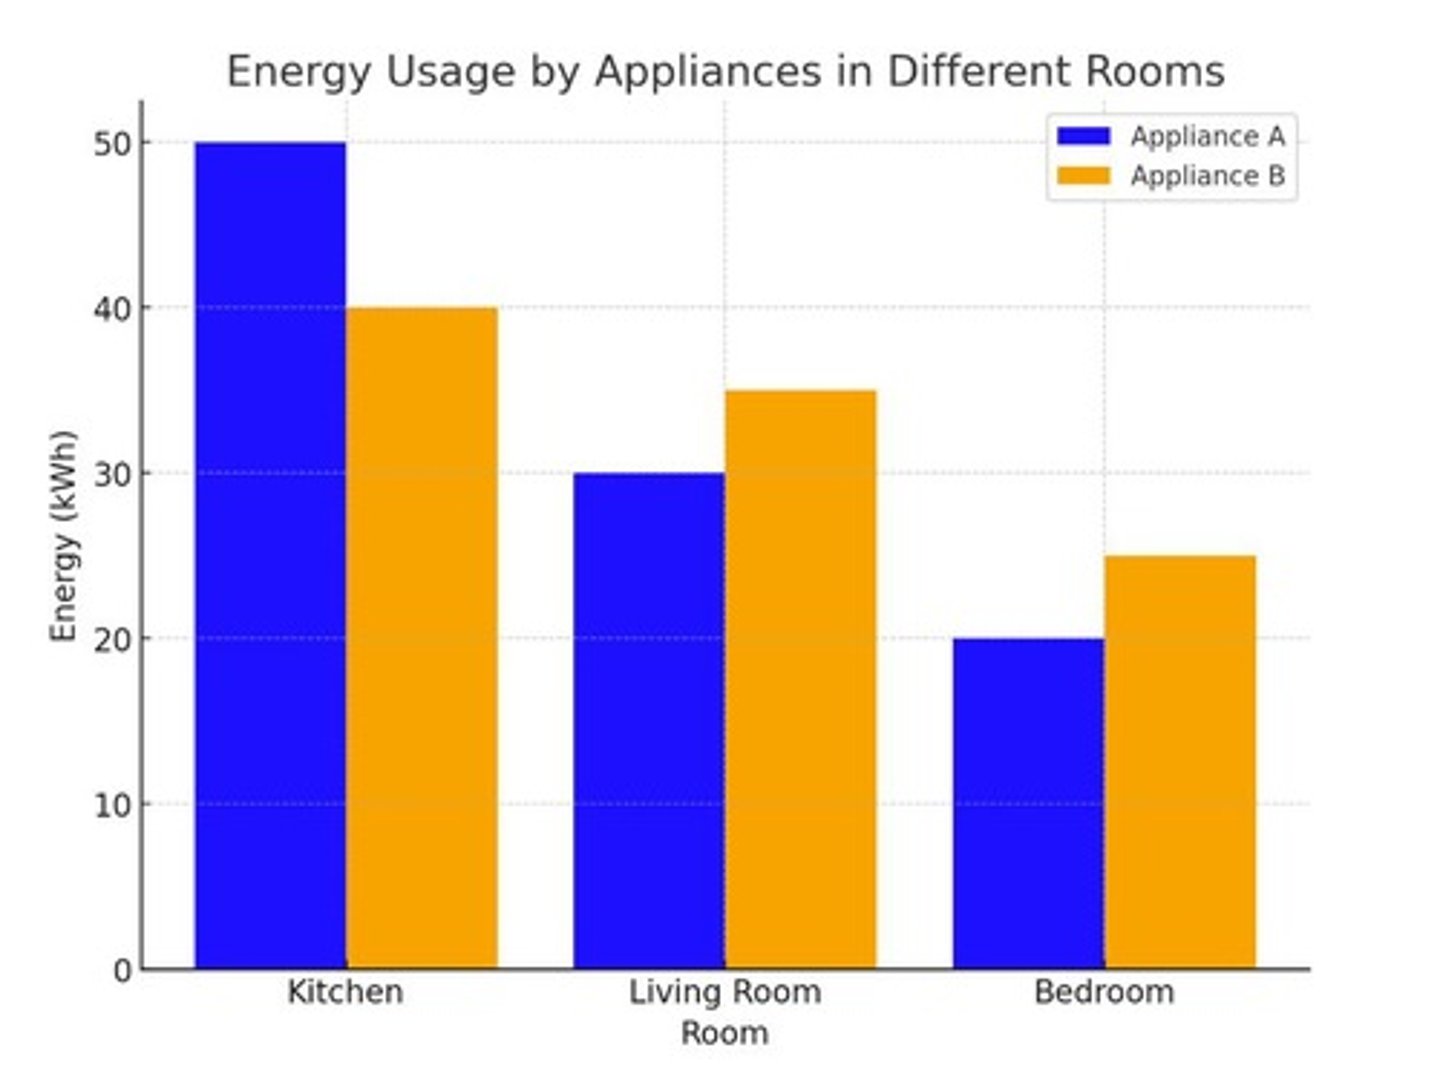
Sum of energy that Appliance A uses across all three rooms
75 kWh, 100 kWh, 150 kWh, 200 kWh
Difference in energy usage between Appliance A and Appliance B in the Living Room
2 kWh, 5 kWh, 10 kWh, 20 kWh
Difference in energy usage for Appliance A between the Kitchen and the Bedroom
5, 10, 20, 30
Distance covered by Cyclist A at Time = 5 s
1 m, 15 m, 20 m, 30 m
Difference between distance covered between Cyclist A and Cyclist B at Time = 4 s
4 m, 7 m, 10 m, 15 m
Rate at which Cyclist B covered distance in 5 seconds
1 m/s, 3 m/s, 4 m/s, 15 m/s
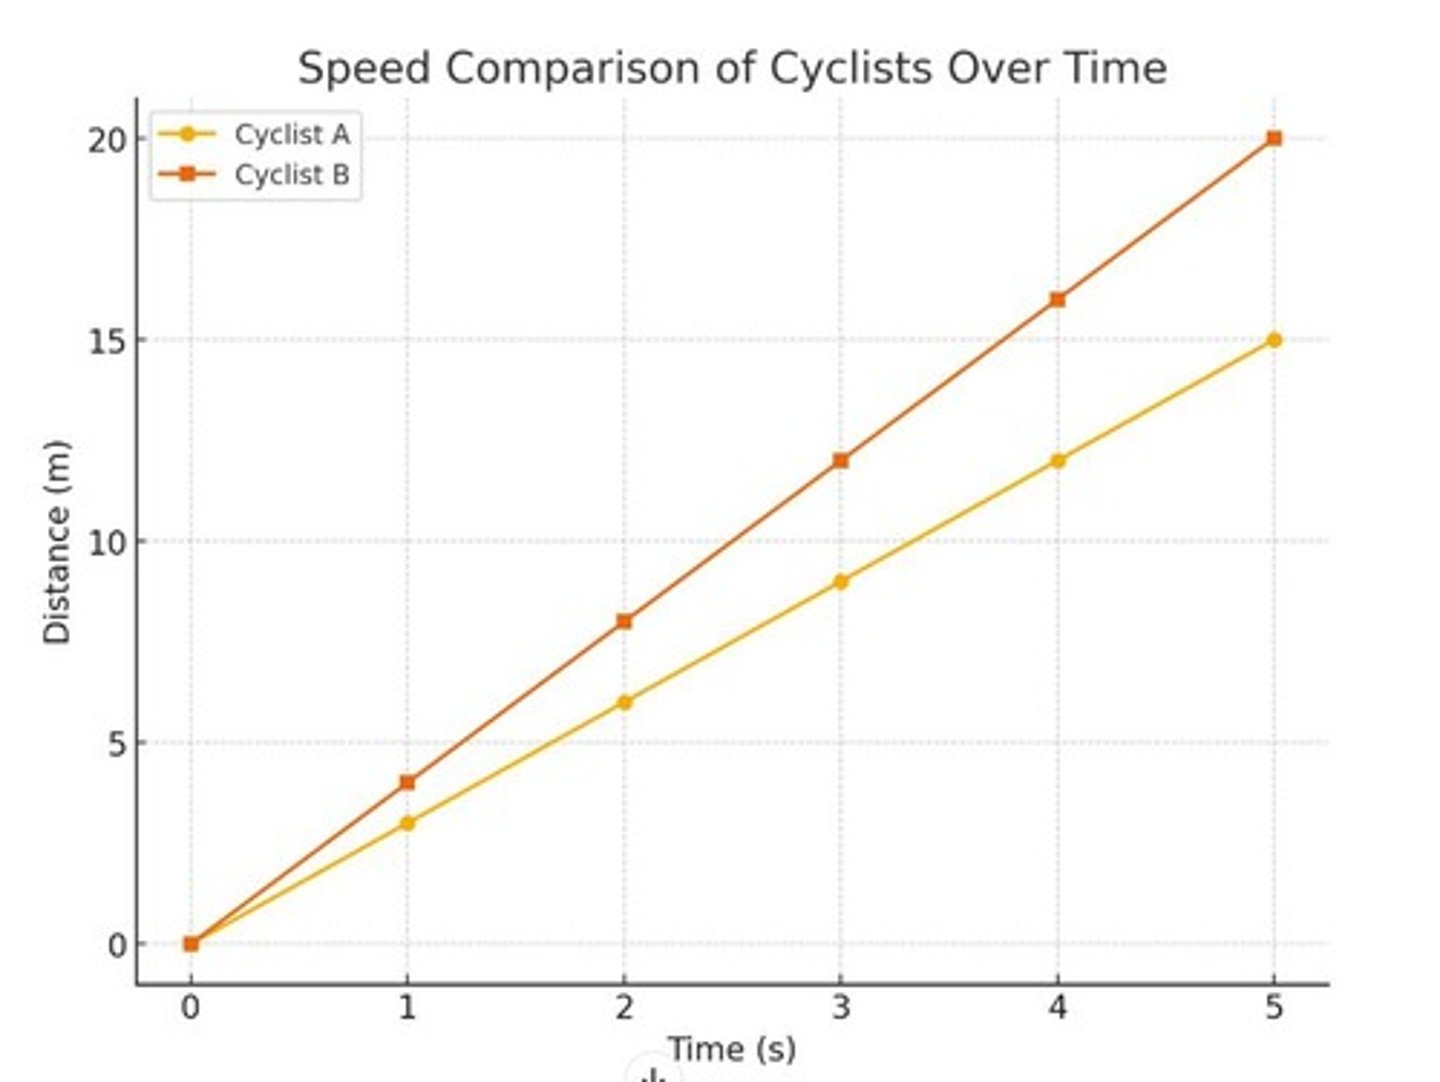
Difference between rates at which Cyclist A and Cyclist B covered distance in 5 seconds
1 m/s, 5 m/s, 10 m/s, 20 m/s
Temperature trend measured in graph
Increasing, Decreasing, Staying the same, Increasing and decreasing
Graph showing temperature of
Air, Earth, Water, Fire
Rate of temperature change over 25 seconds
-50oC/min, -2oC/min, 50oC/min, 2oC/min
Unit of temperature measured on graph
Degrees Celsius, Degrees Fahrenheit, Kelvin