2018 alevel biology
1/13
There's no tags or description
Looks like no tags are added yet.
Name | Mastery | Learn | Test | Matching | Spaced | Call with Kai |
|---|
No study sessions yet.
14 Terms
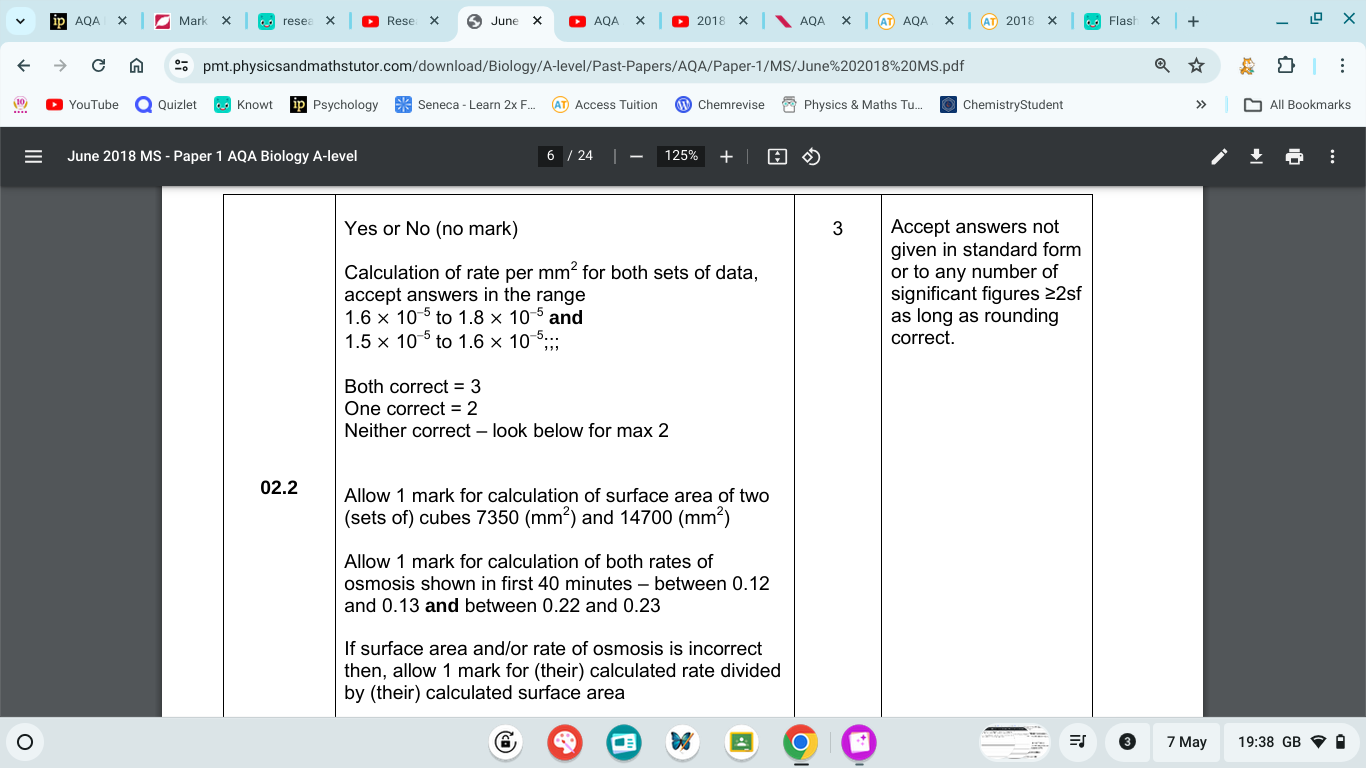
![<p>The loss in mass shown in Figure 3 is due to osmosis. The rate of osmosis between 0 and 40 minutes is faster in B (the eight small cubes) than in A (single large cube). Is the rate of osmosis per mm2 per minute different between A and B during this time? Use appropriate calculations to support your answer. [3 marks]</p>](https://knowt-user-attachments.s3.amazonaws.com/3136d0a3-0fb6-4566-beba-c6c2d4aaa19e.png)
The loss in mass shown in Figure 3 is due to osmosis. The rate of osmosis between 0 and 40 minutes is faster in B (the eight small cubes) than in A (single large cube). Is the rate of osmosis per mm2 per minute different between A and B during this time? Use appropriate calculations to support your answer. [3 marks]
![<p>From the data in Figure 4, a student made the following conclusions. 1. The natural habitat is most favourable for bees. 2. The town is the least favourable for bees. Do the data in Figure 4 support these conclusions? Explain your answer. [4 marks]</p>](https://knowt-user-attachments.s3.amazonaws.com/f48a06ee-ce73-4da9-99d1-f5af8f26aa7d.png)
From the data in Figure 4, a student made the following conclusions. 1. The natural habitat is most favourable for bees. 2. The town is the least favourable for bees. Do the data in Figure 4 support these conclusions? Explain your answer. [4 marks]
Yes, natural best, because
1. Peak of (mean) bee numbers in natural habitat is highest;
2. The (mean) number of bees was higher in the natural habitat until day 200
; 3. (Mean) species richness in natural habitat higher at all times; No, natural not best, because
4. Lowest (mean) number of bees after day 220; Yes, town worst, because
5. Peak of species richness higher in both natural and farmland OR Species richness lowest in town from day 125; No, town not worst, because
6. (Mean) species richness is lower in farmland until day 125;
7. Similar (mean) number of bees to farmland; OR (Mean) number of bees lower in farmland until day 140; General, no, because
8. Index of diversity of bees not measured OR The number of bees of each species is not known;
The scientists collected bees using a method that was ethical and allowed them to identify accurately the species to which each belonged. In each case, suggest one consideration the scientists had taken into account to make sure their method
ethical
allowed them to identify accurately the specimens to which each belonged
1. Must not harm the bees OR Must allow the bee to be released unchanged
; 2. Must allow close examination OR Use a key (to identify the species);
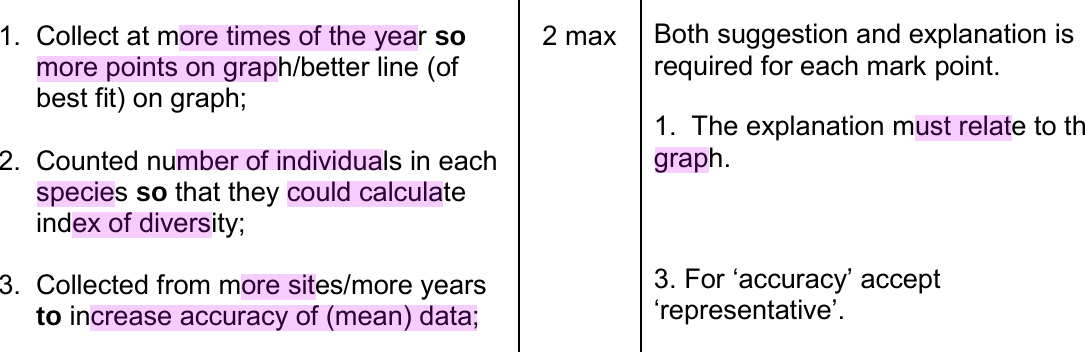
Suggest and explain two ways in which the scientists could have improved the method used for data collection in this investigation. [2]
Three of the bee species collected in the farmland areas were Peponapis pruinosa, Andrena chlorogaster and Andrena piperi. What do these names suggest about the evolutionary relationships between these bee species? Explain your answer.[2]
1. A. chlorogaster and A. piperi are more closely related (to each other than to P. pruinosa);
2. Because they are in the same genus;
![<p>A change from Glu to Lys at amino acid 300 had no effect on the rate of reaction catalysed by the enzyme. The same change at amino acid 279 significantly reduced the rate of reaction catalysed by the enzyme. Use all the information and your knowledge of protein structure to suggest reasons for the differences between the effects of these two changes. [3 marks]</p>](https://knowt-user-attachments.s3.amazonaws.com/1582842e-faa2-4b60-a77f-e453d0dd399f.png)
A change from Glu to Lys at amino acid 300 had no effect on the rate of reaction catalysed by the enzyme. The same change at amino acid 279 significantly reduced the rate of reaction catalysed by the enzyme. Use all the information and your knowledge of protein structure to suggest reasons for the differences between the effects of these two changes. [3 marks]
(Both) negatively charged to positively charged change in amino acid; 2. Change at amino acid 300 does not change the shape of the active site OR Change at amino acid 300 does not change the tertiary structure OR Change at amino acid 300 results in a similar tertiary structure; 3. Amino acid 279 may have been involved in a (ionic, disulfide or hydrogen) bond and so the shape of the active site changes OR Amino acid 279 may have been involved in a (ionic, disulfide or hydrogen) bond and so the tertiary structure changed; OR Amino acid 279 may be in the active site and be required for binding the substrate;