macroeconomics
1/109
There's no tags or description
Looks like no tags are added yet.
Name | Mastery | Learn | Test | Matching | Spaced | Call with Kai |
|---|
No analytics yet
Send a link to your students to track their progress
110 Terms
participation rate
percentage of the working-age population that is either employed or actively seeking work (labour force)
formula for the participation rate
labour force/working-age population * 100
circular flow model
illustrates how money moves through the economy, showing the interactions between different sectors like households, businesses, the government, and foreign markets. In the model:
Households provide labor to firms in exchange for income.
Firms produce goods and services, which they sell to households and other firms.
Government and foreign sector also interact with these flows by collecting taxes and providing goods and services or importing/exporting goods.
key insights from the circular flow model
-aggregate spending (total spending in the economy, including consumption, investment, government spending, and net exports) drives aggregate output (the total value of goods and services produced)
-if the total spending declines, firms will experience lower demand which leads to lower production
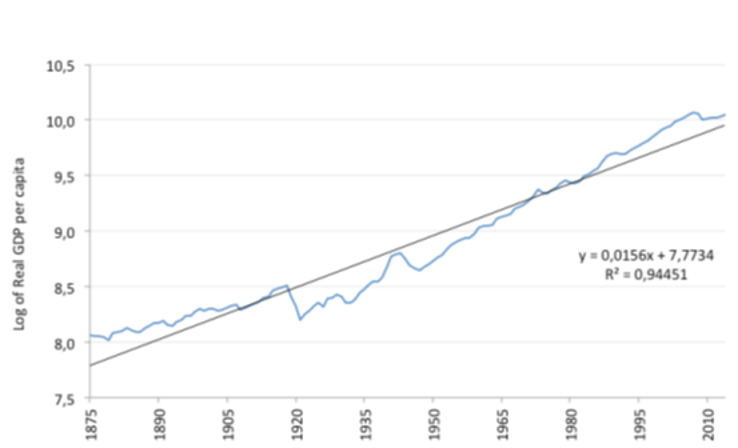
The figure above (If the image is not displayed, use this link Download link) shows the evolution of the log of UK real GDP per capita over time. Consider the statement "The growth rate of GDP per capita in the 1950s was above the long-run average since 1875."
-statement is correct, because in the 1950s the slope of the blue line is steeper than that of the black line and so growth is more rapid
-the fact that the blue line lies below the black line during this decade is irrelevant
primary reason that measuring GDP using the income approach and the spending approach yield the same value in theory?
any spending that occurs in the economy generates an equal amount of income which goes to firms, households, and the government
What happens to GDP if both domestic consumption and imports decrease by the same amount?
GDP remains unchanged.
Domestic consumption decreases, and imports decrease by the same amount.
No change in domestic production, so GDP is unaffected.
GDP deflator formula
nominal GDP/real GDP
The contribution of the growth of investment to the percentage change in GDP is given by
The percentage change in investment multiplied by the share of investment in GDP.
Dutch CPI
-CPI includes imports, they are part of the basket of products and services that households consume
-if imports become more expensive, this raises the CPI
GDP deflator
only considers goods and services that are domestically produced, so it is not affected by the prices of imported goods and services
multiplier is larger than one if and only if
the indirect effect is positive
essential feature of a goods market equilibrium in the multiplier model
Output is equal to aggregate demand
stock
measured at a point in time (flow is measured per unit of time, depreciation is the decline in the value of wealth due to use or the passage of time)
a household that buys and consumes a bar of chocolate, paying with its bank deposits. How does this affect the household's balance shee
Both assets and net worth decline.
financial accelerator
mechanism where adverse economic conditions, such as a recession, worsen financial constraints for borrowers, leading to a further decline in economic activity
Base money is equal to
cash plus reserves
which of the following best describes the role of commercial banks in the money market
They borrow base money from each other and potentially from other participants in the money market such as the central bank.
multiplier of investment spending is equal to one if and only if an increase in investment spending
increases GDP exactly by the initial increase in investment spending
In the multiplier model, an initial increase in investment induces a larger increase in output because
it increases the income of households, increasing their consumption spending (multiplier mechanism works through the consumption of households. This is why the size of the multiplier depends on the marginal propensity to consume)
leakage from the circular flow of income in the multiplier model
any portion of income that is not spent on domestic goods and services, thereby reducing the potential multiplier effect on national income
strengthening automatic stabilizers
weakens the multiplier effect, making the economy more stable
crowding out
the increase in government spending reduces private spending
process for setting the nominal wage and the nominal price at a given firm in the labour market model
the HR department does not need to know the price set by the marketing department to set the wage, but the marketing department needs to know the wage set by the HR department to set the price
Suppose that the social norms of the country change in a way that reduces the stigma of being unemployed, making it less painful for workers to become unemployed. How does this affect the wage-setting curve?
it shifts up, because there is less of an incentive to be employed
When the competition that firms face for their product decreases,
the price-setting curve shifts down
(Less competition → Higher markups (firms charge higher prices relative to costs).
Firms keep a larger share of revenue as profits, leaving less for wages.
Real wages fall because prices rise faster than wages.
The price-setting curve represents real wages, so it shifts downward)
paradox of thrift
an increase in saving by individual households (part of the economy) does not necessarily increase saving of the economy as a whole (this is because the spending of individual households is the income of other households, if the parts of the economy try to save more, total spending decreases, undermining the ability of individual households to sustain higher saving)
empirical finding of Auerbach and Gorodnichenko (2012) about the size of the multiplier?
The multiplier in expansions is smaller than one
reason why the wage setting curve is increasing in the model of the labor market
Lower unemployment makes it less costly for workers to lose their jobs, so they require a higher wage to provide effort
in the diagram of the labour market model in The Economy profits per worker are given by
the distance between the average product of labour curve and the price-setting curve
definition of automatic stabilizers in The Economy
features of the tax and transfer systems that temper the economy when it overheats and stimulate the economy when it slumps, without direct intervention by policymakers (example: proportional tax system)
What best describes what the level of the price-setting curve captures in the labor market model in The Economy?
The level of the real wage when all firms choose a profit-maximizing markup
Austerity
raising taxes or cutting government spending, which destabilizes rather than stabilizes the economy
how does reduced immigration affect the wage-
setting curve?
it shifts up, because that mens that there is less unemployment because the labour force is just smaller overall, so firms need to pay a higher real wage to induce effort
How does reduced immigration shifts the price-setting curve?
it shifts down, because a reduction in labour productivity reduces the pie, that is divided between firm owners and workers, but workers still get the same share determined by the markup, so the price-setting curve shifts down
overall explanation on how reducing immigration would affect the wage-and the price setting curves
-Reduced immigration → Fewer workers → Lower unemployment rate at each employment level → Higher wages required to induce effort → Wage-setting curve shifts up
-But lower labor productivity means firms can afford lower wages → Price-setting curve shifts down
price setting curve
-determines the real wage that firms can afford to pay workers while maintaining a given markup (profit margin) over costs
-downward shift in the price-setting curve means that firms can now afford to pay lower real wages at every level of employment, can lead to higher unemployment
-upward shift means higher real wages
wage setting curve
determines the real wage necessary to motivate workers to provide effort at each level of employment
Higher unemployment → Lower wages needed to induce effort (curve lower)
Lower unemployment → Higher wages needed to induce effort (curve higher)
interactions between the price-and the wage-setting curves
If the wage-setting curve remains unchanged, but the price-setting curve shifts down, real wages will be too low to maintain worker effort.
This can lead to higher unemployment in the long run, as firms cannot sustain high wages.
In extreme cases, stagflation (high unemployment + high inflation) can occur if wages stagnate while prices continue rising.
lower interest rates
increase autonomous consumption c0(rB)
if the output level is restored
disposable income-dependant consumption remains unchanged
Nominal interest rate
interest rate set by the central bank, and it cannot go below a certain level
Real interest rate
nominal interest rate minus the inflation rate
aggregate demand
total quantity of goods and services demanded in an economy at a given overall price level and in a given period
multiplier model
A short-run model that explains how changes in spending (e.g., government spending, tax cuts) affect aggregate demand and output.
A tax cut increases disposable income → higher consumption → shifts aggregate demand up → increases output and income.
Higher output leads to lower unemployment in the short run
Medium-Run Model
A model that accounts for how output, wages, and prices adjust over time after a demand shock.
Key Mechanism:
Higher aggregate demand lowers unemployment.
Workers demand higher wages to compensate for effort.
Firms raise prices to maintain markups, leading to higher inflation.
Over time, the economy adjusts to a new equilibrium with potential inflationary effects
Long-Run Model
Definition: Focuses on economic growth and productivity rather than demand fluctuations.
Key Mechanism:
Labour productivity growth is crucial for long-term supply-side expansion.
If tax cuts increase productivity growth, they could lower unit costs for firms.
This could reduce inflation by allowing firms to set lower prices while maintaining markups
how do we determine monthly inflation
month-to-month percentage change in the consumer price index for a given
month (e.g. November) and averaged it across all available years before 2022, and compared
this average to the value for this month in 2023
According to the mechanisms of precautionary saving and the financial accelerator, a decline in house prices will
reduce consumption for both credit-constrained households as well as households that are not credit constrained
Precautionary Saving
Saving money for unexpected events or emergencies, such as medical expenses, job loss, or natural disasters
financial accelerator,
A mechanism in the economy where small changes in economic conditions, such as income or asset prices, can be amplified and magnified by financial markets, leading to larger changes in economic activity
model of the investment decision in The Economy
-for projects to go ahead, the profit rate must exceed both the interest rate and the discount rate
-if the discount rate is higher than the interest rate, it is the discount rate which determines which projects can go ahead
endowment point
represents the initial amount of consumption available without any borrowing or lending
It is where a consumer’s income or wealth intersects with their initial consumption
the slope of the budget line (which shows trade-offs between consumption now vs. later) changes depending on whether the individual is borrowing or lending, and this switch happens at the endowment point
slope of the budget line change when moving to the right of the endowment point
becomes steeper if it reflects a higher interest rate when borrowing
if an individual borrows more (increasing current consumption), they sacrifice future consumption too pay back the debt
medium run model diagram analysis
inflation is equal to expected inflation pus the bargaining gap
bargaining gap
difference between the real wage that firms are willing to pay to keep workers motivated and the real wage they need to pay them to maximize profits
CPI
measures inflation, includes imports, if they become more expensive the CPI rises
a bigger participation rate
means a bigger labour force so probably more unemployment overall
labour force
employed + the unemployed
participation rate
percentage of people (both employed and unemployed) of a working age and condition
no effect on the multiplier
change in autonomous spending
the price level (in the short-run)
autonomous spending
spending that is not affected by changes in income or the GDP (so necessary spending/spending that occurs even if there’s no income)
effects on the multiplier
a higher MPC (marginal propensity to consume) leads to a higher multiplier
a higher MPS (marginal propensity to save) leads to a lower multiplier
taxes (higher taxes reduce disposable income and therefore spending, which lowers the multiplier)
imports, more money leaving the country reduces the multiplier
interest rates, higher ones reduce spending, and therefore the multiplier
indirect effects of government spending (initial spending increases economic activity and therefore the multiplier)
increased consumption (people who receive government contracts or wages spend their “new” income on goods and services boosting the economy
potential business investments, so if the money is pumped into certain sectors that may increase output
increased tax revenues (as businesses grow more they may have o pay bigger taxes)
an increase in government spending
has a direct impact on aggregate demand and output raising them one for one
size of the multiplier than depends on the strength of the additional indirect effects such as the consumption of households
key to the size of the multiplier
how sensitive consumption is to changes in output
BVAR (Bayesian Vector Autoregression)
statistical model to analyse the relationships between multiple economic time series
improves estimates, especially with small data samples & limited information
helps quantify the effects of monetary policy like interest rate changes on inflation output etc.
particularly useful for studying monetary policy shocks and understanding how central bank actions influence economic variables (inflation output etc.) especially in the context of high inflation
incorporating Bayesian priors (using prior knowledge) reduces overfitting by ensuring that the model doesn't just memorize the data but rather incorporates prior beliefs about how the world works, leading to more robust and reliable predictions
the priors help reduce overfitting (focusing too closely on a specific data sample)
Incidental (also referred to as one-off) contributions to inflation
-one time shocks that are non-reoccurring but contribute to inflation nonetheless
-such as supply chain disruptions (natural disasters, pandemics, geopolitical tensions)
-tax increases (tho once they are absorbed inflation stabilises)
-commodity price shocks
-currency depreciation
DNB NJR Scenario
describes main effects of international protectionism on world trade and on Dutch economy under increasing uncertainty
assumptions: US implements 60% import tariffs on goods from China and 10% from Europe
they retaliate with tariffs for the US
uncertainty increases world-wide
central banks react by setting policy rates (interest rates) according to inflation
imports would get more expensive worldwide
world trade is dampened
dollar appreciates, which would be bad for the US foreign competitiveness
US would take a big hit, the GDP would drop, pulling down world trade even further
direct effects seem limited but indirect effects would mount for the Netherlands > trade war
US would be worst off, protectionism would backfire cuz they would barely have trade partners while Europe would still have each other
Netherlands for example super dependent on trade, so better of than the US but worse than the rest of Europe
so the negative effects for the Netherlands would be lower exports, lower investments, higher unemployment
economic growth would be reduced, inflation would rise
financial accelerator vs multiplier
financial accelerator focuses on changes in financial condition
multiplier on spending
the multiplier is larger than one only if
the indirect effect is positive
when the primary deficit is zero
debt grows at the rate of interest while the GDP is growing with its growth rate
if the ratio is shrinking the GDP is growing faster than the debt, so the interest rate must be lower
why does crowding out happen
an increase in government spending can also increase interest rates
taylorism
method of industrial management designed to increase efficiency and productivity
bargaining effect increases unemployment because
unions/workers can bargain for higher wages & better conditions
if wages rise above the market-clearing level employers higher fewer workers/replace them with automation
voice effect (being able to voice dissatisfaction etc. in the workplace) decreases unemployment, because
allows for workers to express their discontentment without quitting
can lead to workplace improvements making jobs more attractive ad stable
diffusion gap when introducing new technology
large differences in productivity between most & least productive firms when many firms are slow to adapt new technologies
PAYG (pay as you go) pension vs funded pension
PAYG depend on current contributions for retirees' benefits
funded pensions is when investments & their returns provide for future pensions
calculating the innovation rate
difference between (for example) how much it costs to employ a worker vs technology BEFORE - AFTER (so like how much it changed)
if real wages increase & the average product of labour goes up
unemployment (usually) decreases
steady state
key economic variables—such as capital stock, output, consumption, and population—grow at constant rates, and the economy is in long-term equilibrium
in this state, the economy maintains a balanced growth path where net investment (new capital formation minus depreciation) is zero, meaning that capital per worker remains unchanged over time
net employment growth
subtracting total job destruction from total job creation
when calculating by how much steeper a graph is
look at the exponent so its not like 4 increase to 16 is an increase times 4 its like 2² to 2^4 is an increase in 2 > 2 times steeper
to determine the comparative advantage
look at how much it “costs” them to produce one product vs another, so if it costs less for one they have the comparative advantage
steady-state population size
number of births=number of deaths over time, population is steady
key features of Robert Allen's model of the industrial revolution
Britain’s high wages and cheap energy (coal) made it profitable to invest in labour saving technologies
innovation rent
reward the company receives in form of additional profits from innovations
insocost curve
when the whole budget is spent on either one
gini coefficient
more bowed Lorentz curve means higher inequality & a higher mini coefficient
if its closer to the equality 45 degree line its smaller &there is less inequality
secular stagnation
prolonged period of no economic growth
total factor productivity
portion of output growth that cannot be explained by labour or capital alone
misallocation of research&development resources
when the research funds fail to reach the most promising & productive firms and sectors
labour hoarding
retaining more workers than needed to avoid rehiring challenges later
what makes capitalism less dynamic according to the economy
organised crime forcing small businesses to hand over their private property
capital intensity
physical assets (machinery, resources) needed to produce good & services relative to labour
as capital intensity increases
capital productivity (the average product of capital) decreases
figures showing adjustment paths
always have the wage/employment gaps regarding the new equilibrium not the old one
tfp
=total factor productivity, so how efficiently an economy/business uses its inputs
capital per worker
machinery etc available to each worker aka physical capital
increase in capital per worker
happens when investment exceeds depreciation
triggers further increases in capital per worker because output is increased, so there’s more capital for investment left
as depreciation exceeds investment with time the marginal product of capital diminishes
the improvements in tech stay tho so the output reaches & stays at a new steady-state