STAT 164 - DESCRIPTIVE STATISTICS CHAPTER 1
1/78
There's no tags or description
Looks like no tags are added yet.
Name | Mastery | Learn | Test | Matching | Spaced |
|---|
No study sessions yet.
79 Terms
A body of knowledge concerned with the collection, organization, presentation, analysis, and interpretation of data.
What is statistics in the singular sense?
A collection of facts and figures or processed data.
What is statistics in the plural sense?
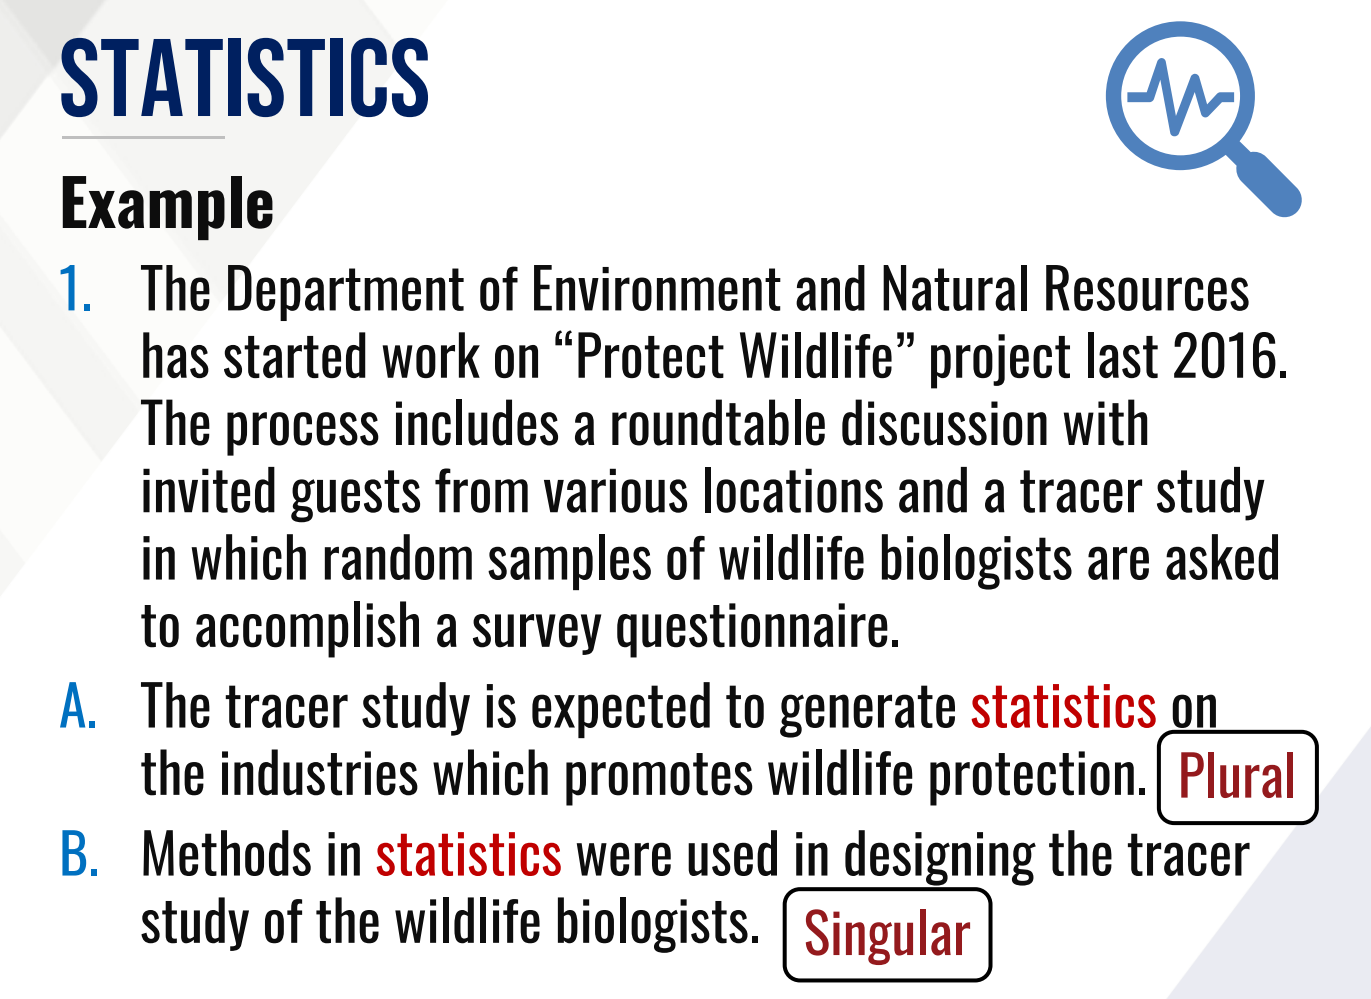
Which is the plural sense and singular sense?
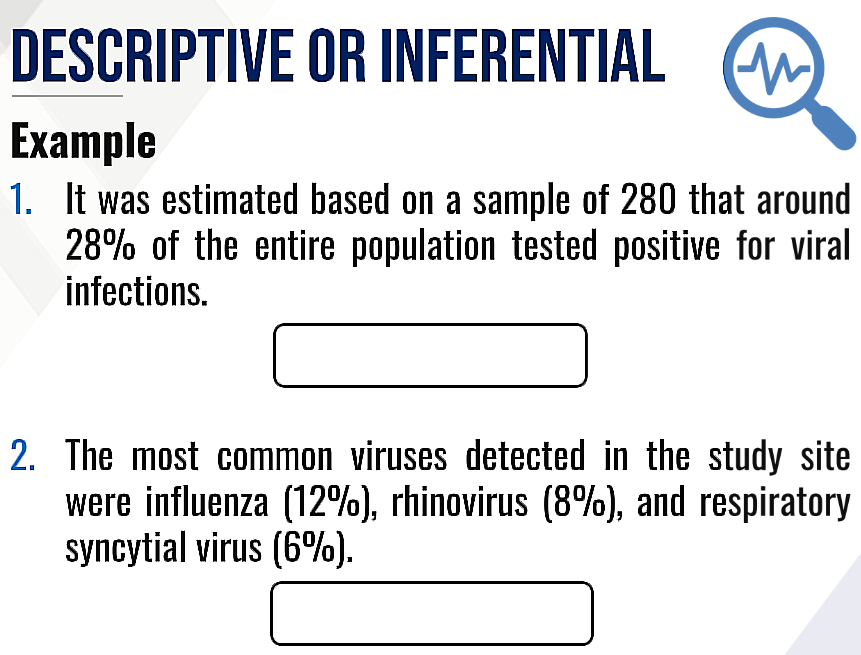
1. The Department of Environment and Natural Resources has started work on “Protect Wildlife” project last 2016. The process includes a roundtable discussion with invited guests from various locations and a tracer study in which random samples of wildlife biologists are asked to accomplish a survey questionnaire.
A. The tracer study is expected to generate statistics on the industries which promotes wildlife protection.
B. Methods in statistics were used in designing the tracer study of the wildlife biologists.
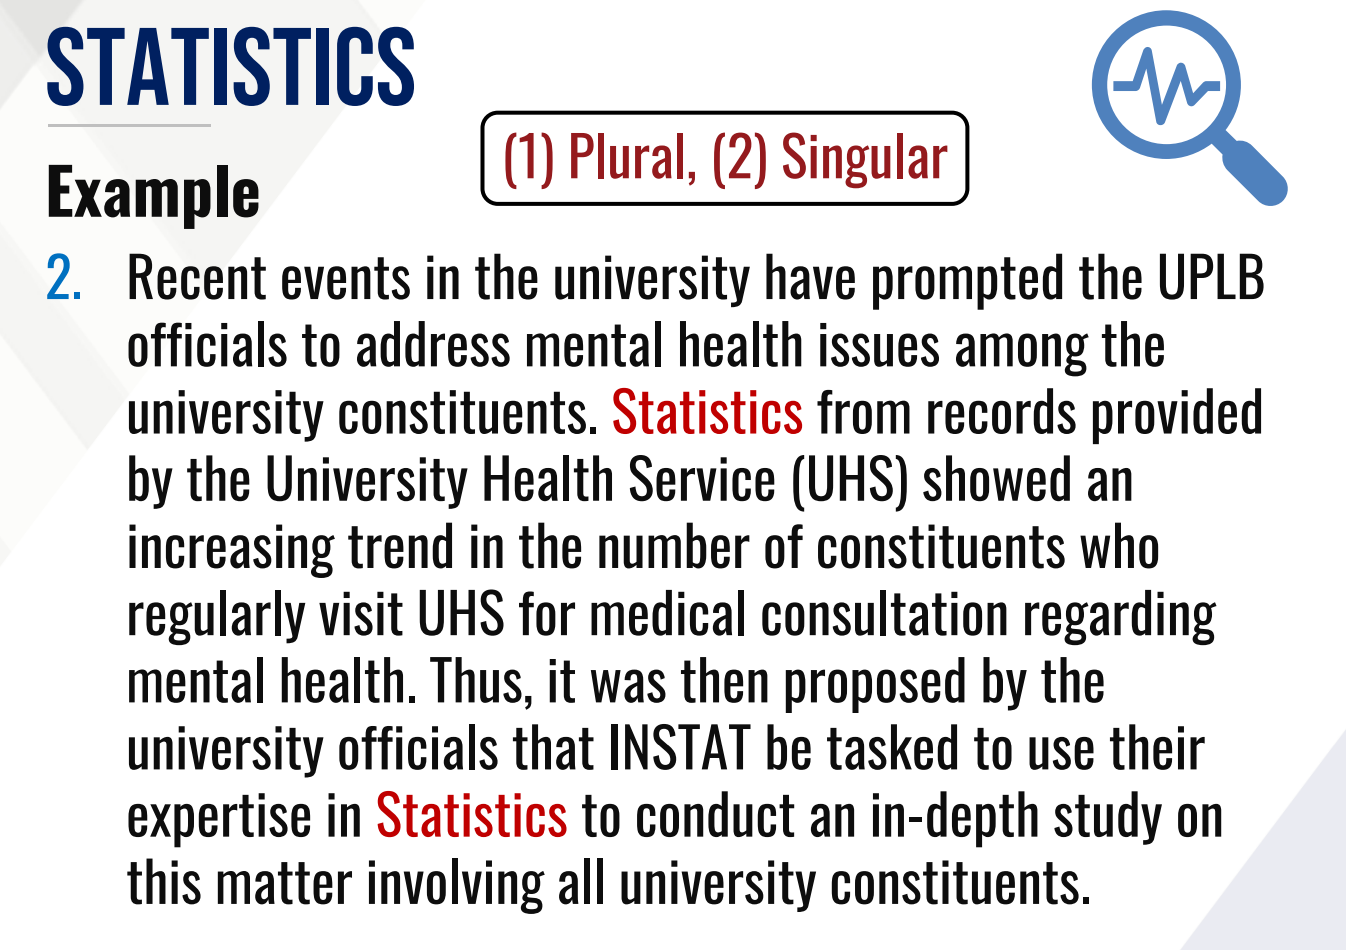
Which is the plural sense and singular sense?
Recent events in the university have prompted the UPLB officials to address mental health issues among the university constituents. Statistics from records provided by the University Health Service (UHS) showed an increasing trend in the number of constituents who regularly visit UHS for medical consultation regarding mental health. Thus, it was then proposed by the university officials that INSTAT be tasked to use their expertise in Statistics to conduct an in-depth study on this matter involving all university constituents.
Which is the plural sense and singular sense?
3. Compared to other months, statistics showed that February is the coldest month in Los Baños from 1959-2012 based on the record of daily minimum temperature.
4. Statistics predicted that the month of February will still be the coldest month in Los Baños until 2095 with an increase of 0.9°C.
UNIVERSE
A collection or set of all individuals or entities whose characteristics are to be studied
It answers the question “WHO?”
What is the universe in this example?
What is the universe in this example?

Set of all months with recorded daily minimum temperature
What is the universe in this example?
Set of all months with predicted temperature
What is the universe in this example?
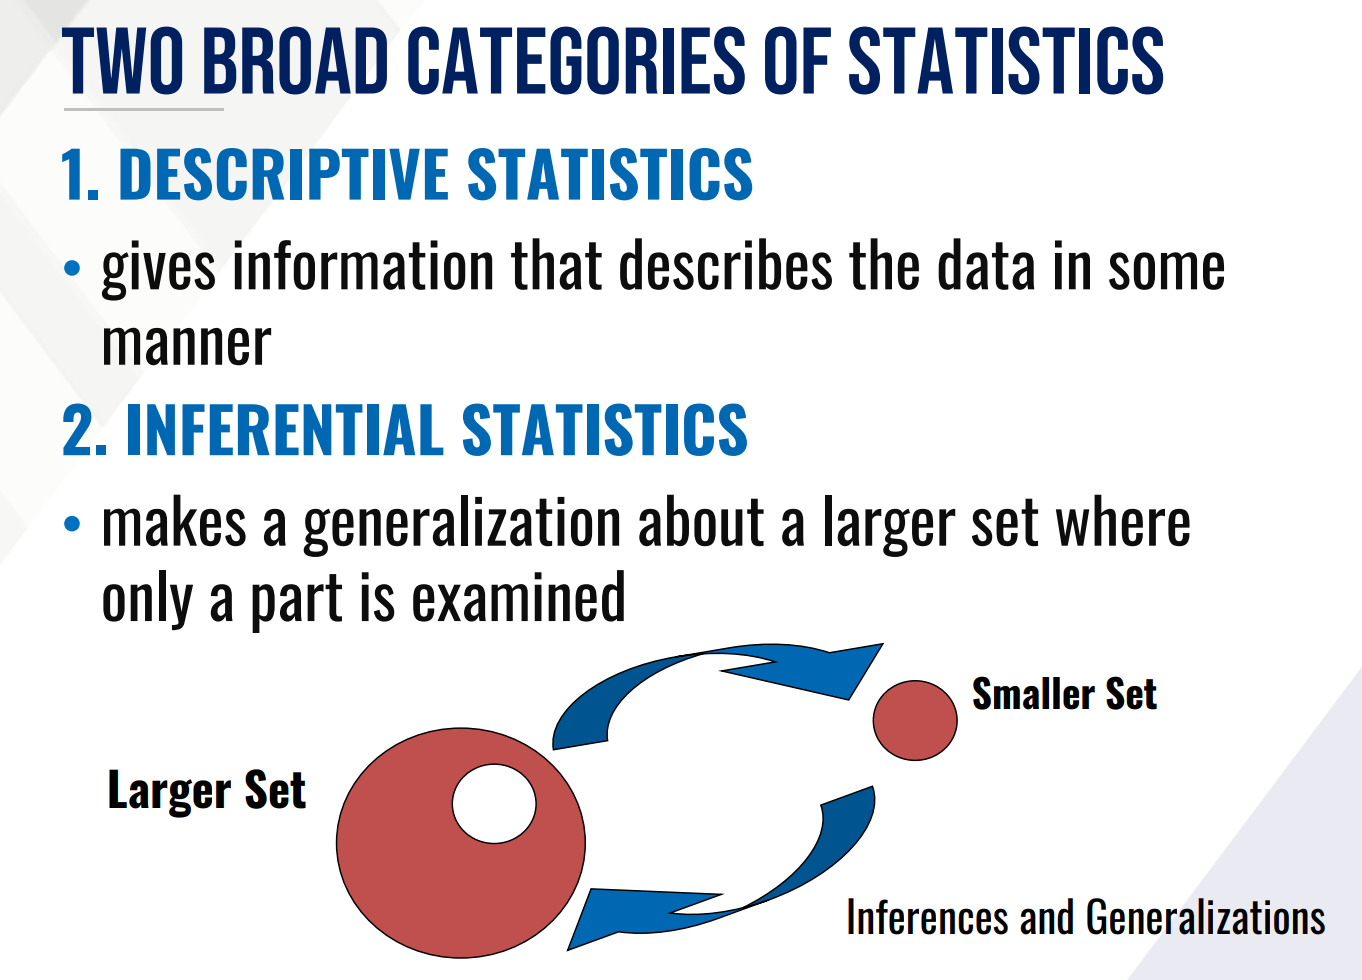
What are the TWO BROAD CATEGORIES OF STATISTICS? What are their differences?
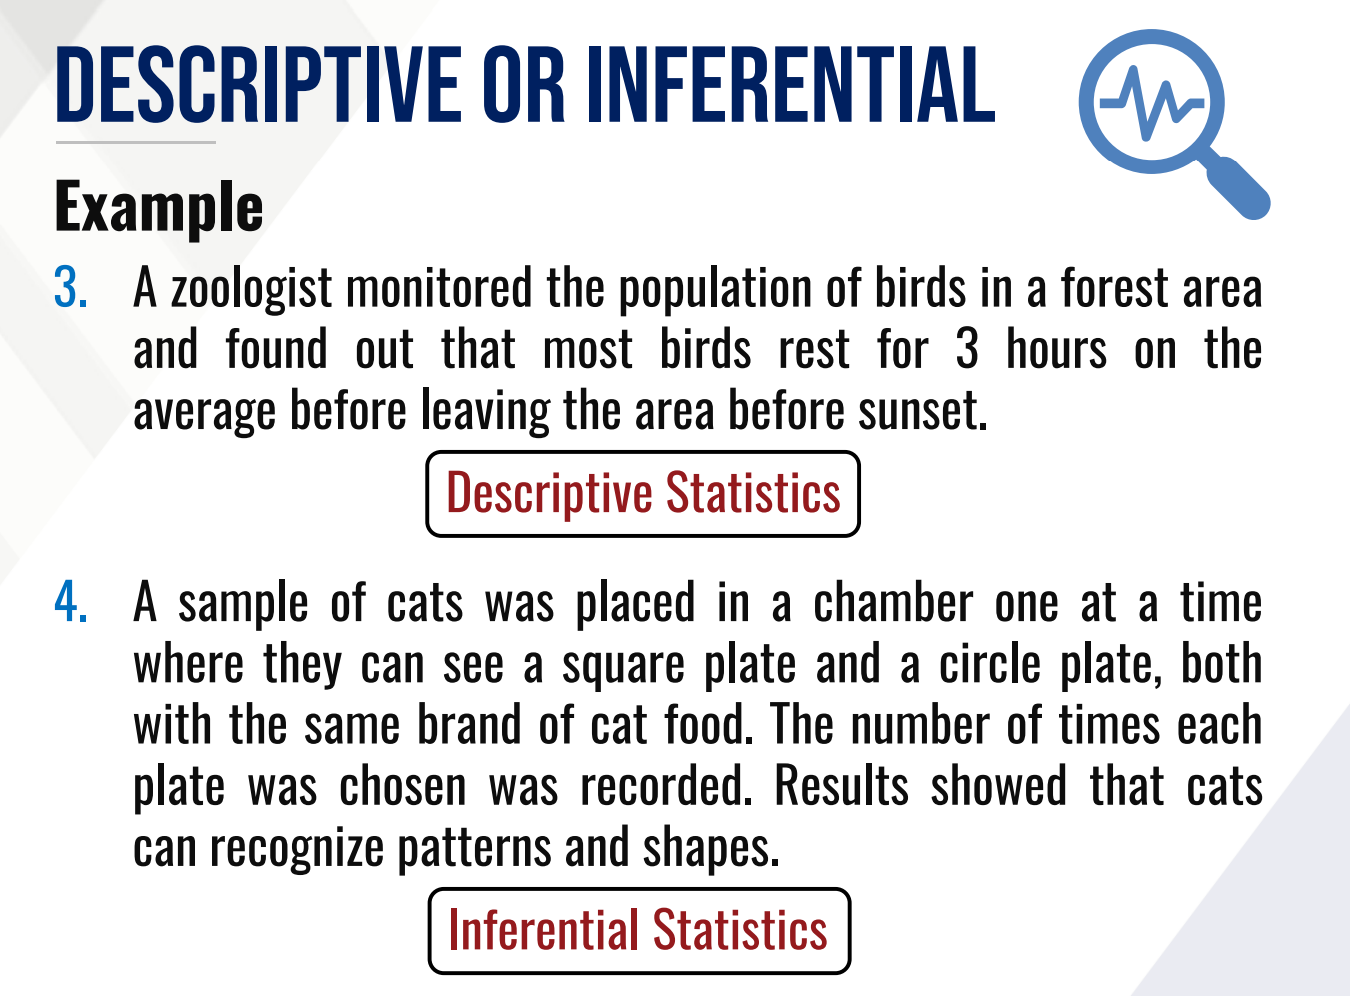
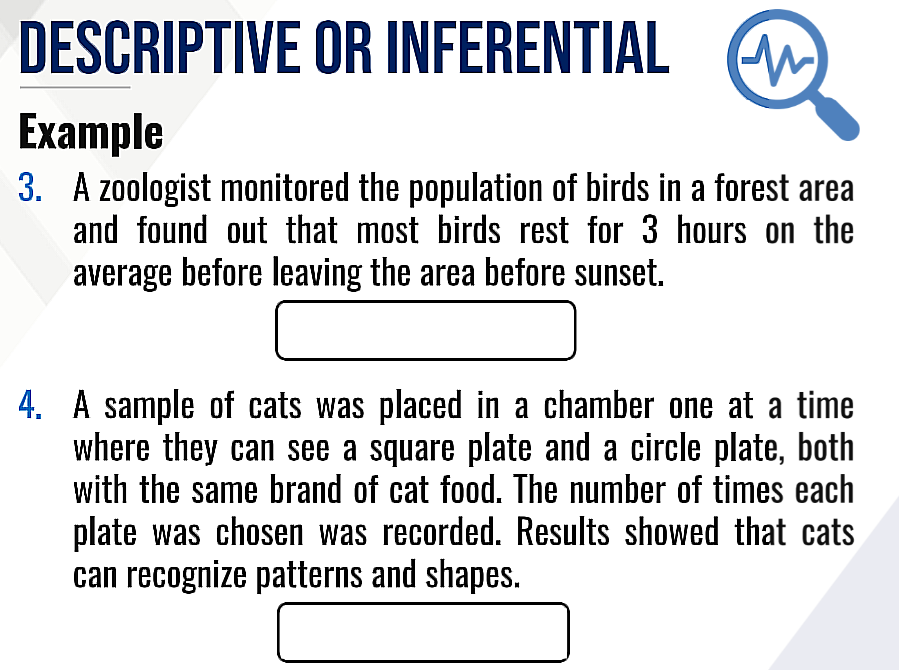
DESCRIPTIVE STATISTICS
This gives information that describes the data in some manner?
INFERENTIAL STATISTICS
This makes a generalization about a larger set where only a part is examined
DESCRIPTIVE STATISTICS
This is used to describe a mass of data in a clear, concise and informative way
DESCRIPTIVE STATISTICS
This deals with the methods of organizing, summarizing, and presenting data
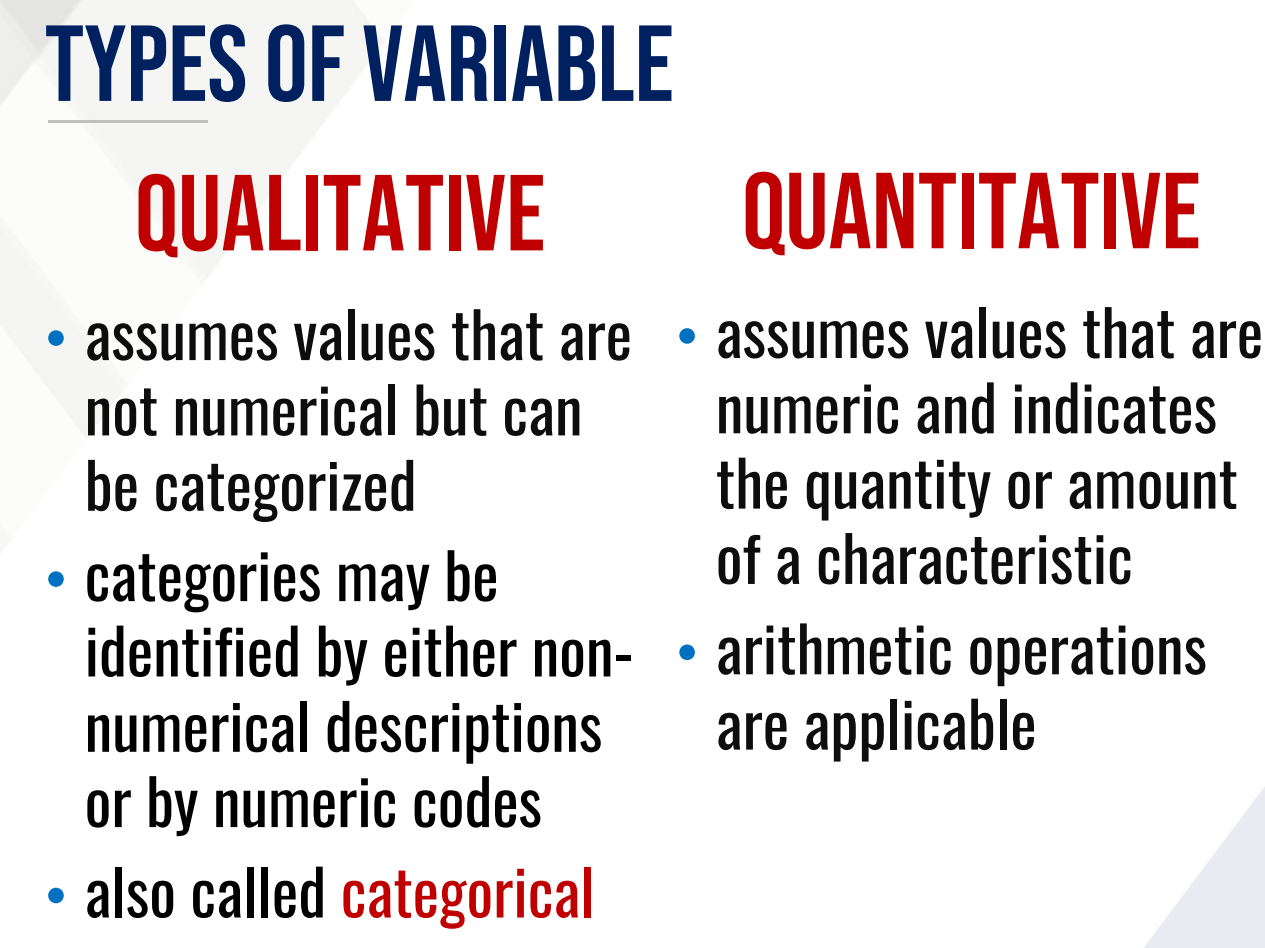
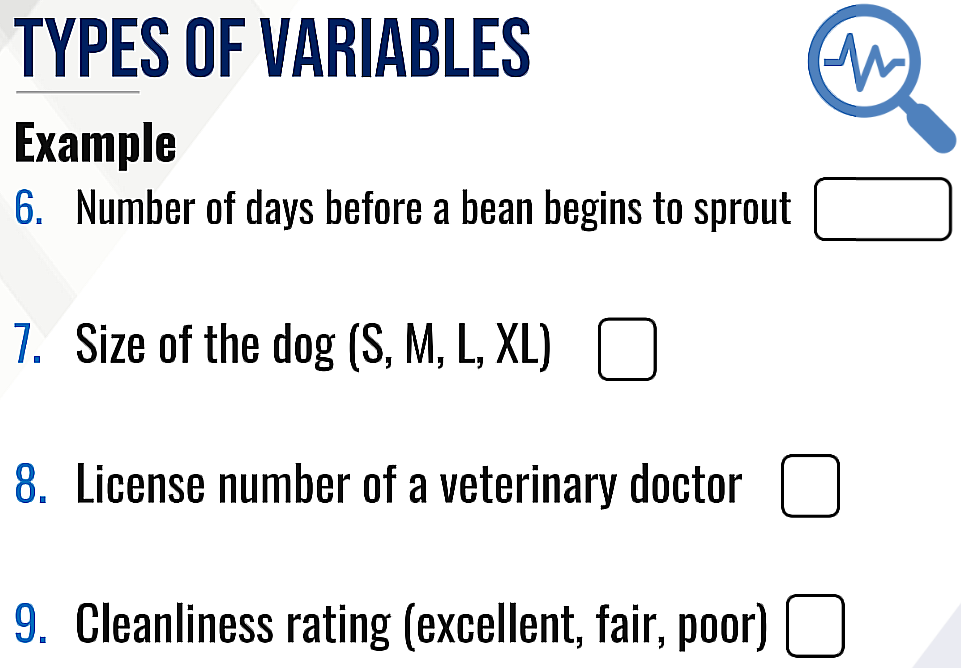
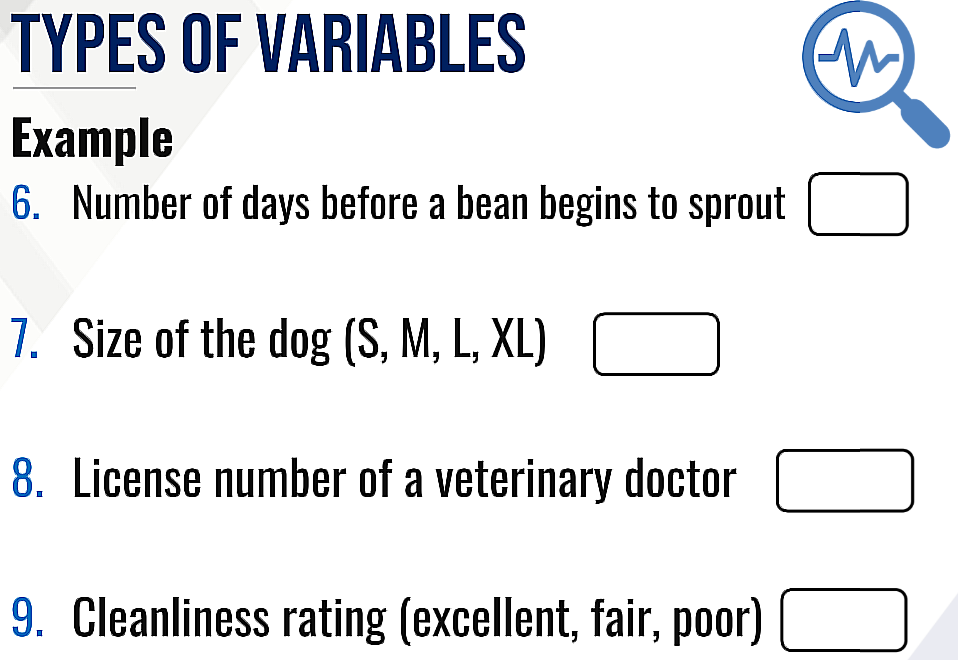
VARIABLE
Attribute or characteristic of interest measurable on each and every unit of the universe
It answers the question “WHAT?”
DISCRETE
This has a finite or countable number of possible values
CONTINUOUS
This has infinitely many values at any point on a given interval
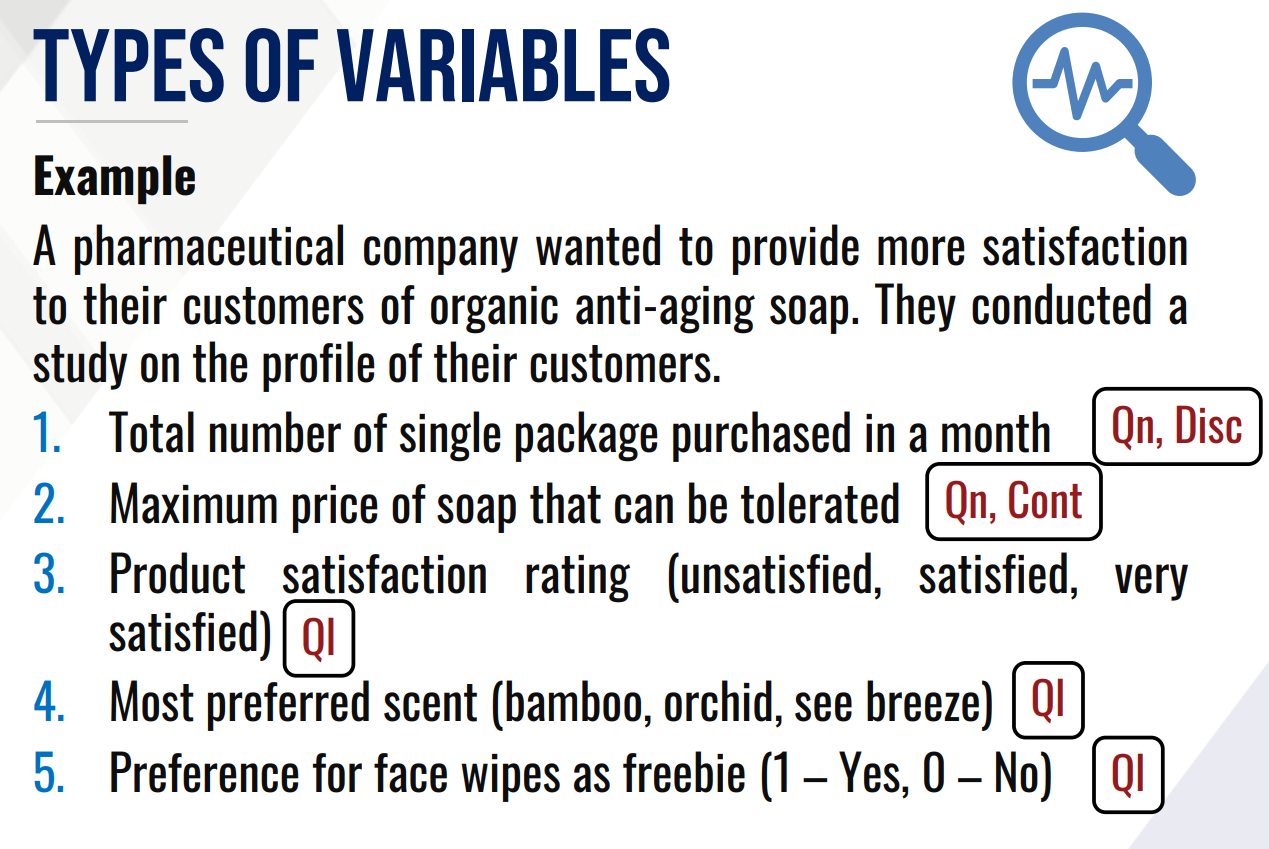
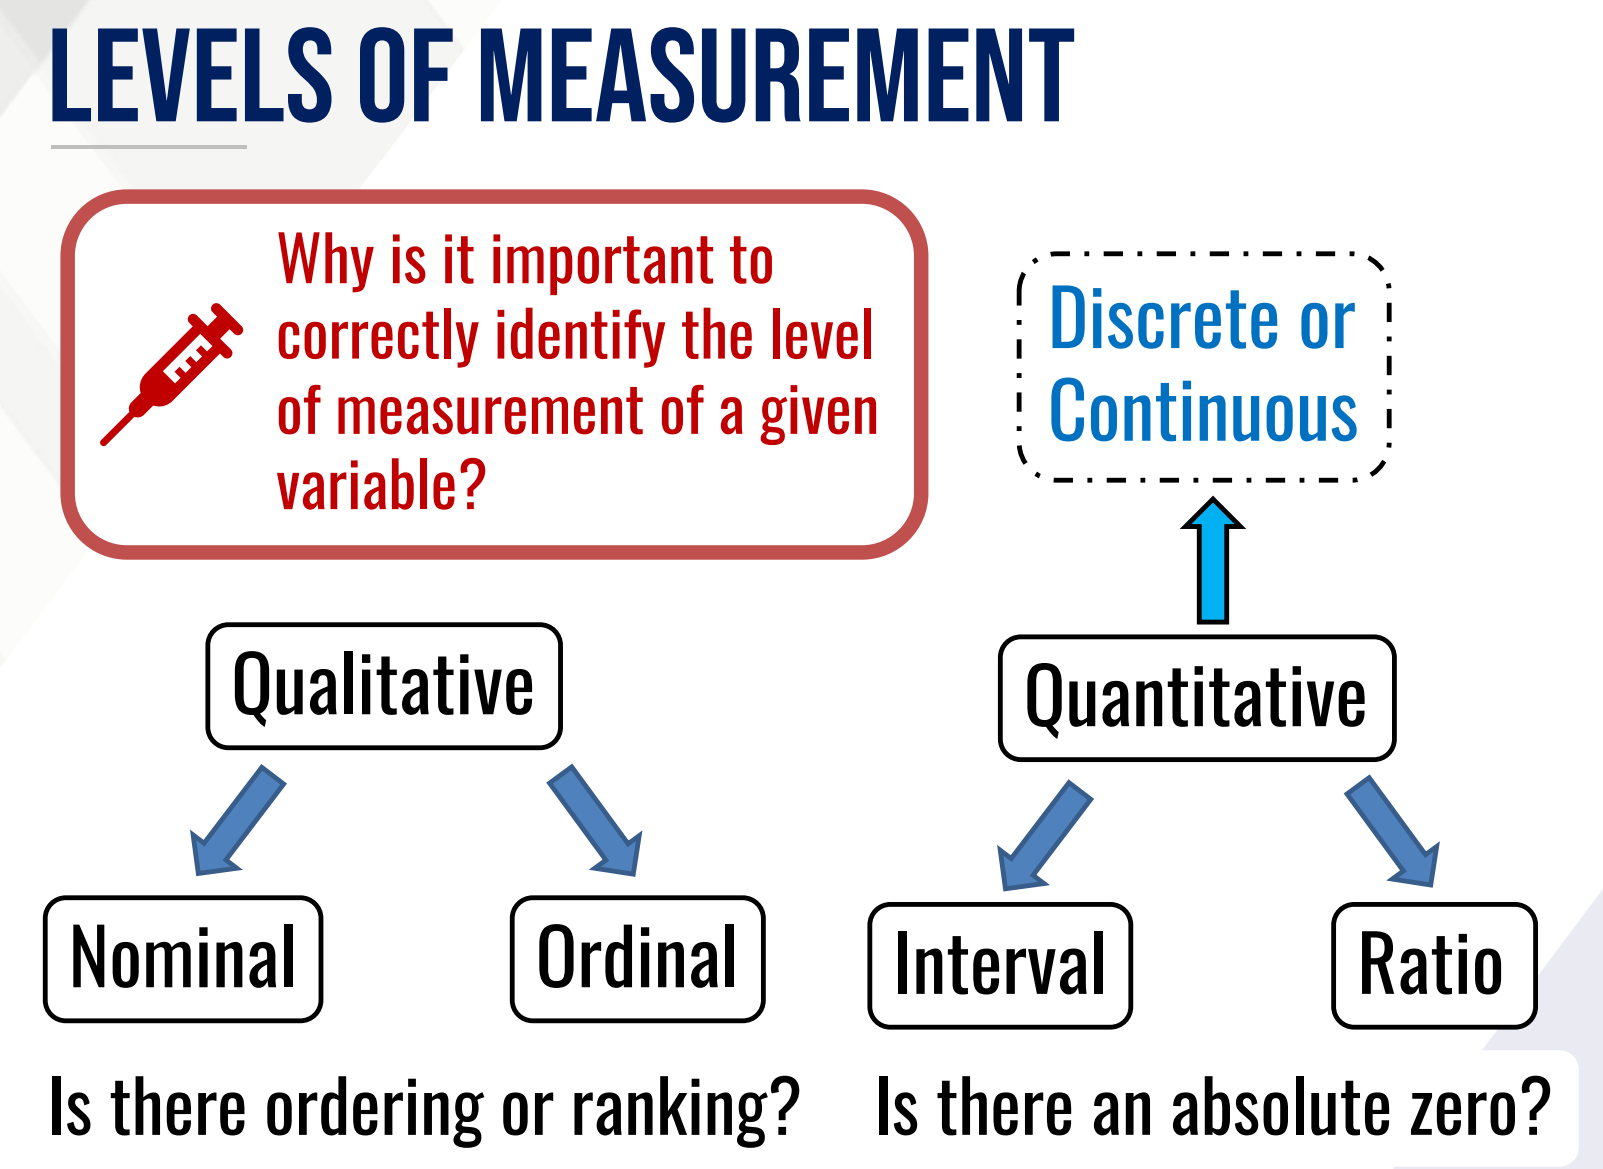
Quantitative or Qualitative
Discrete or Continuous
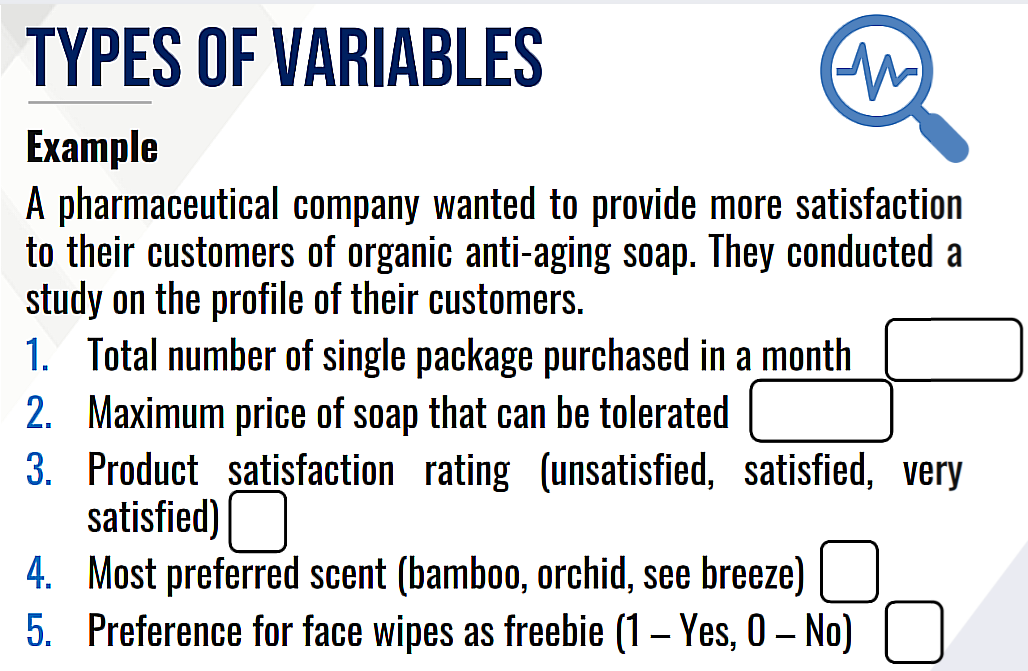
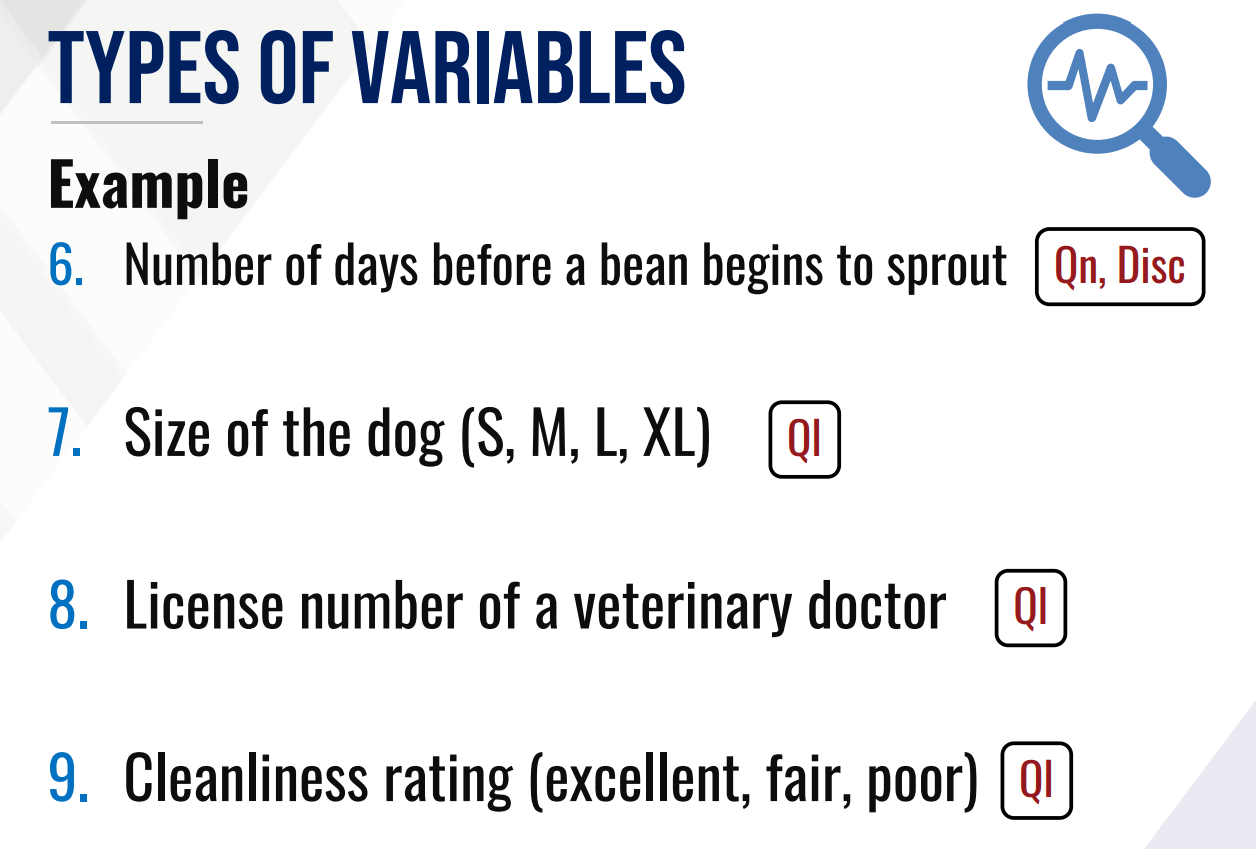
Quantitative or Qualitative
Discrete or Continuous
NOMINAL
It is the lowest level of measurement which involves data collected as labels, names or categories.
ORDINAL
It is nominal data but with implied ordering or ranking.
INTERVAL
It is quantitative data that lacks an absolute zero point that can be ordered or ranked
RATIO
it is the highest level having all properties of the interval scale but with absolute zero point
qualitative; quantitative
nominal and ordinal are ___________ while interval and ratio are ____________
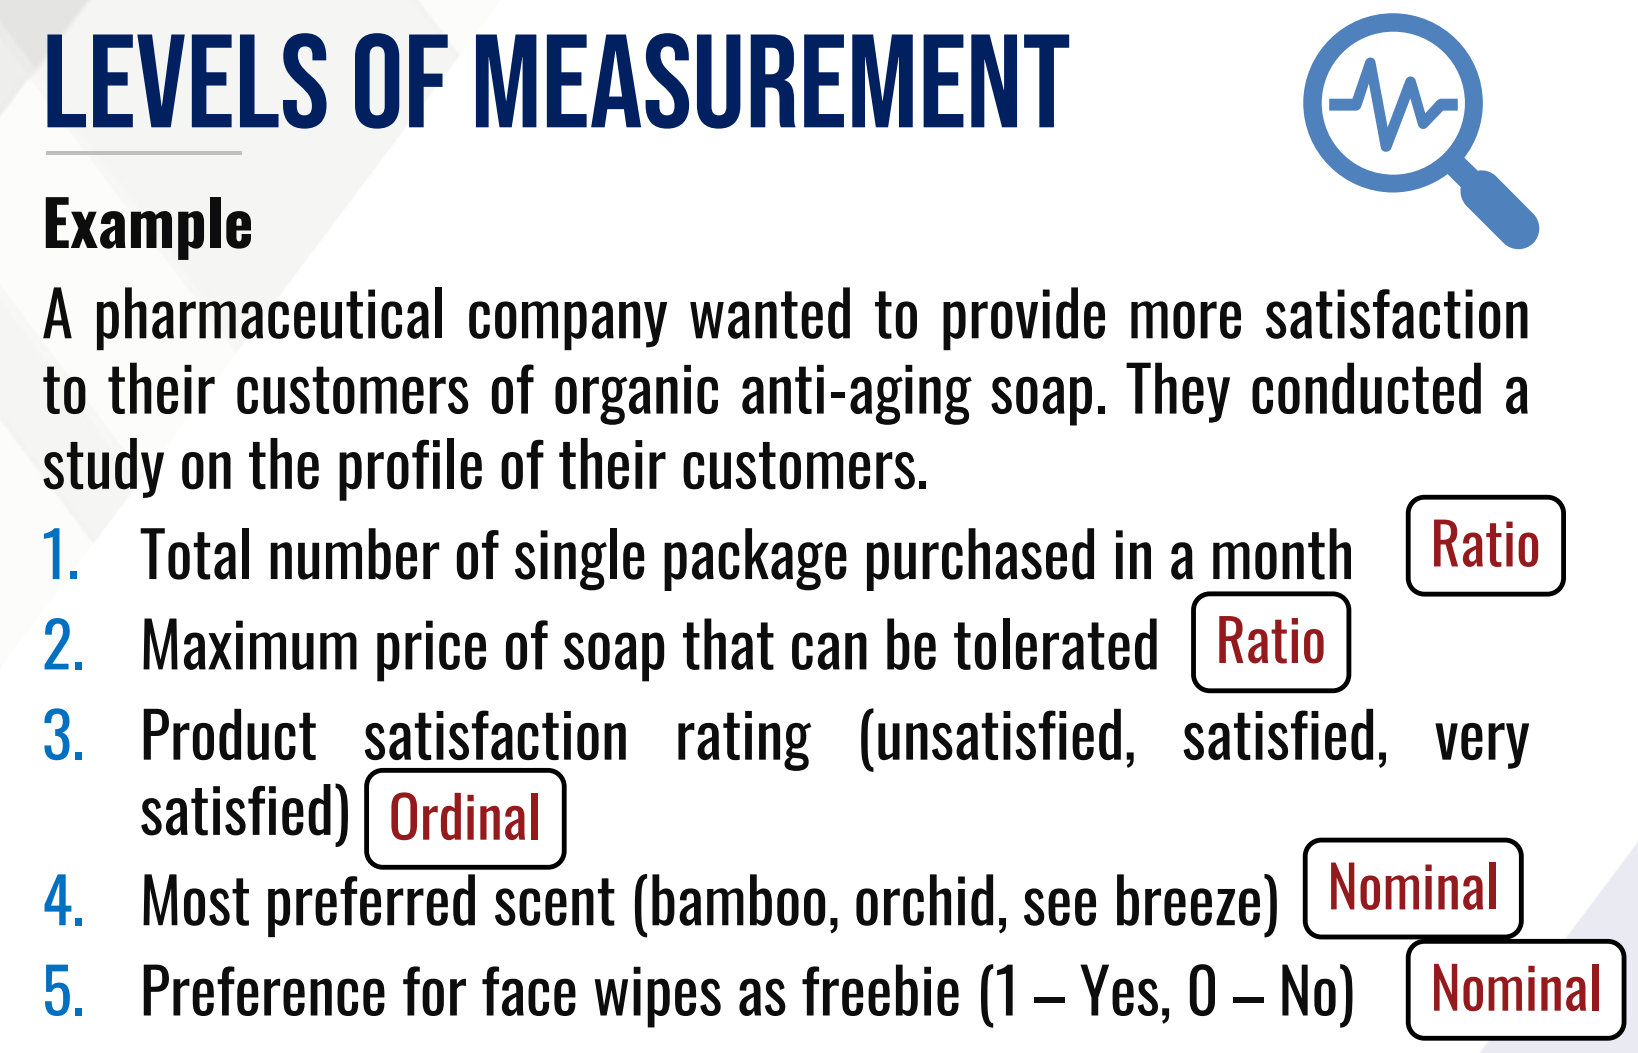
NOMINAL, ORDINAL, INTERVAL, RATIO
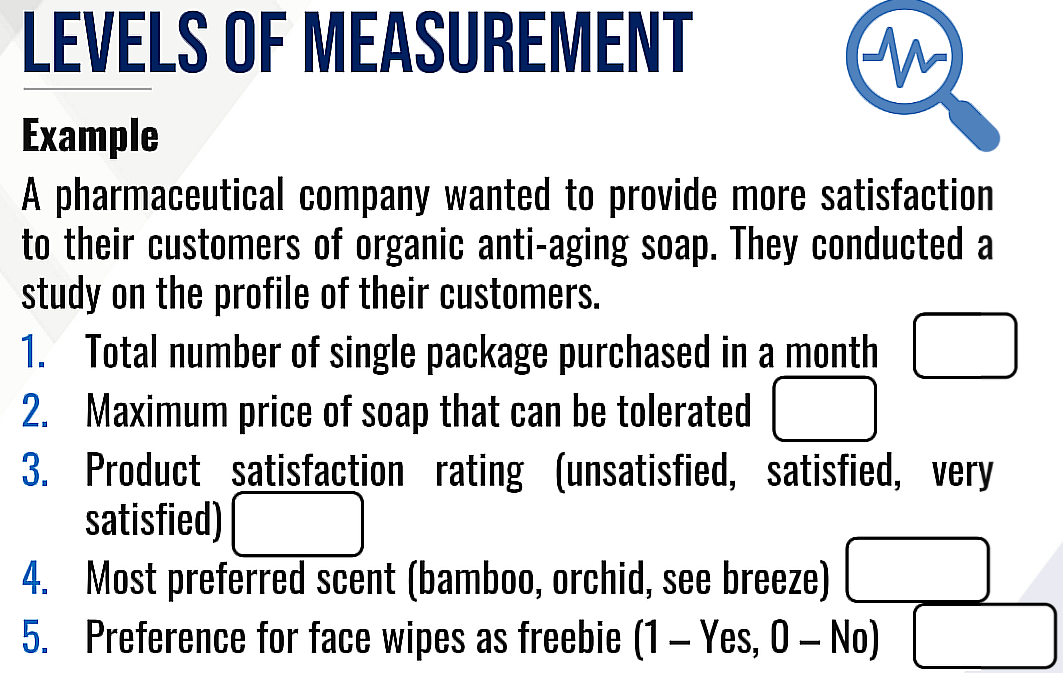
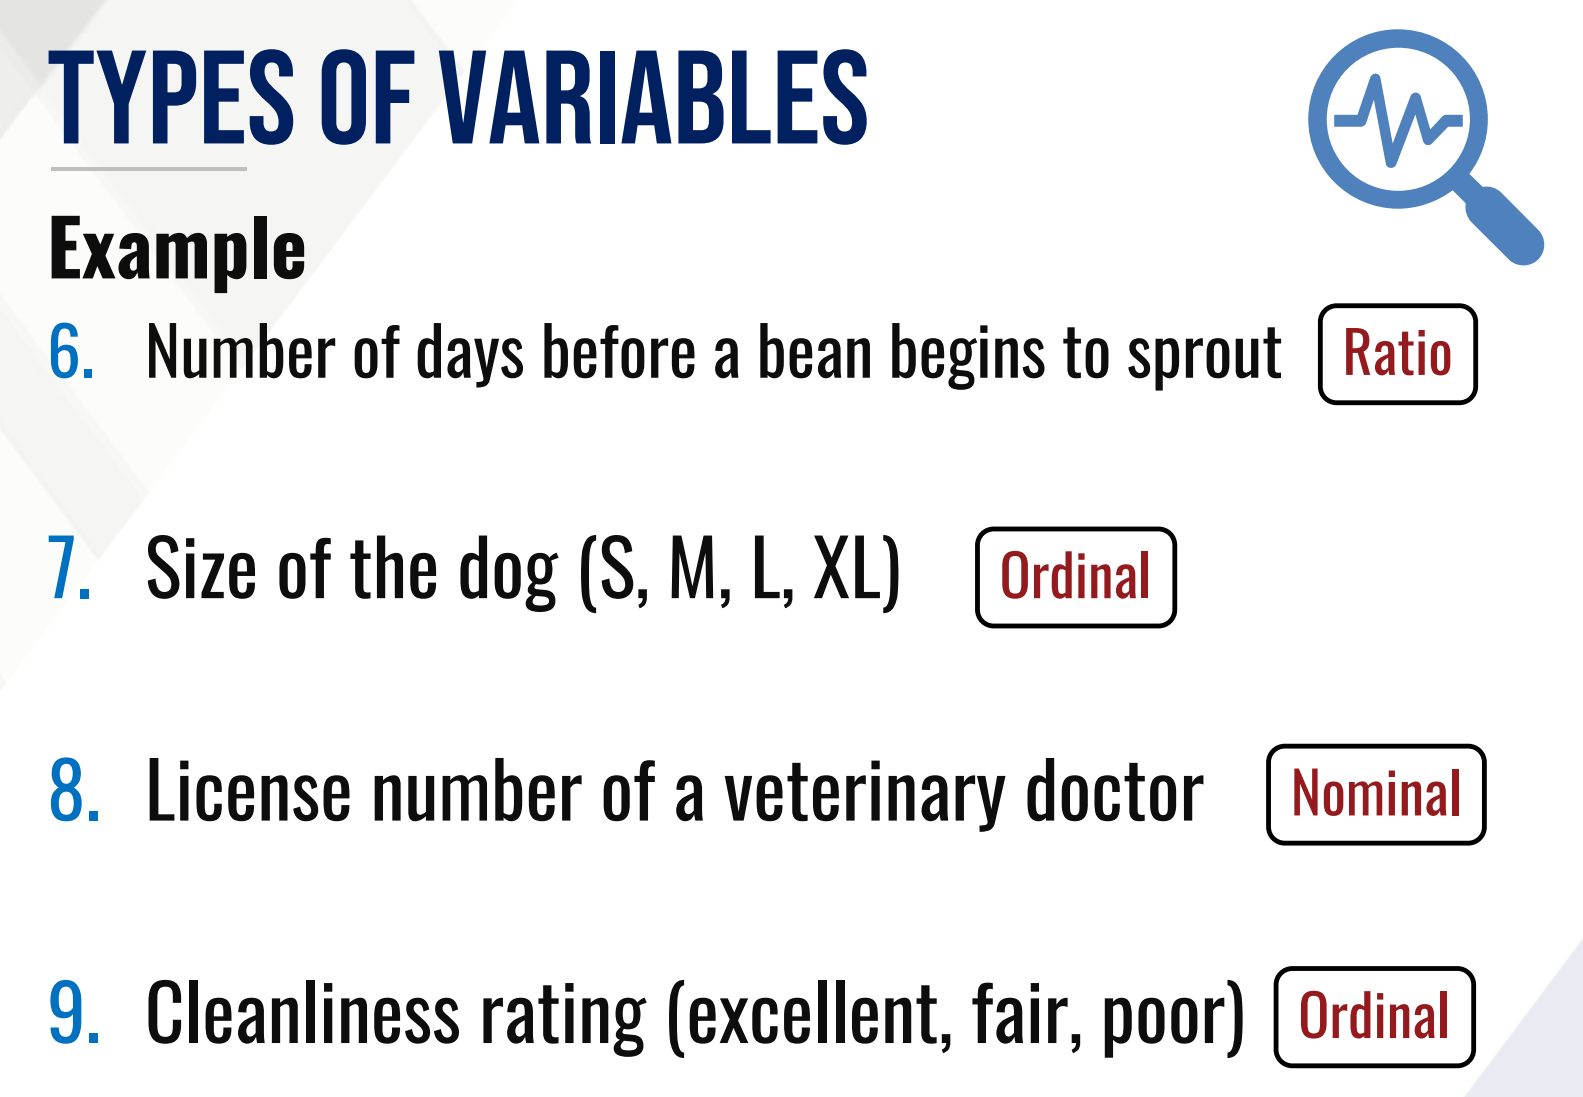
NOMINAL, ORDINAL, INTERVAL, RATIO
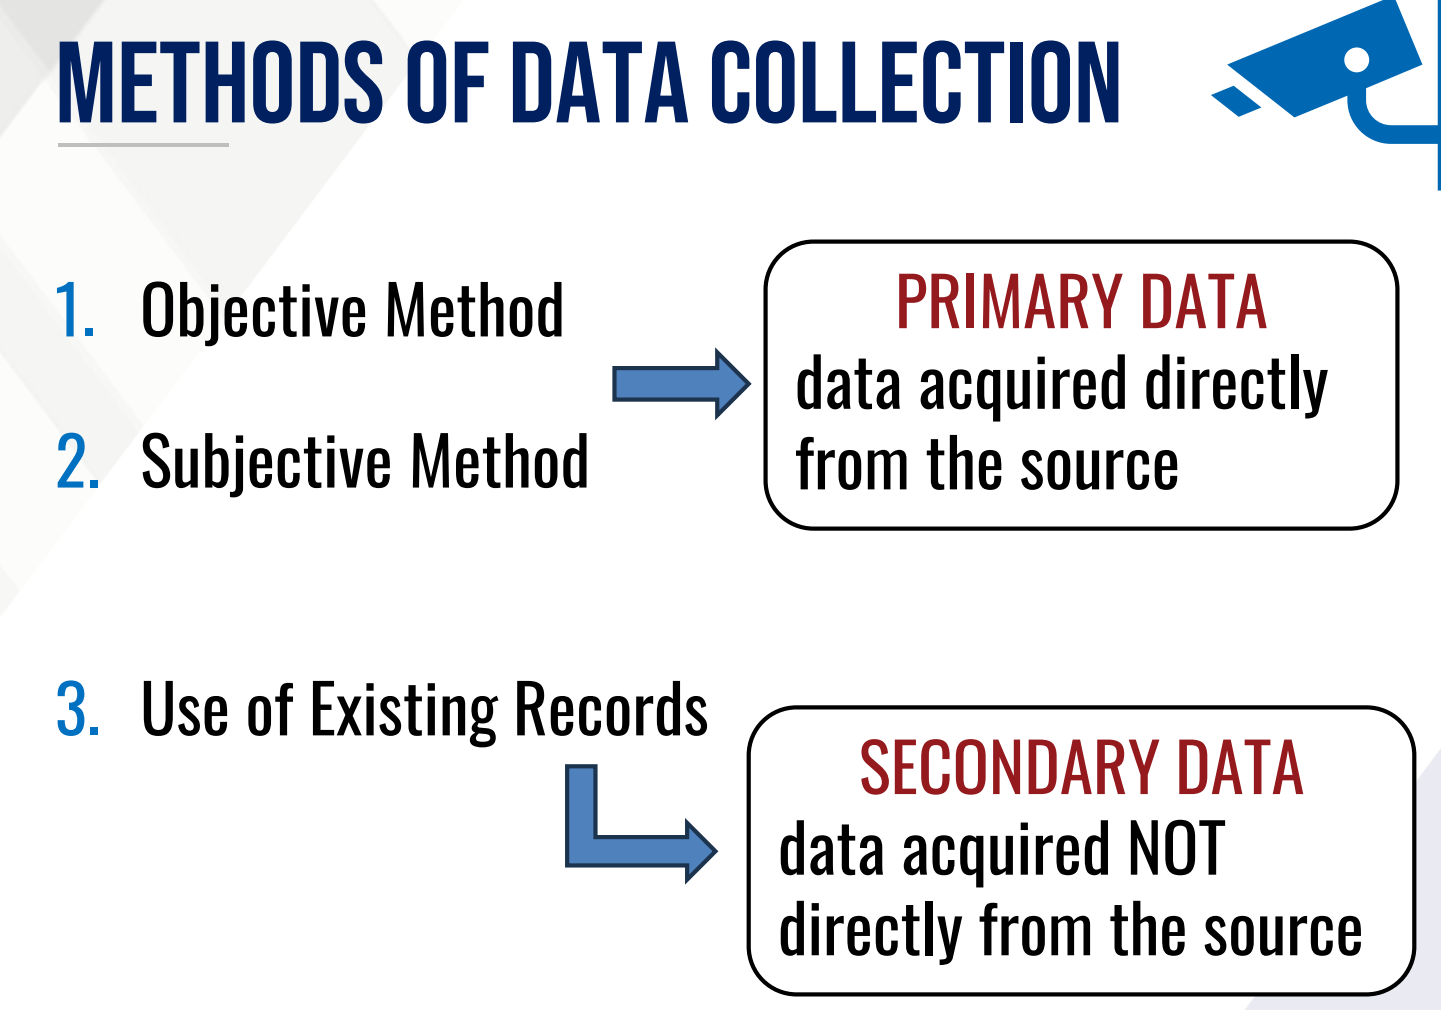
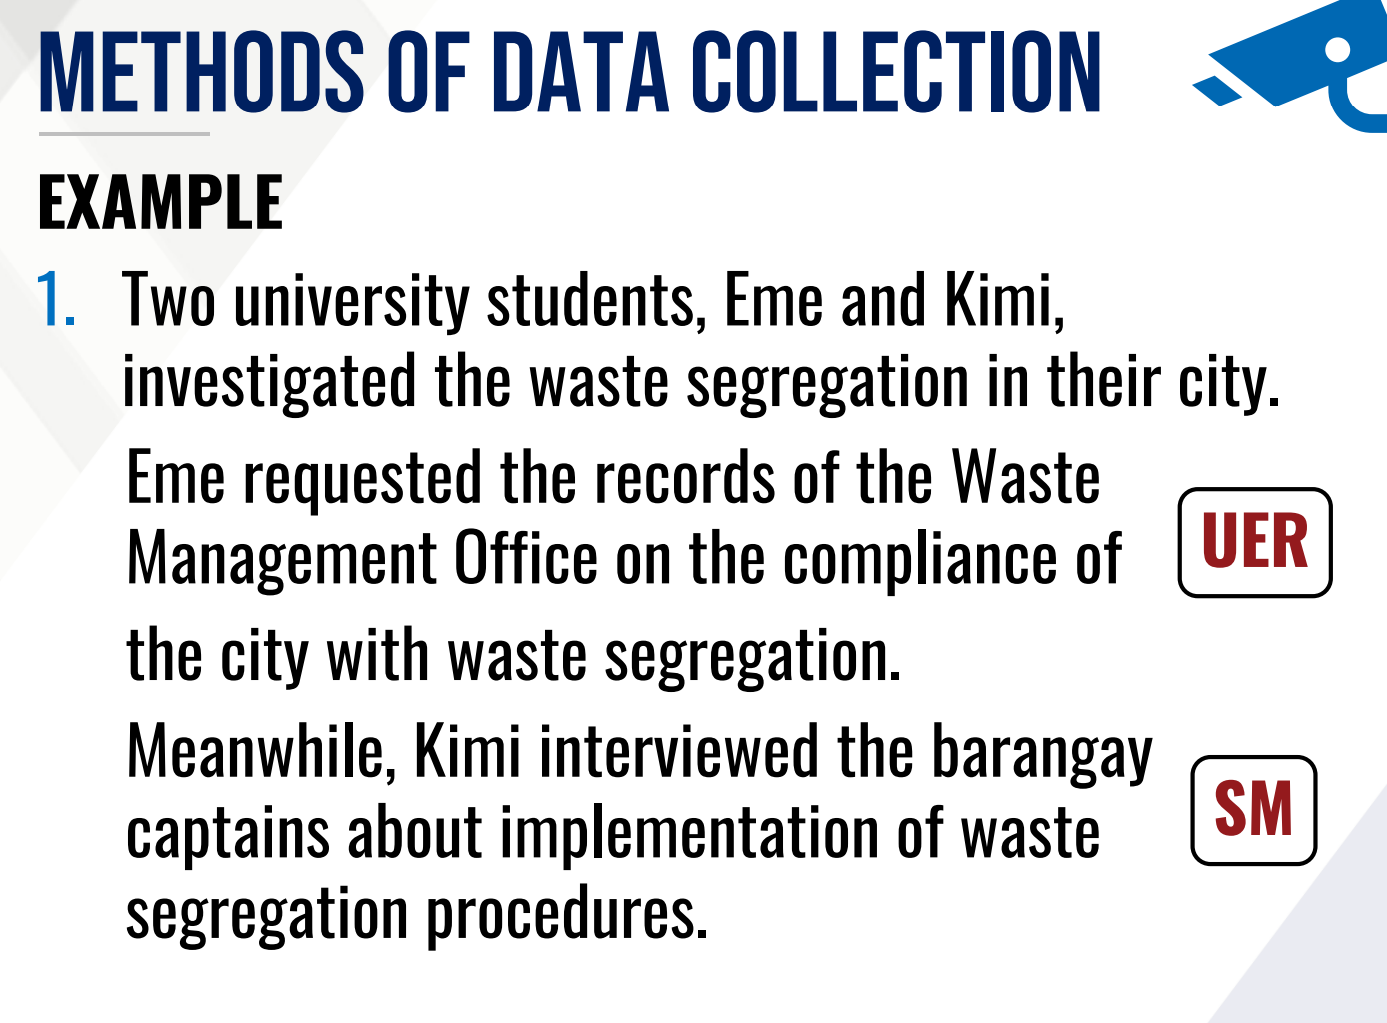
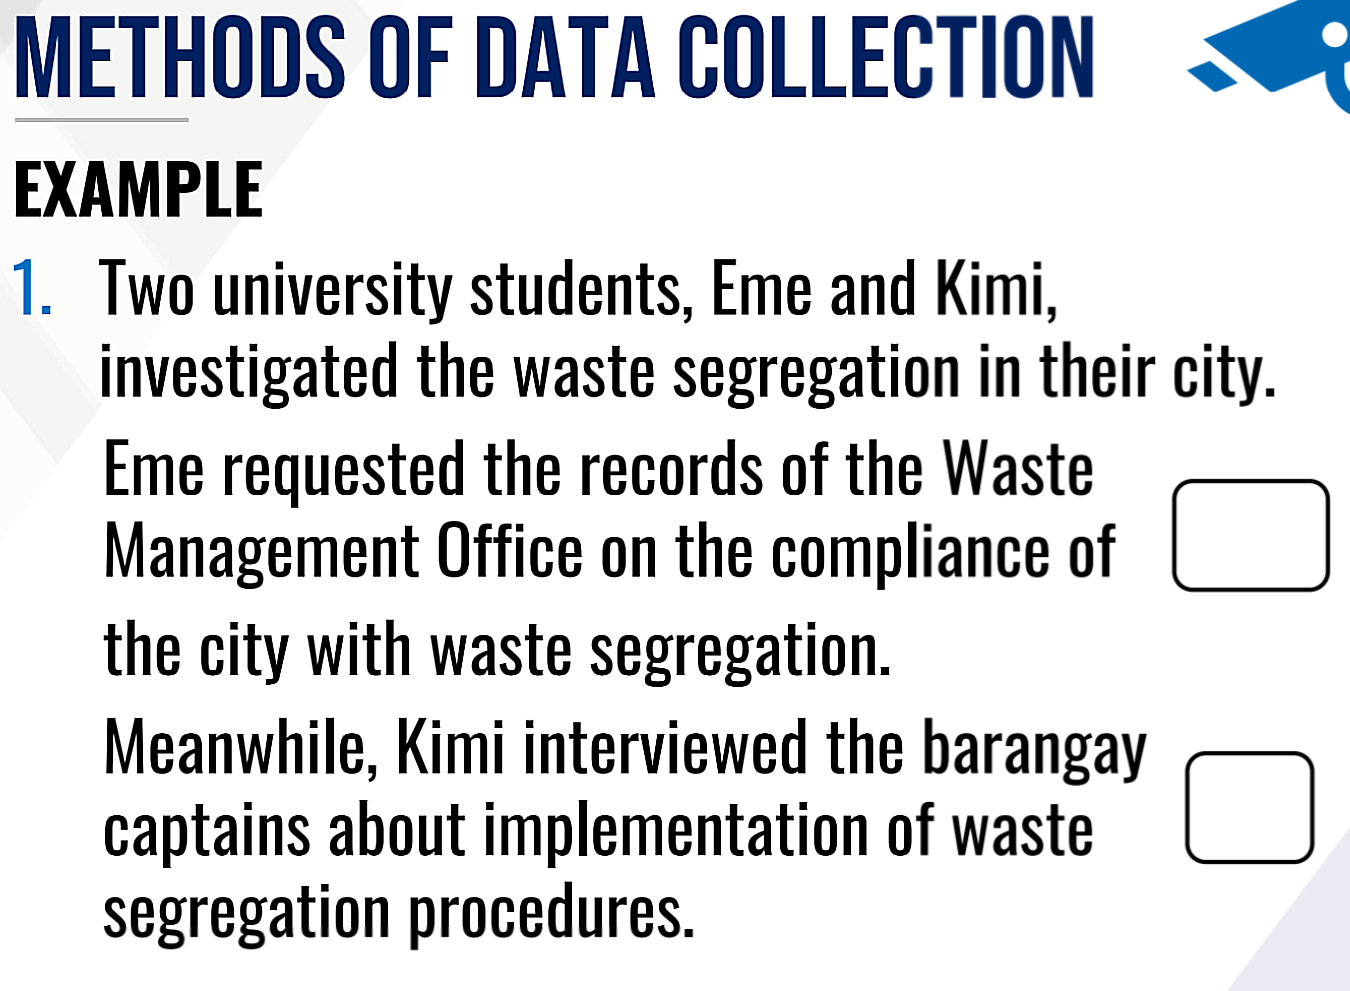
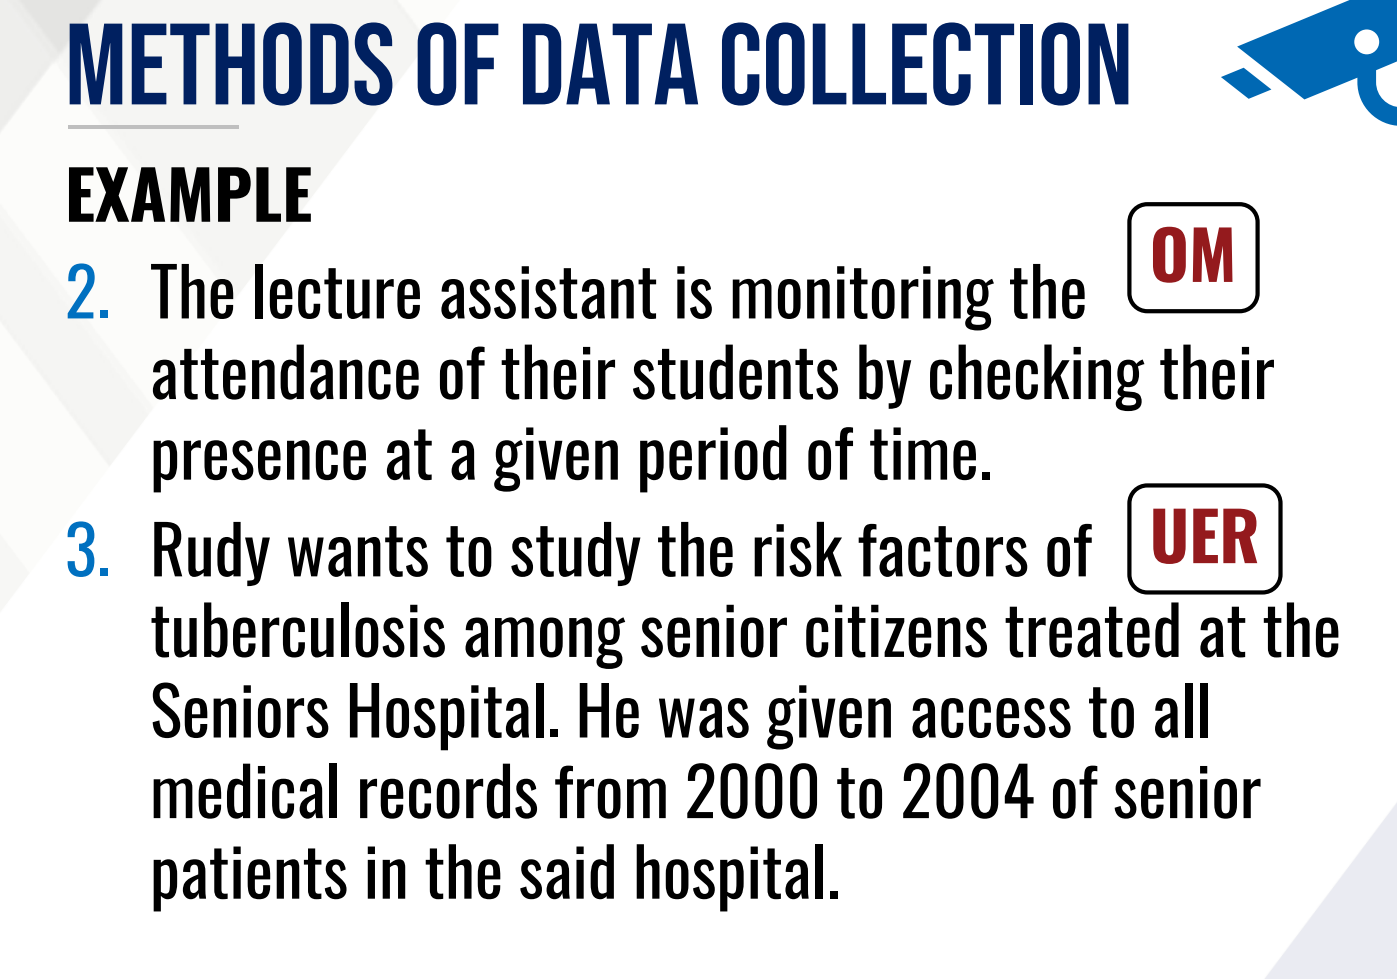
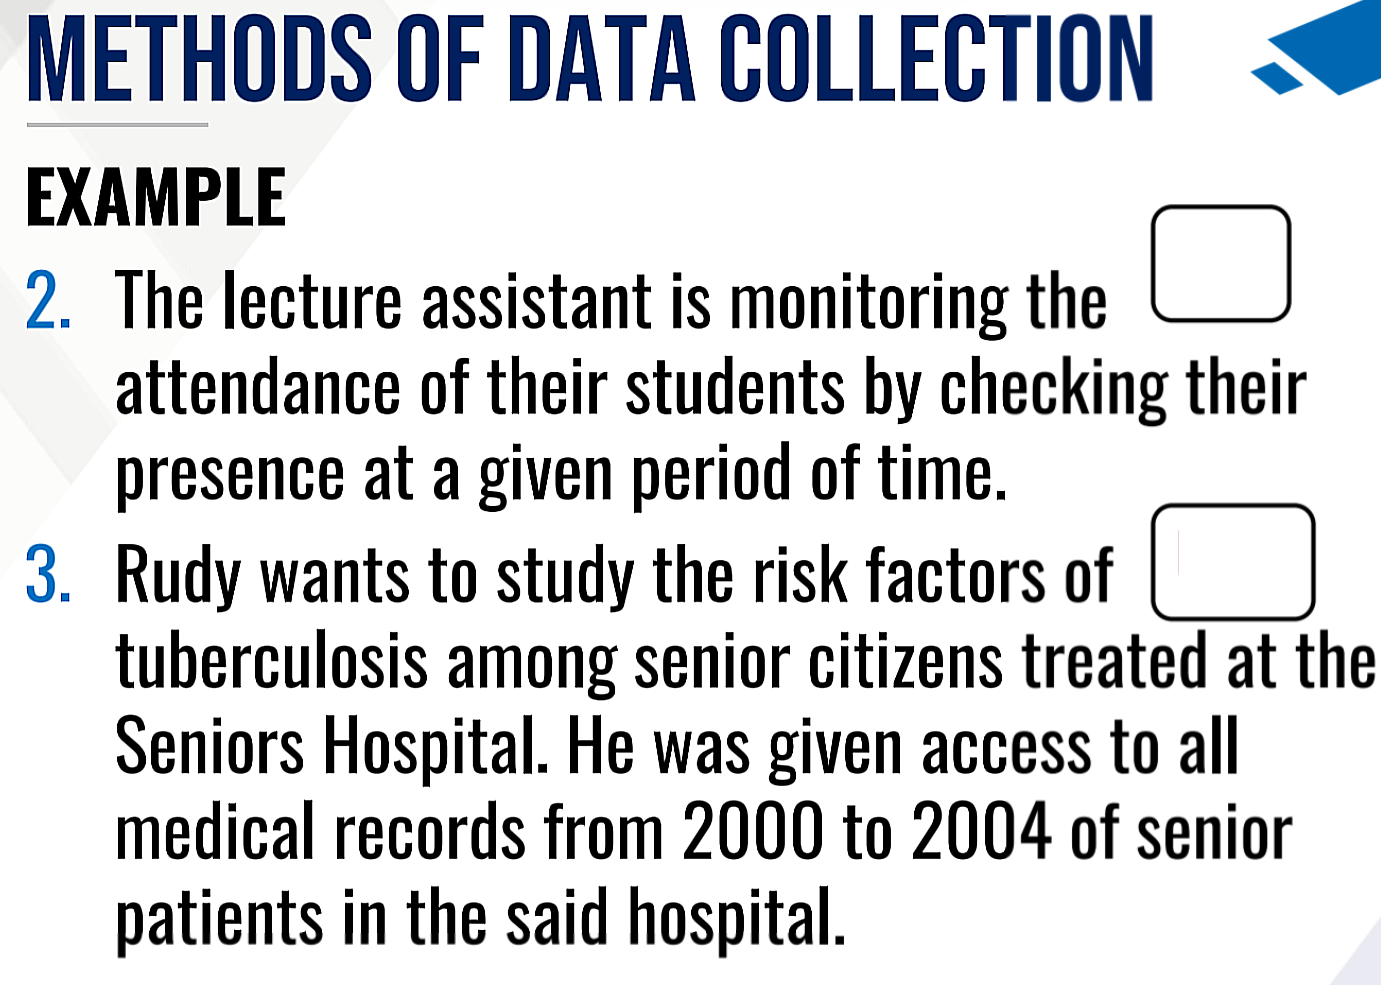
Objective Method
METHODS OF DATA COLLECTION
This data is collected through measurement, counting or by actual observation
Subjective Method
METHODS OF DATA COLLECTION
This data is provided by identified respondents
Use of Existing Records
METHODS OF DATA COLLECTION
This data was previously collected by another person or institution for some other purposes
Textual Presentation
METHODS OF DATA PRESENTATION
This gives highlights of information through a narrative description of the collected data
Tabular Presentation
METHODS OF DATA PRESENTATION
The data is organized into rows and columns and information are found in table cells
Graphical Presentation
METHODS OF DATA PRESENTATION
This provides visual presentation of the properties or trends of the data
Infographics
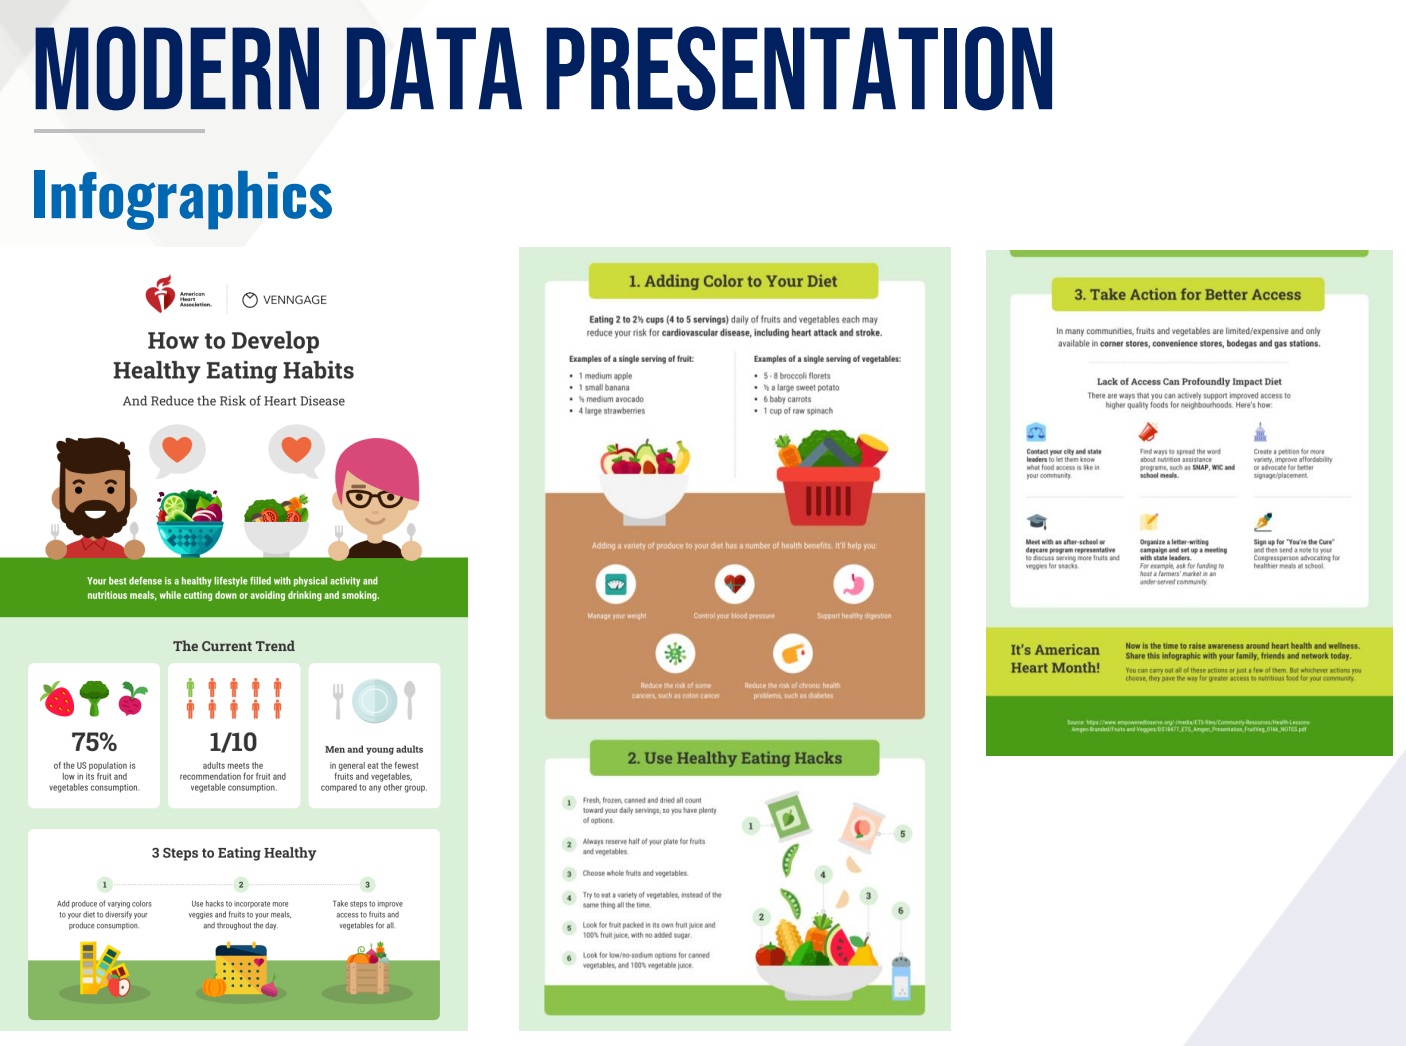
MODERN DATA PRESENTATION
This is a collection of imagery and data visualization preferably with minimal text that gives easy-to-understand overview of a topic
Data Storytelling
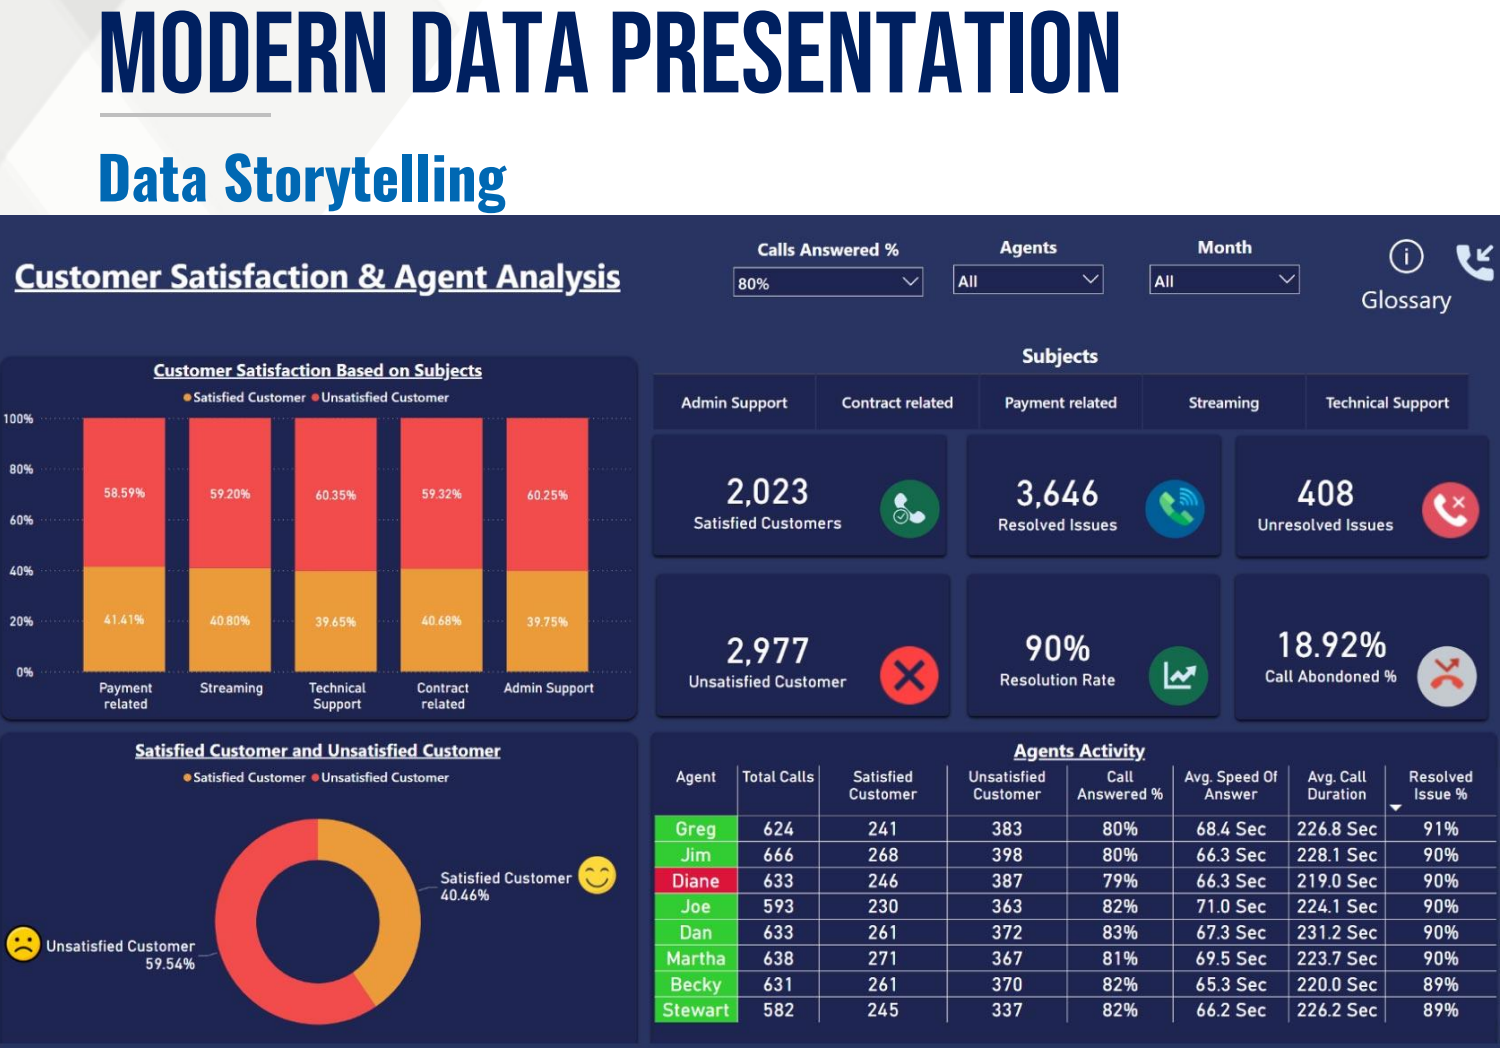
MODERN DATA PRESENTATION
This is the concept of building a compelling narrative based on complex data and analytics that help tell a story to a target audience
DESCRIPTIVE MEASURES
These are quantities that are used to summarize the characteristics of a universe or a population
1. Location
2. Dispersion
3. Skewness
4. Kurtosis
What are the types of DESCRIPTIVE MEASURES?
Types of DESCRIPTIVE MEASURES
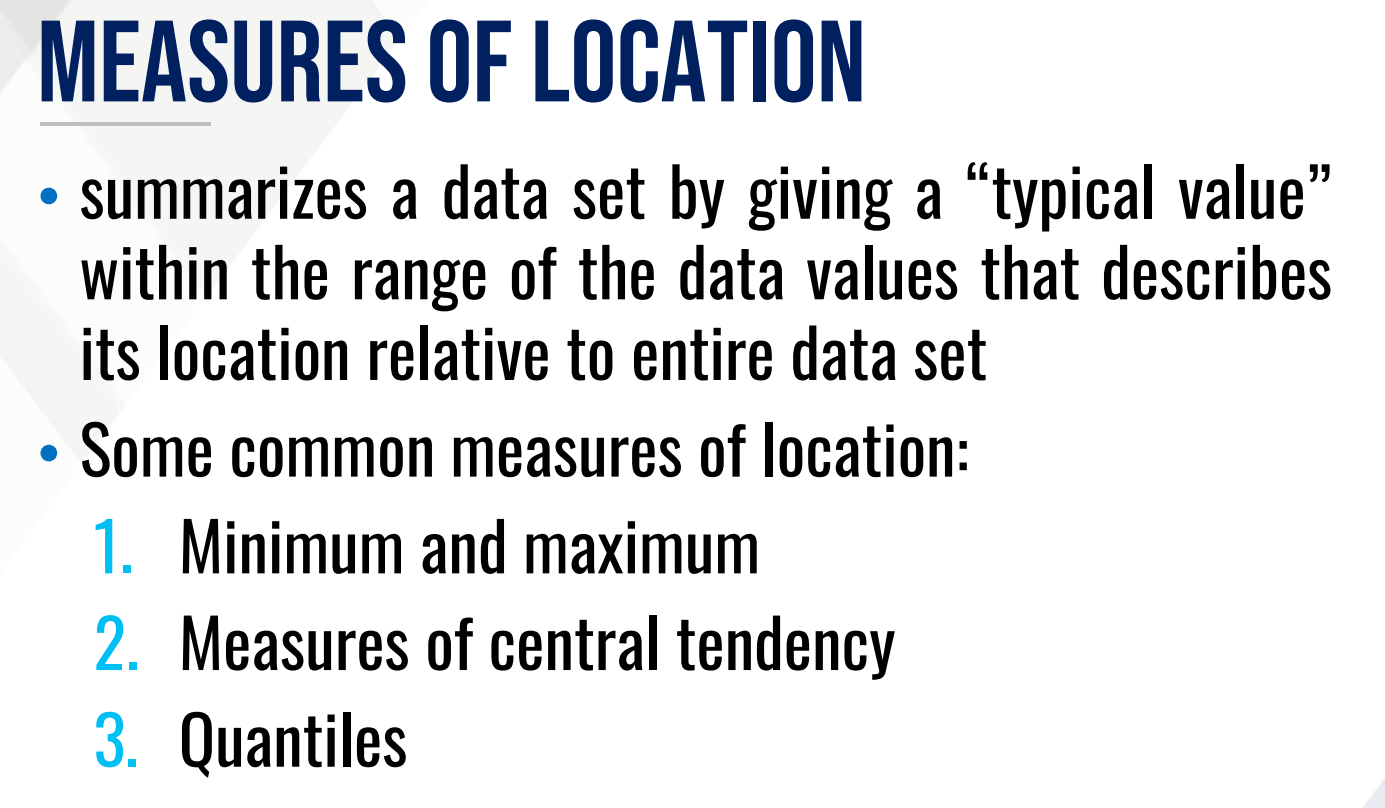
Summarizes a data set by giving a “typical value” within the range of the data values that describes its location relative to the entire data set.
Also, provide the types of this measure.
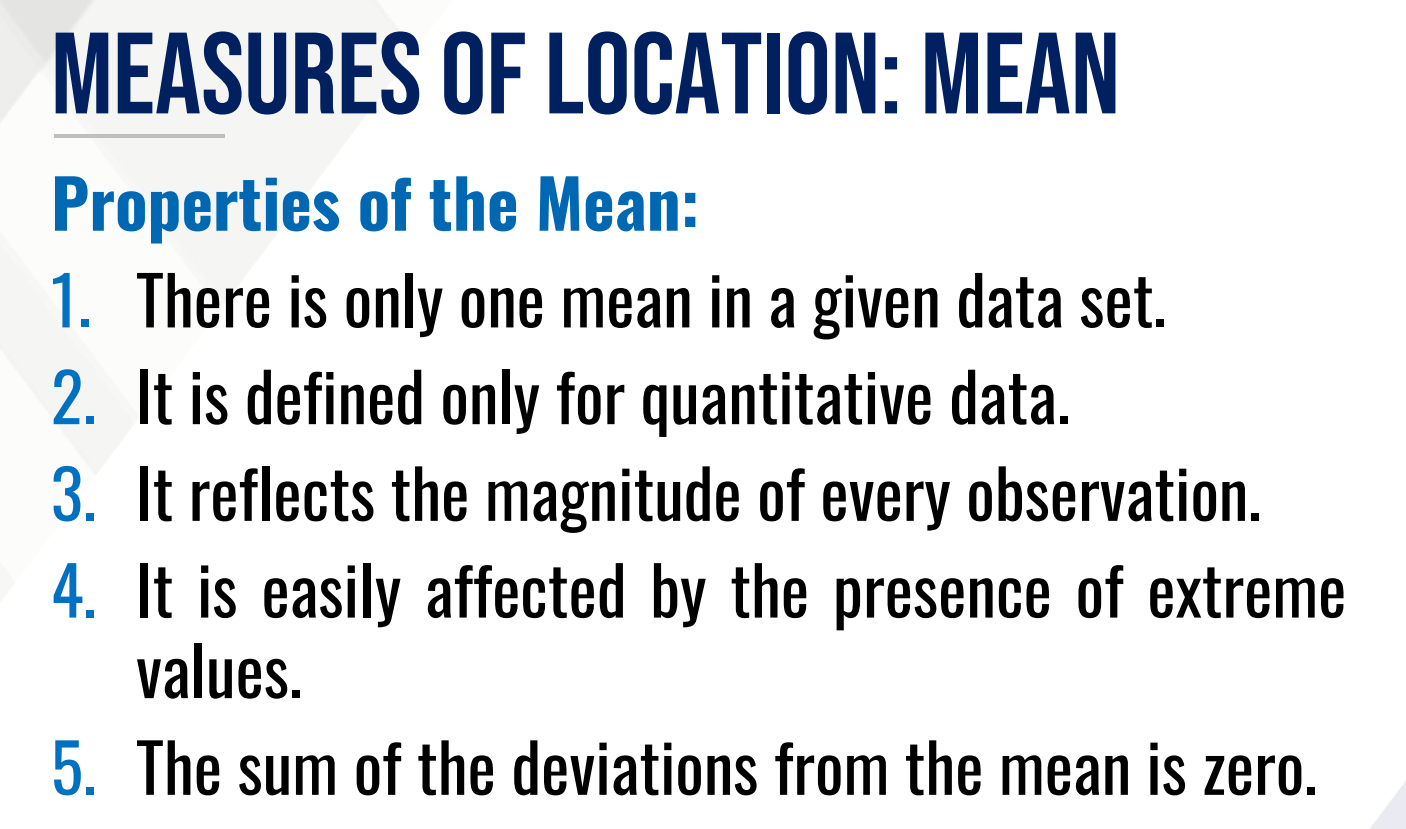
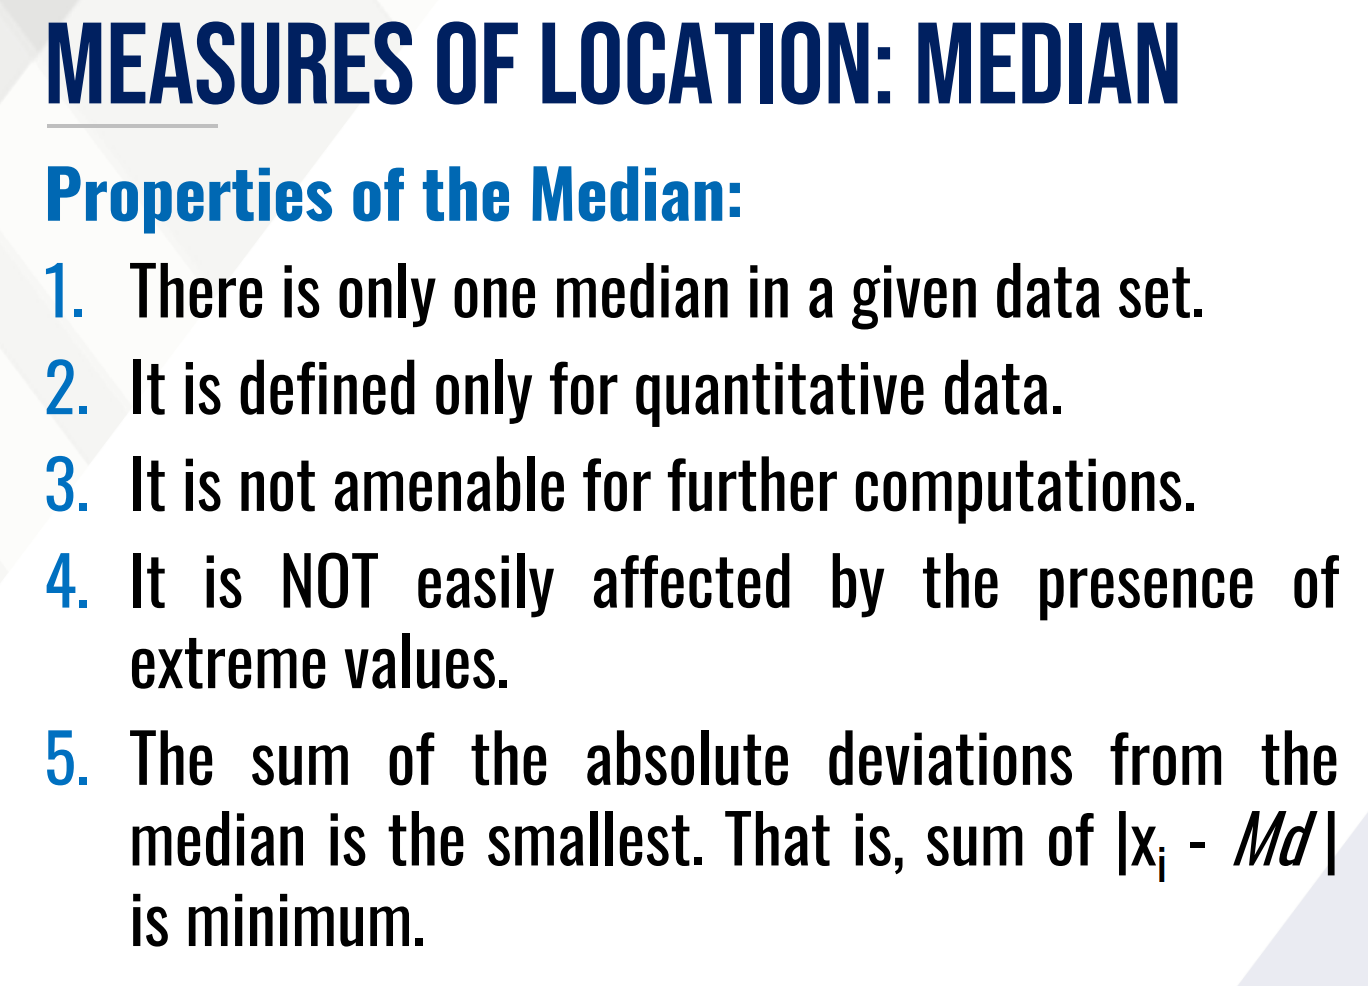
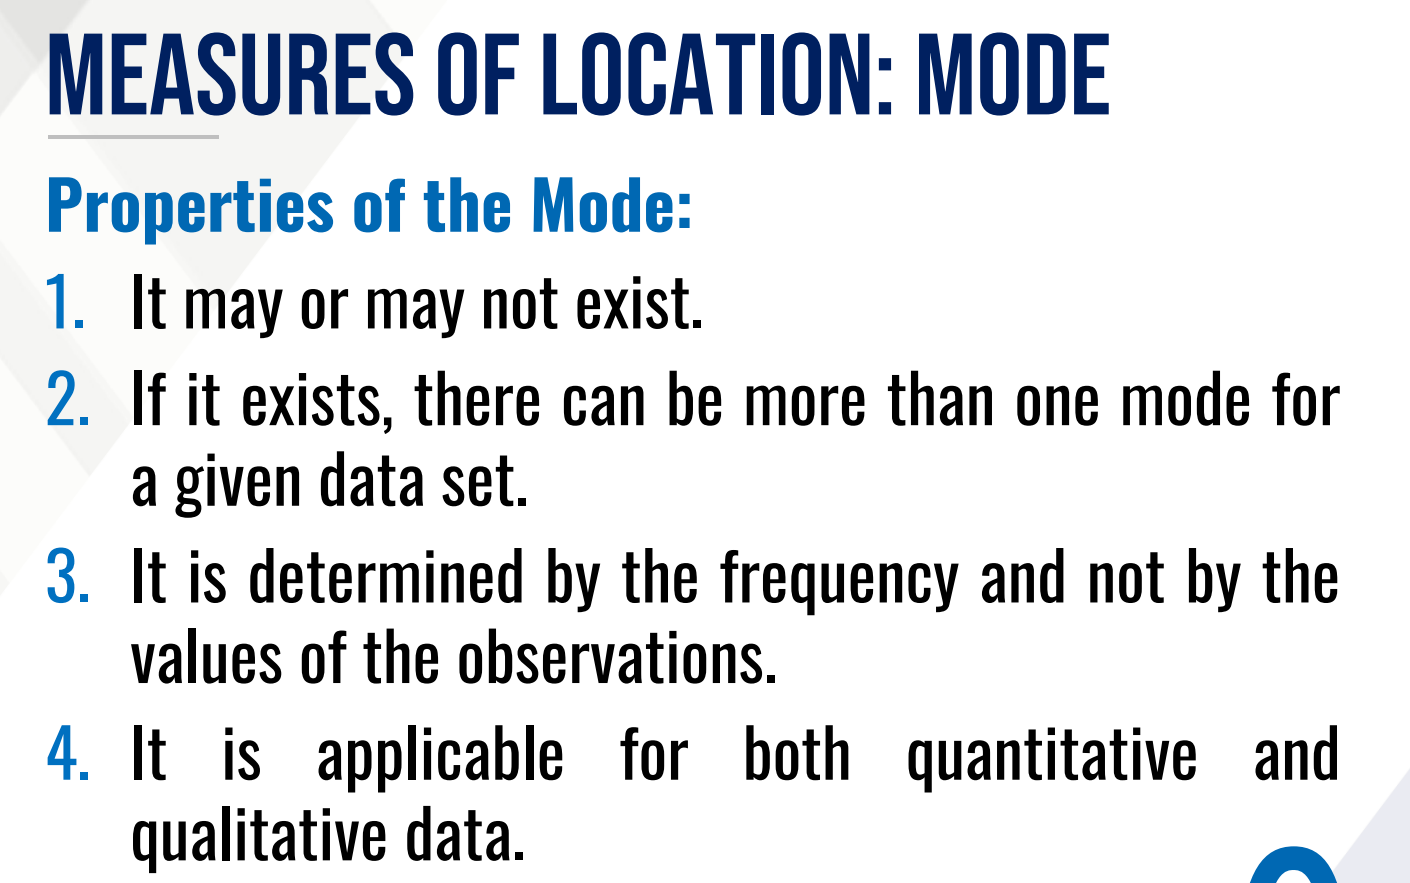
Measures of central tendency (average)
These are values about which the set of observations tend to cluster.
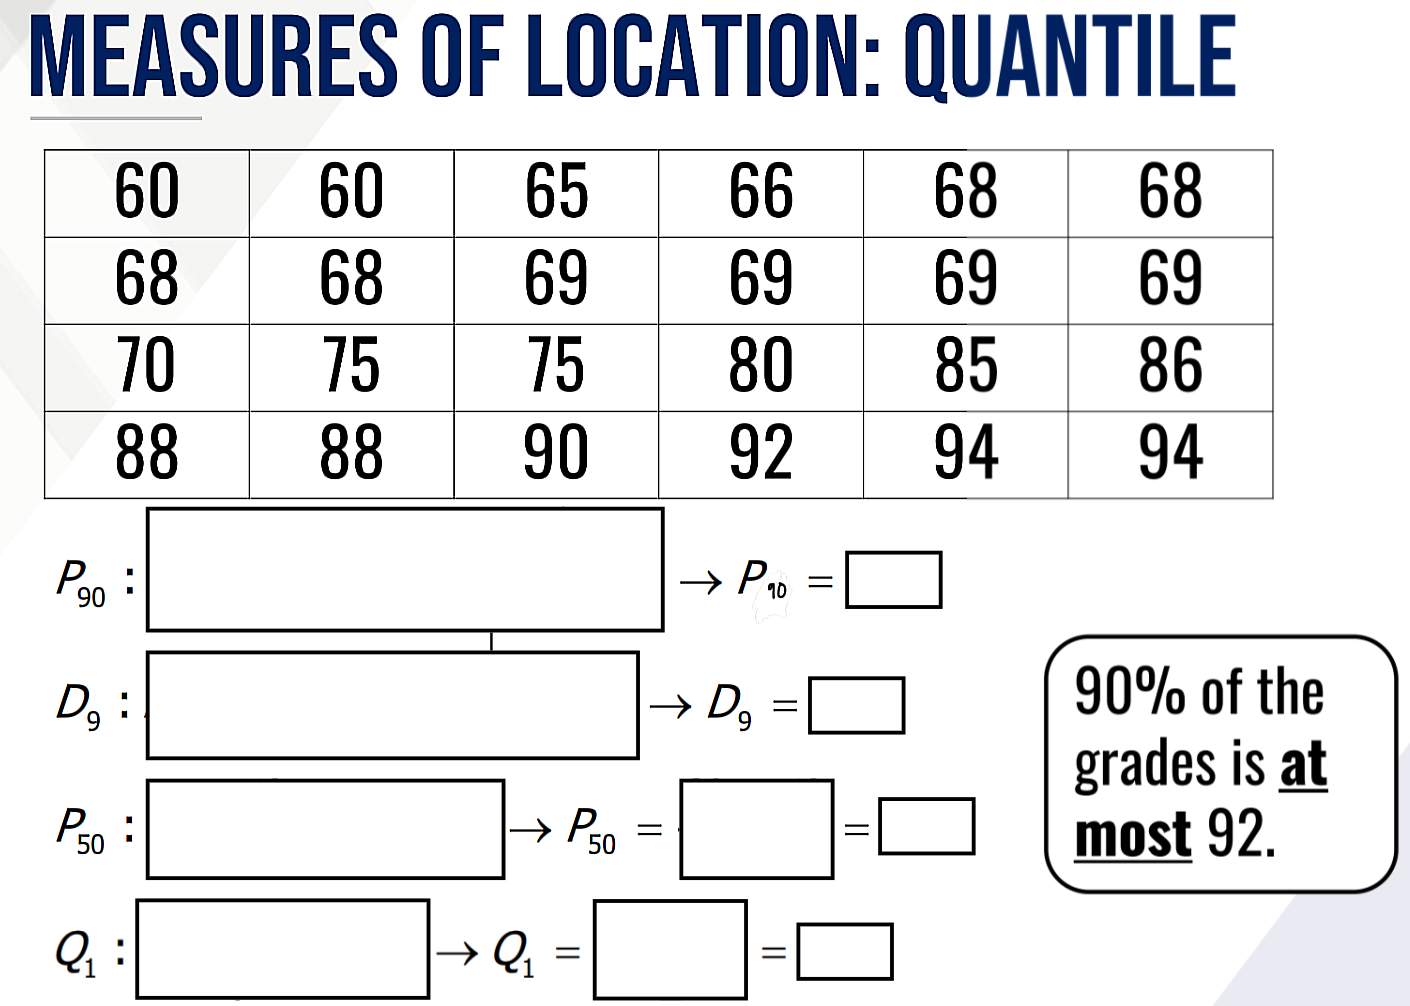
Quantiles
This gives the position of a data value relative to the entire data set.
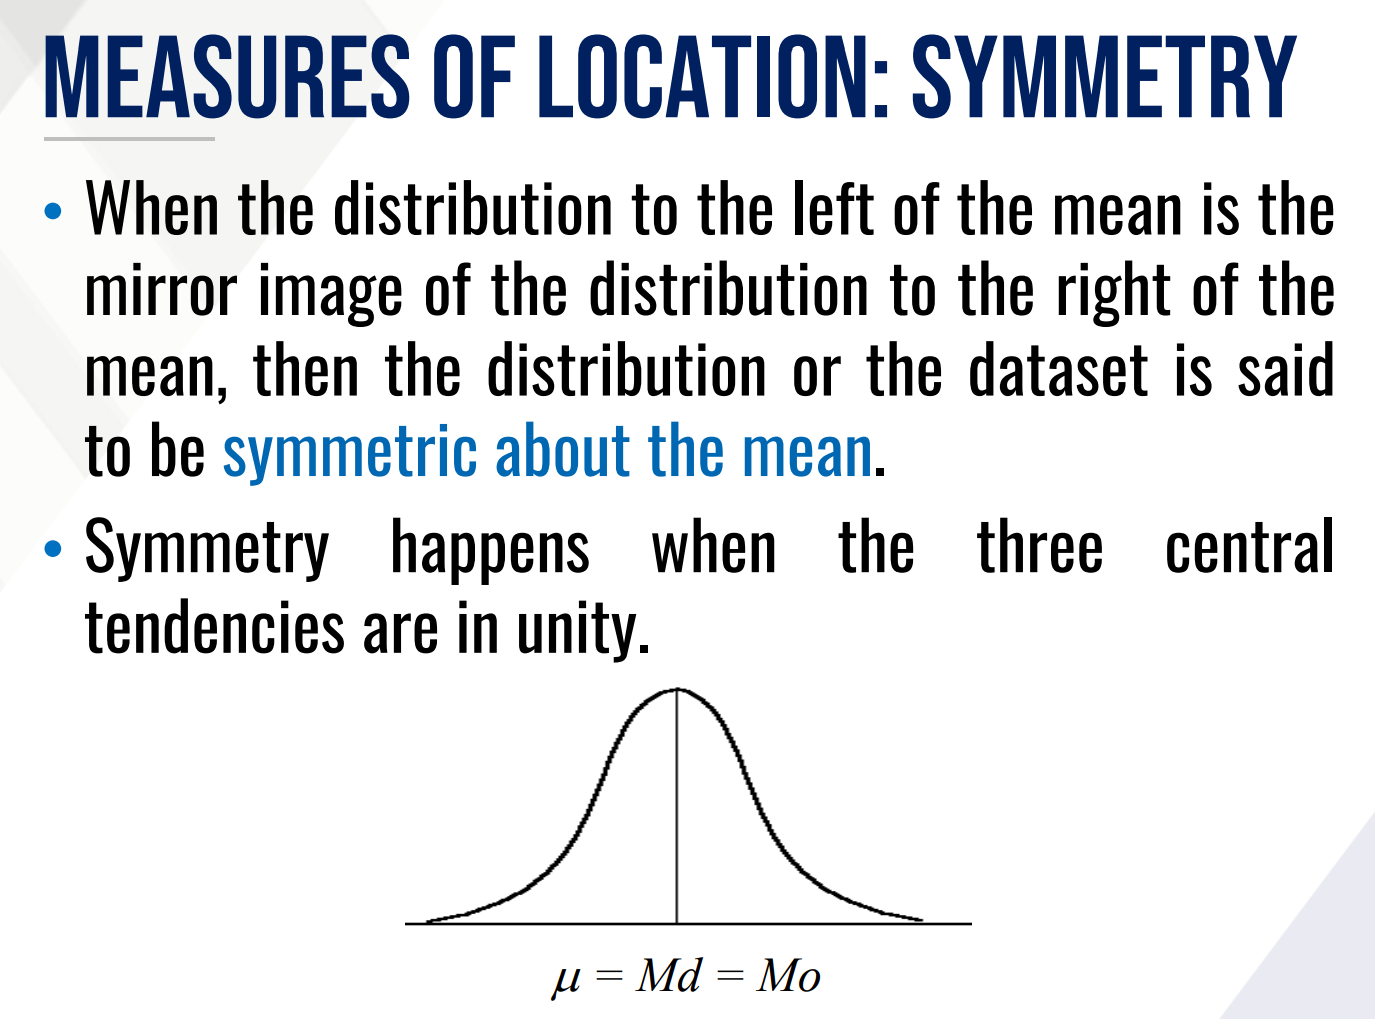
When the distribution to the left of the mean is the mirror image of the distribution to the right of the mean, then the distribution or the dataset is said to be _____________.
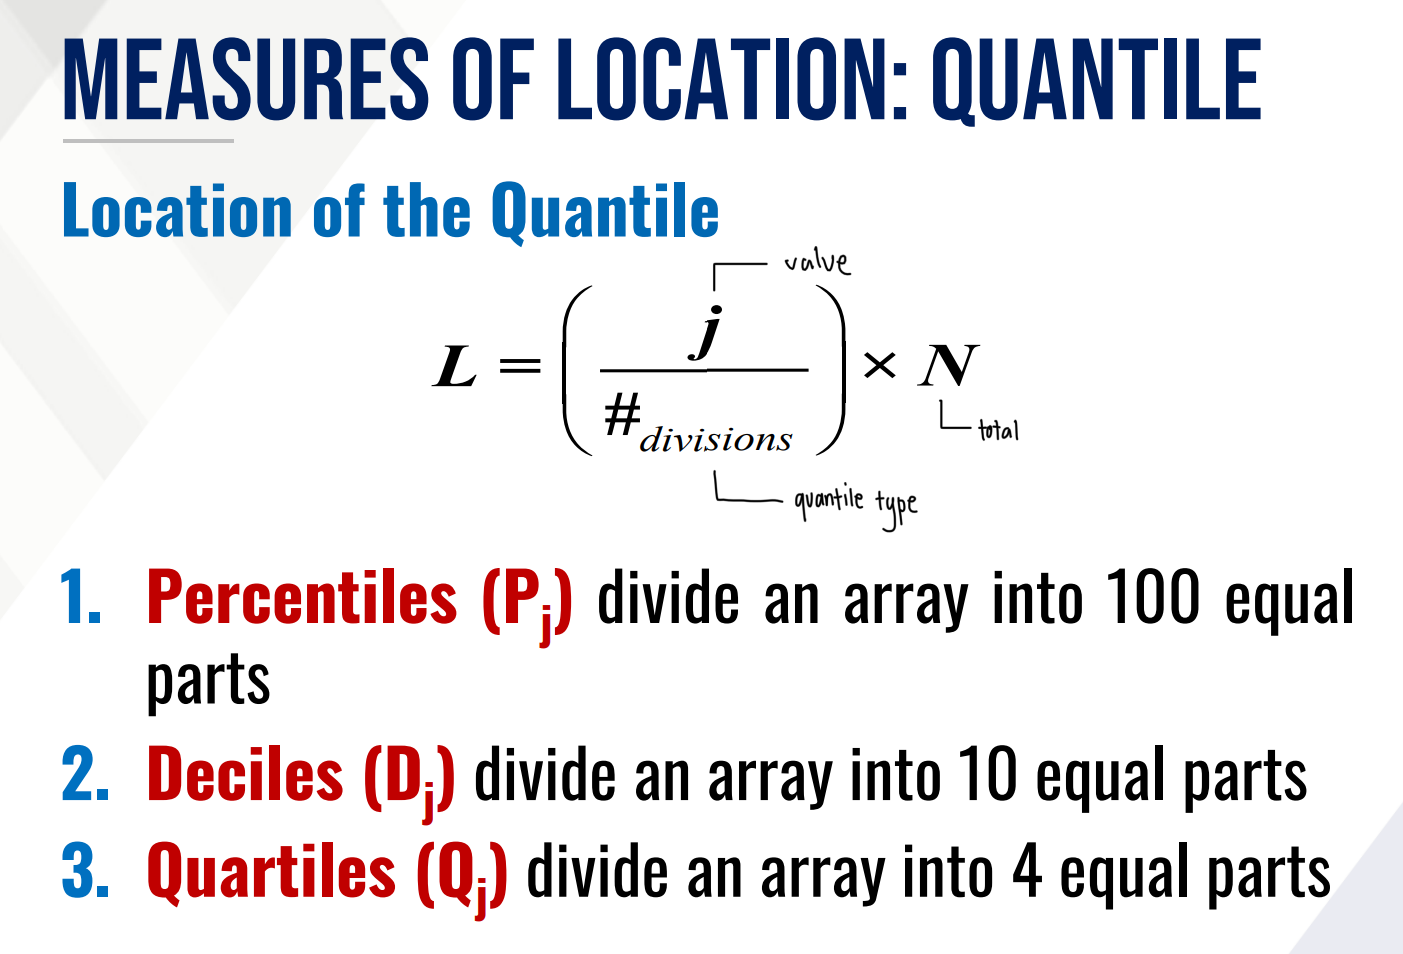
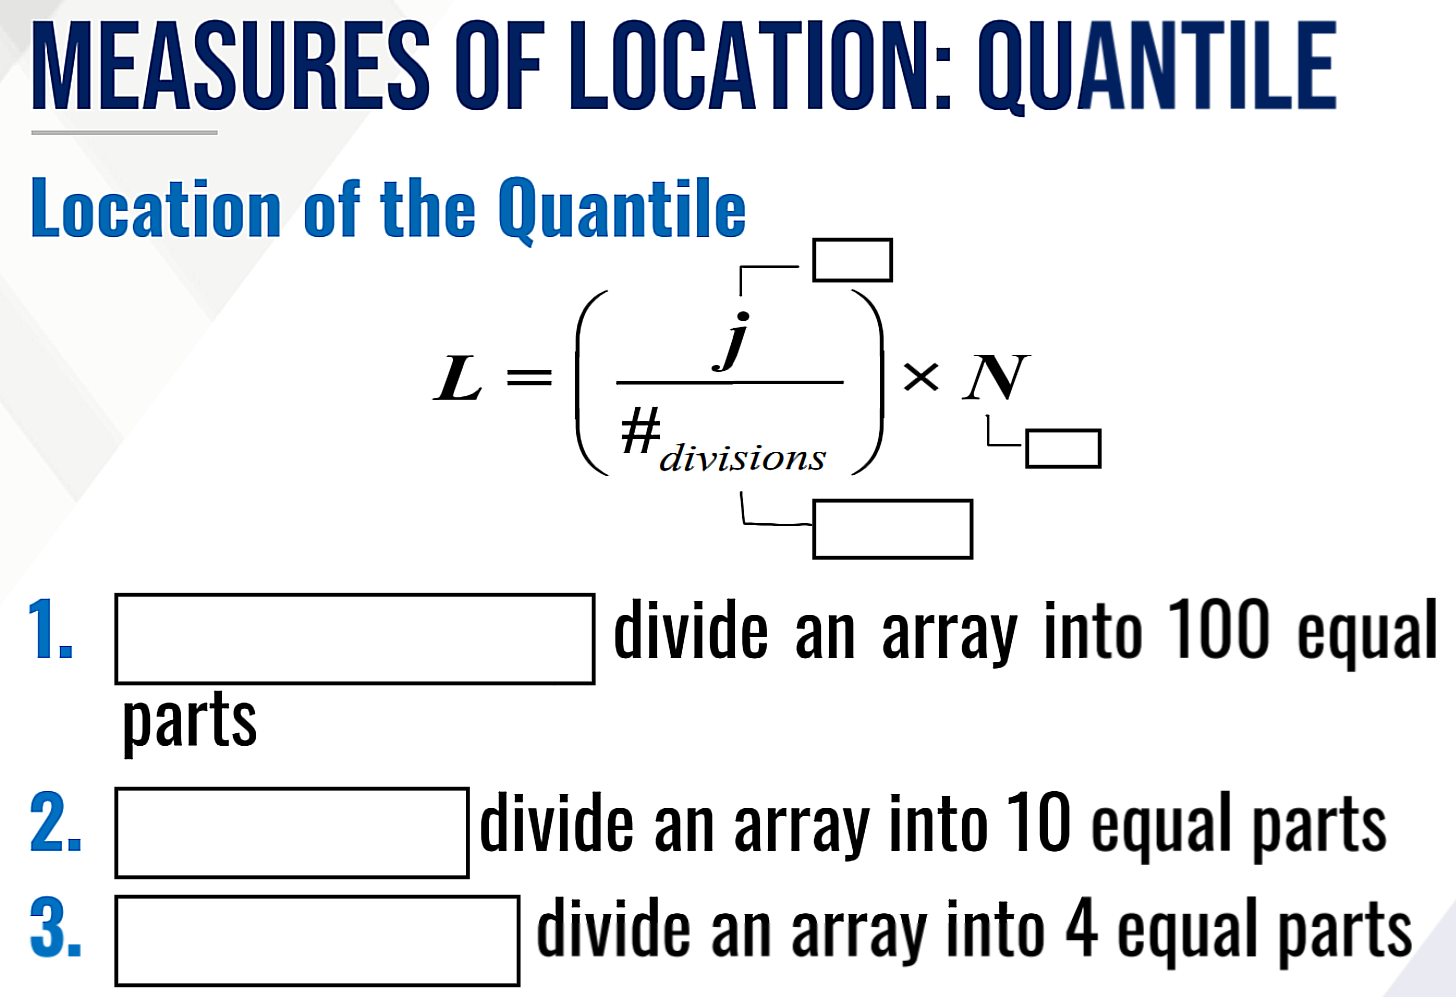
What is the formula for location of the quantile?
MEASURES OF DISPERSION
Types of DESCRIPTIVE MEASURES
These are quantities that describe the spread or variability of the observations in a given data set
MEASURES OF DISPERSION
Types of DESCRIPTIVE MEASURES
The higher the value, the greater the variability in the data set.
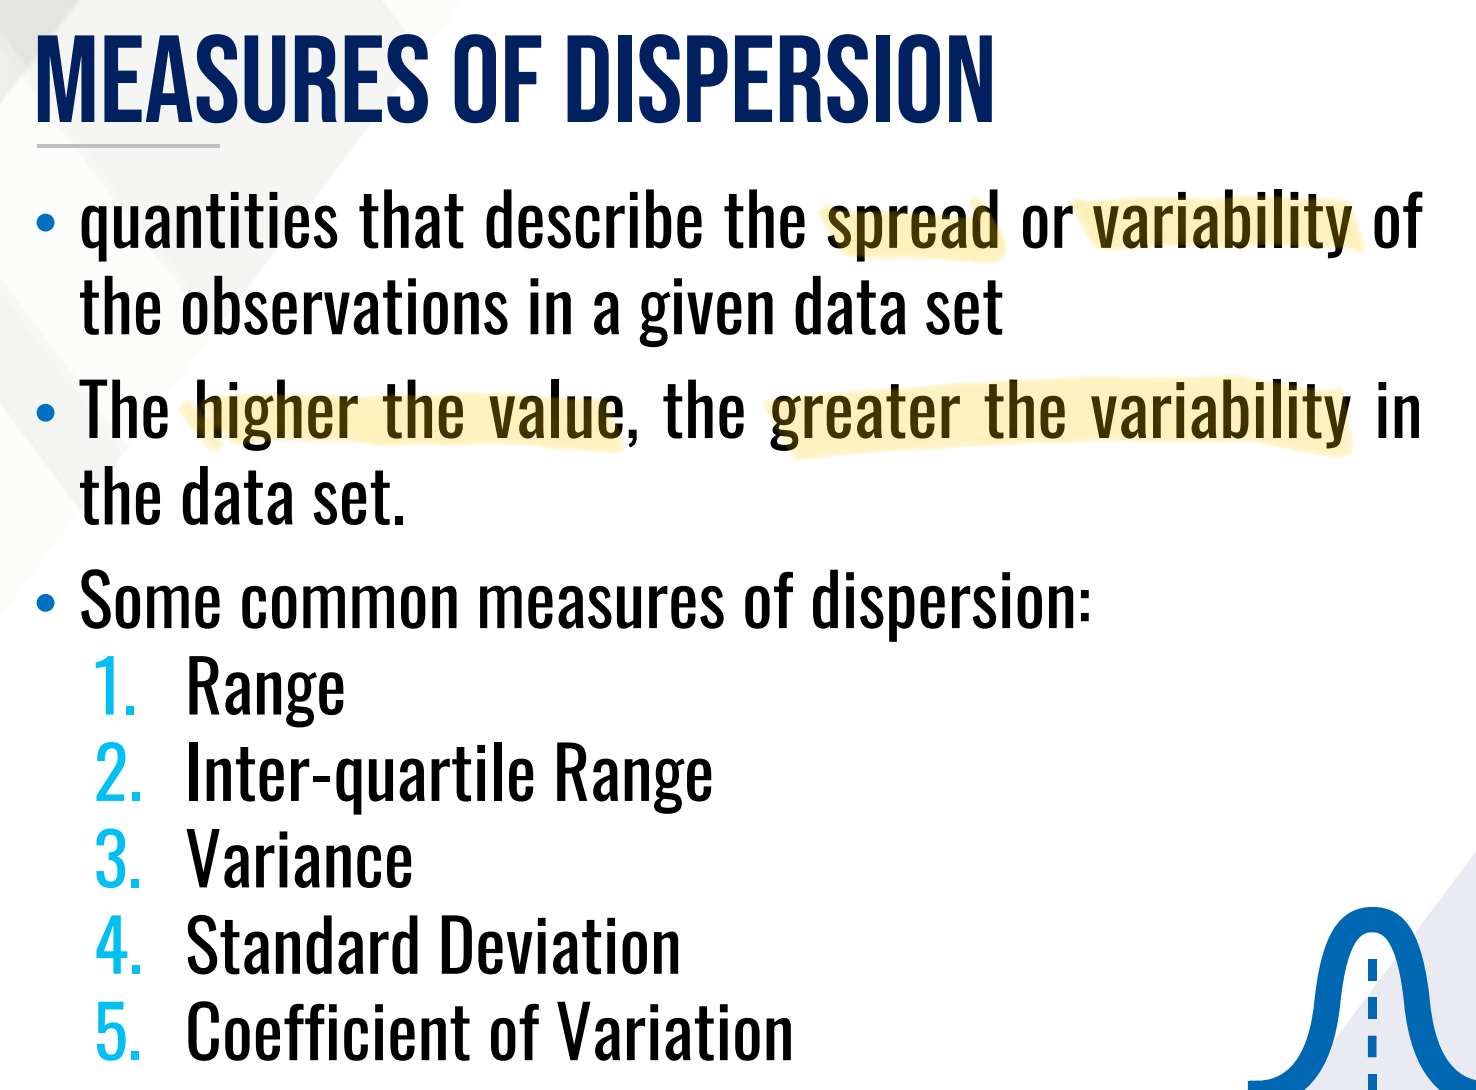
What are some common measures of dispersion?

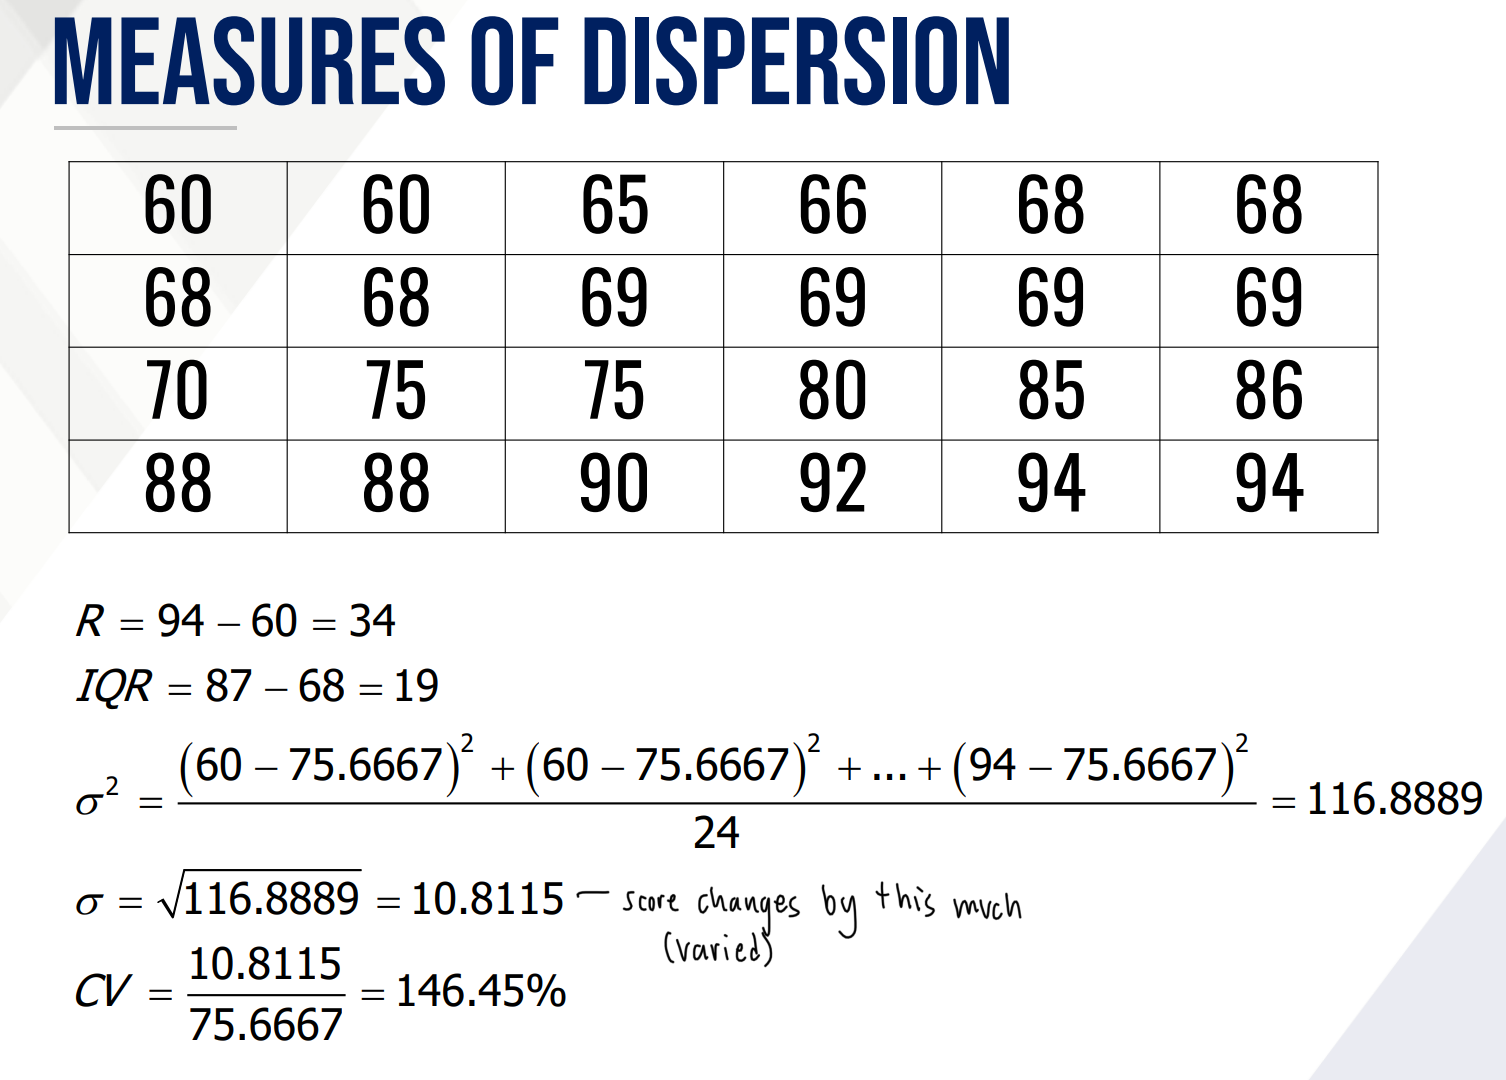
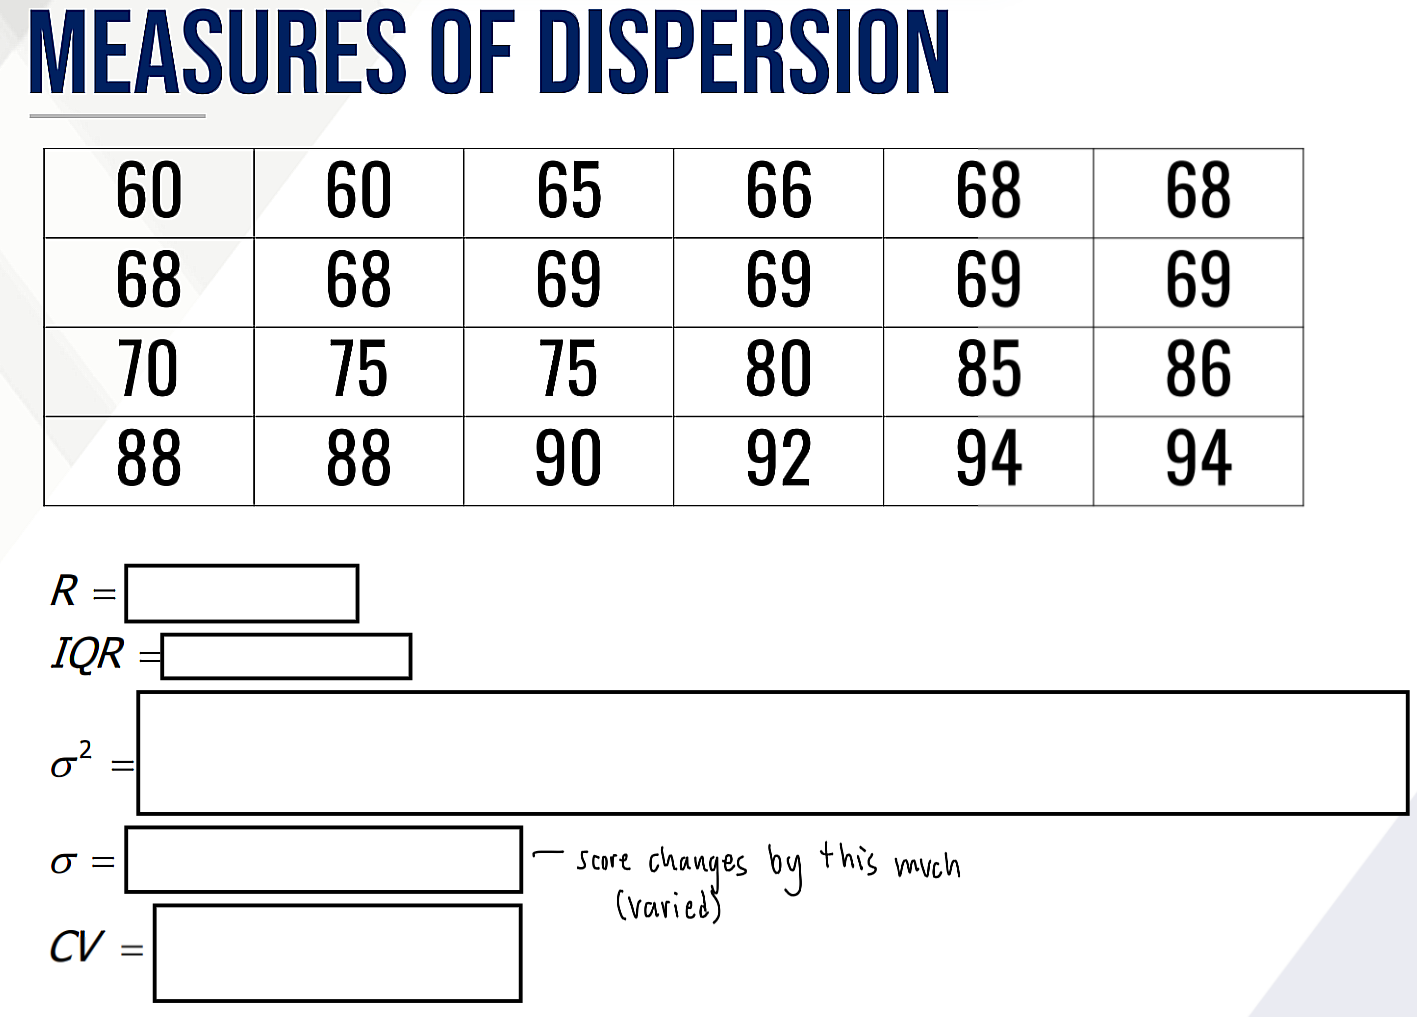
It is the difference between the minimum and the maximum.
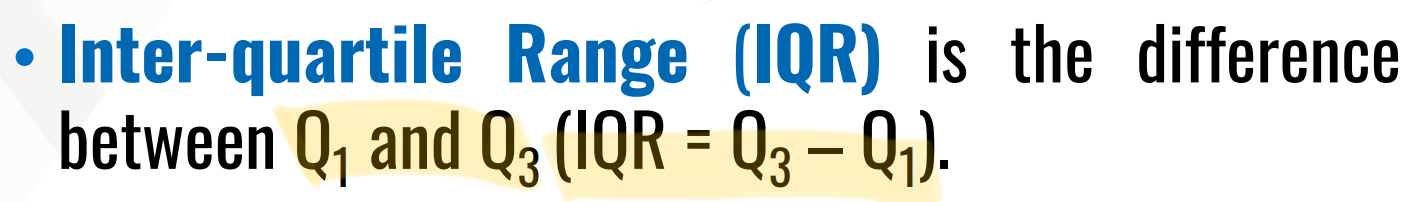
it is the difference between Q1 and Q3 (IQR = Q3 – Q1 )
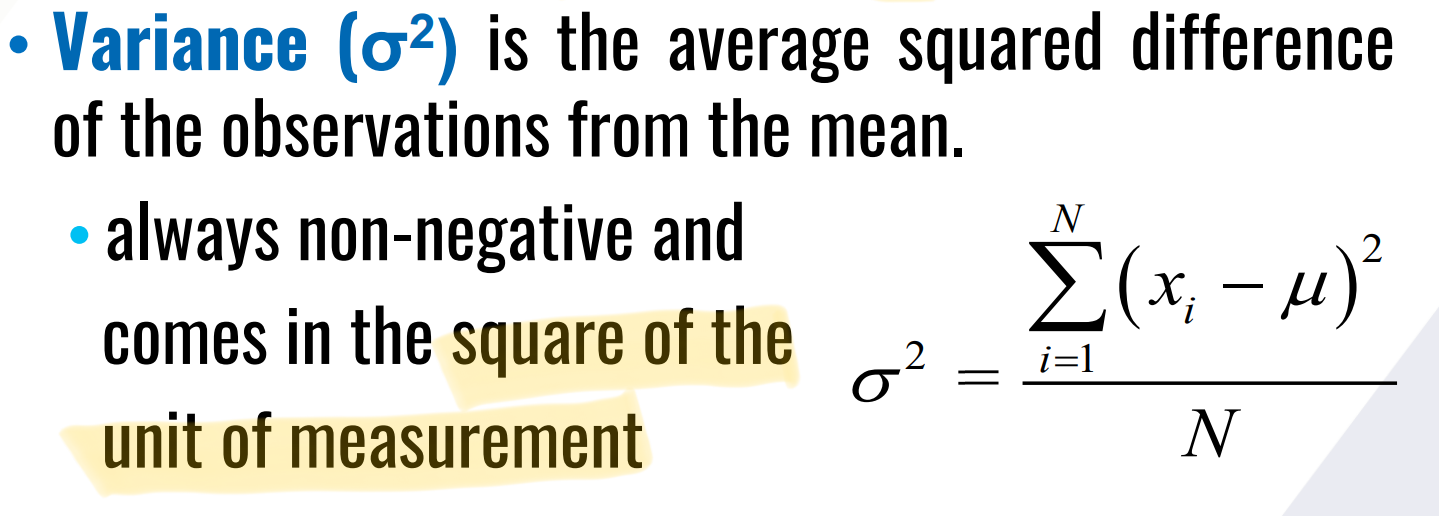
it is the average squared difference of the observations from the mean.
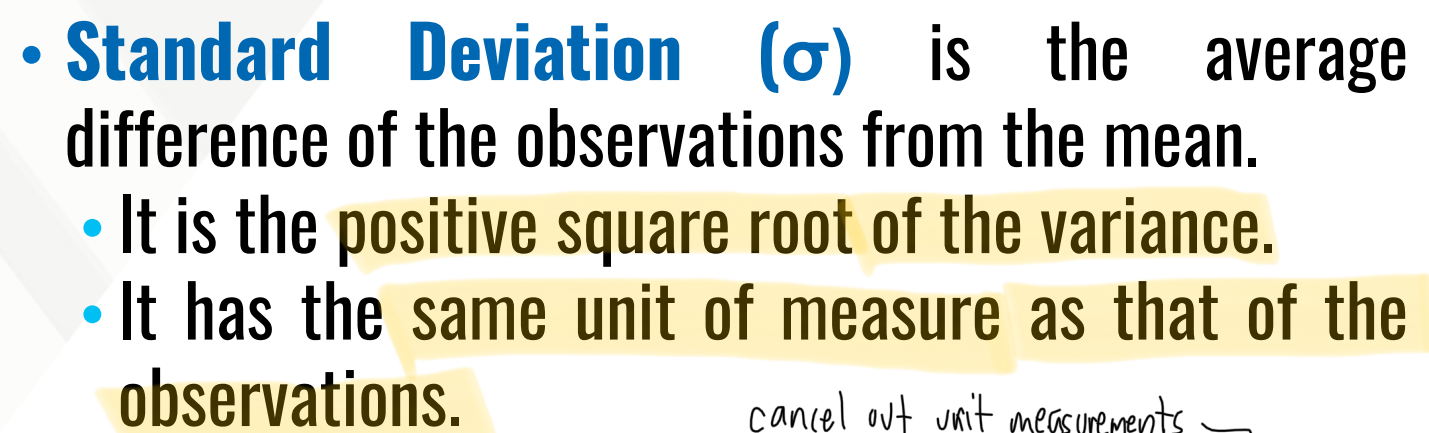
It is the average difference of the observations from the mean.
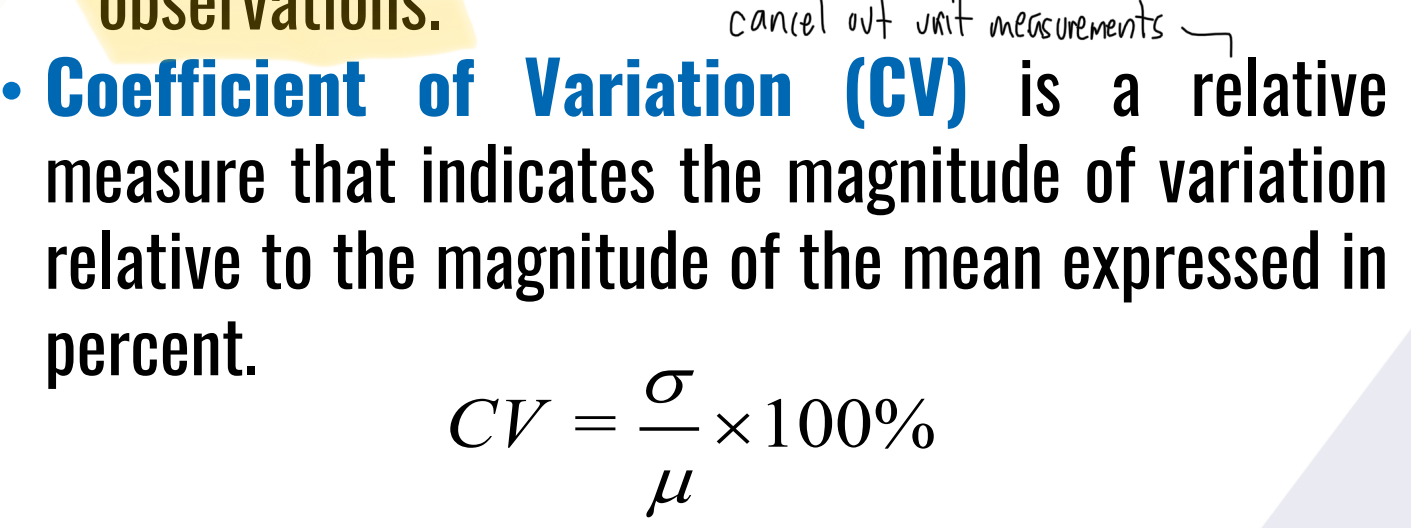
It is a relative measure that indicates the magnitude of variation relative to the magnitude of the mean expressed in percent.
Types of DESCRIPTIVE MEASURES
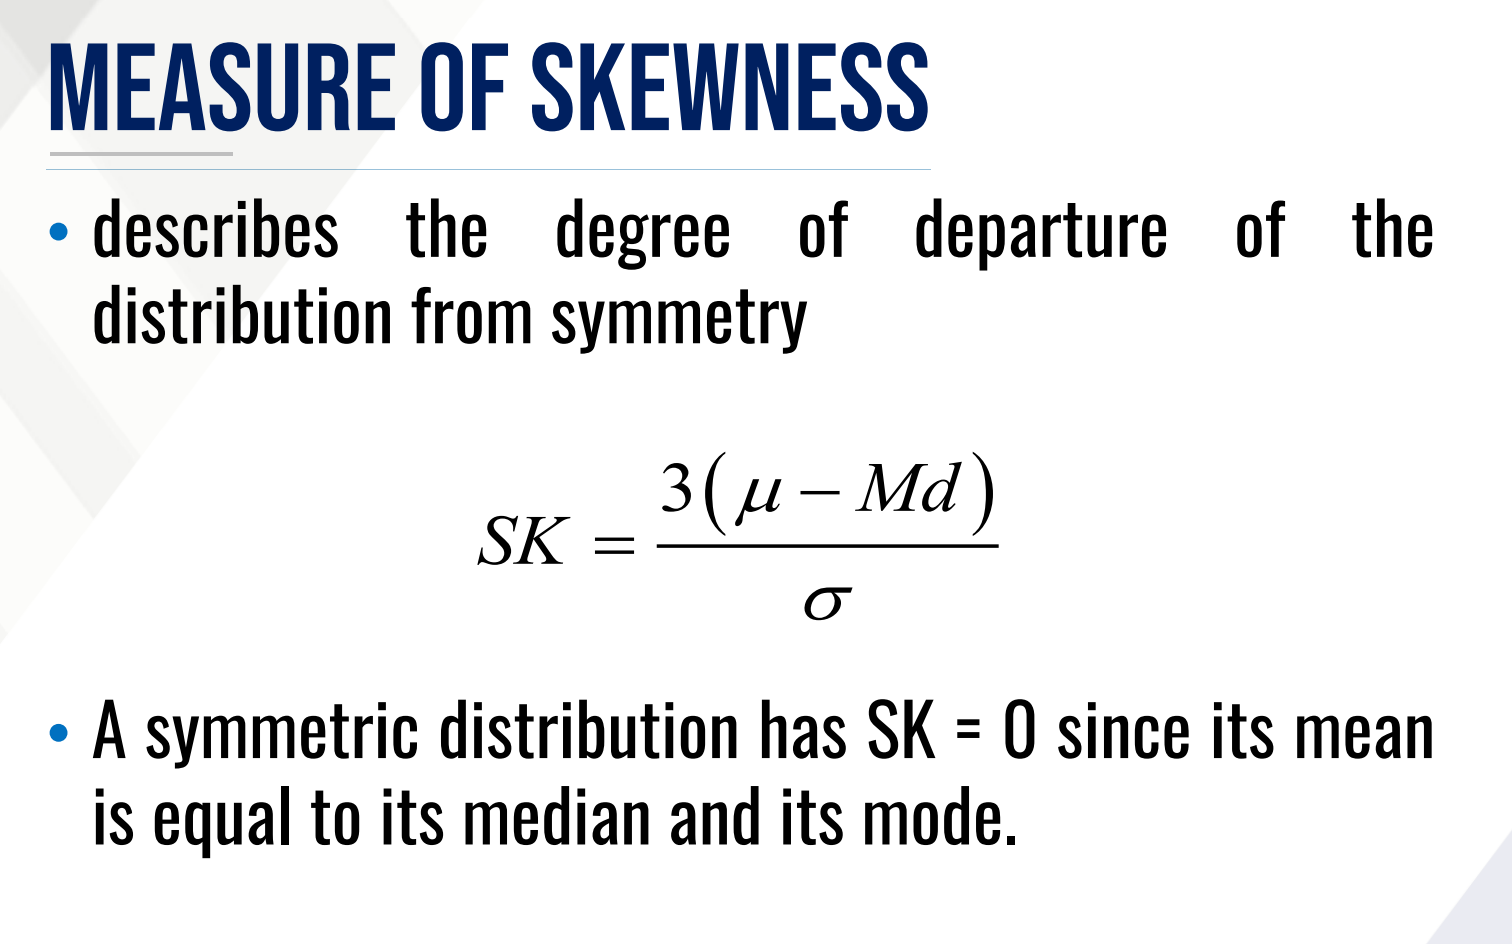
It describes the degree of departure of the distribution from symmetry
What is the formula for skewness?
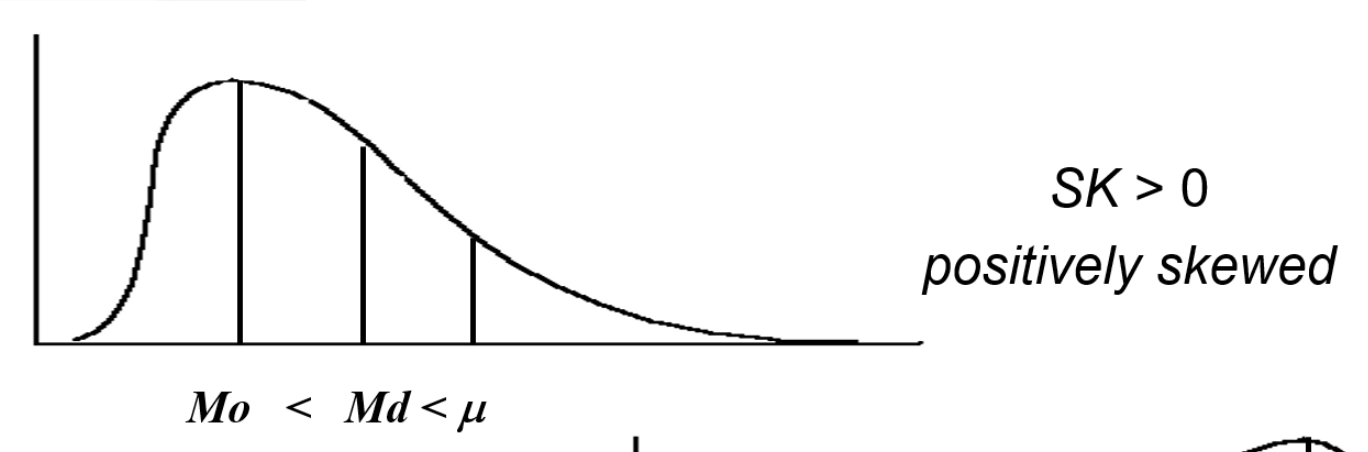
What does a skewness value greater than 0 mean?
What does a skewness value less than 0 mean?
Types of DESCRIPTIVE MEASURES
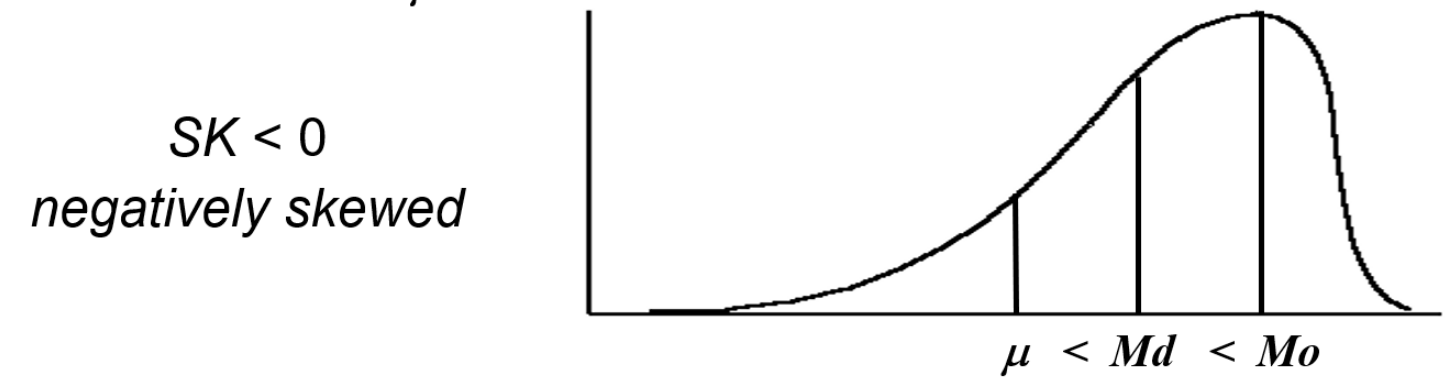
It describes the extent of peakedness or flatness and tailedness of the distribution
What is the formula for kurtosis?
Kurtosis
Types of DESCRIPTIVE MEASURES
It is not a measure of variance. Peakedness and tailedness may vary for the same variance.
mesokurtic distribution
If K = 0 then?
leptokurtic (heavy-tailed) distribution
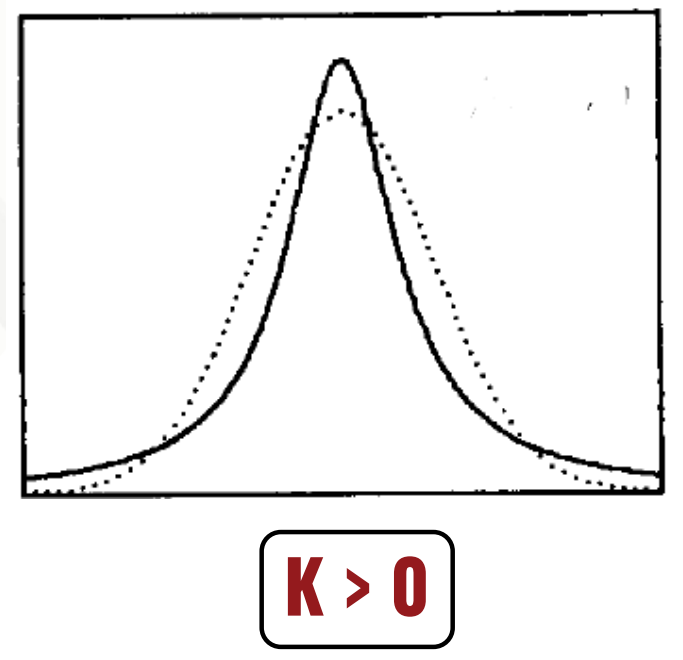
If K > 0 then?
platykurtic (light-tailed) distribution
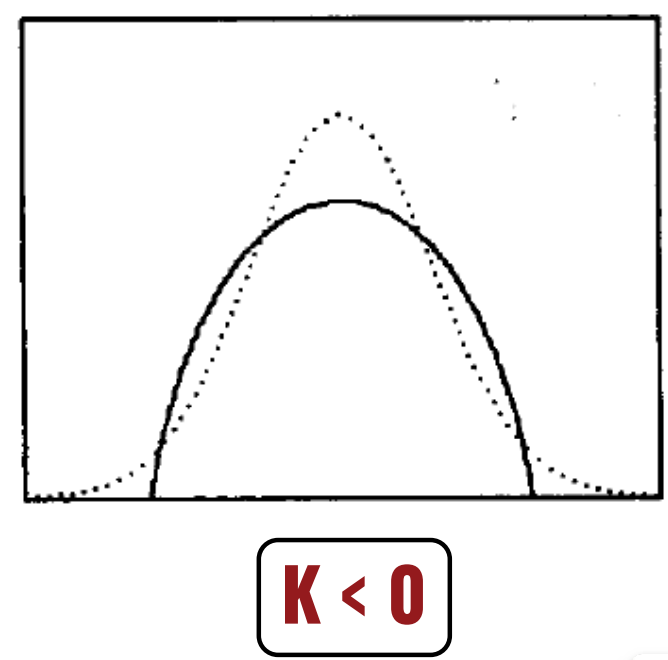
If K < 0 then?
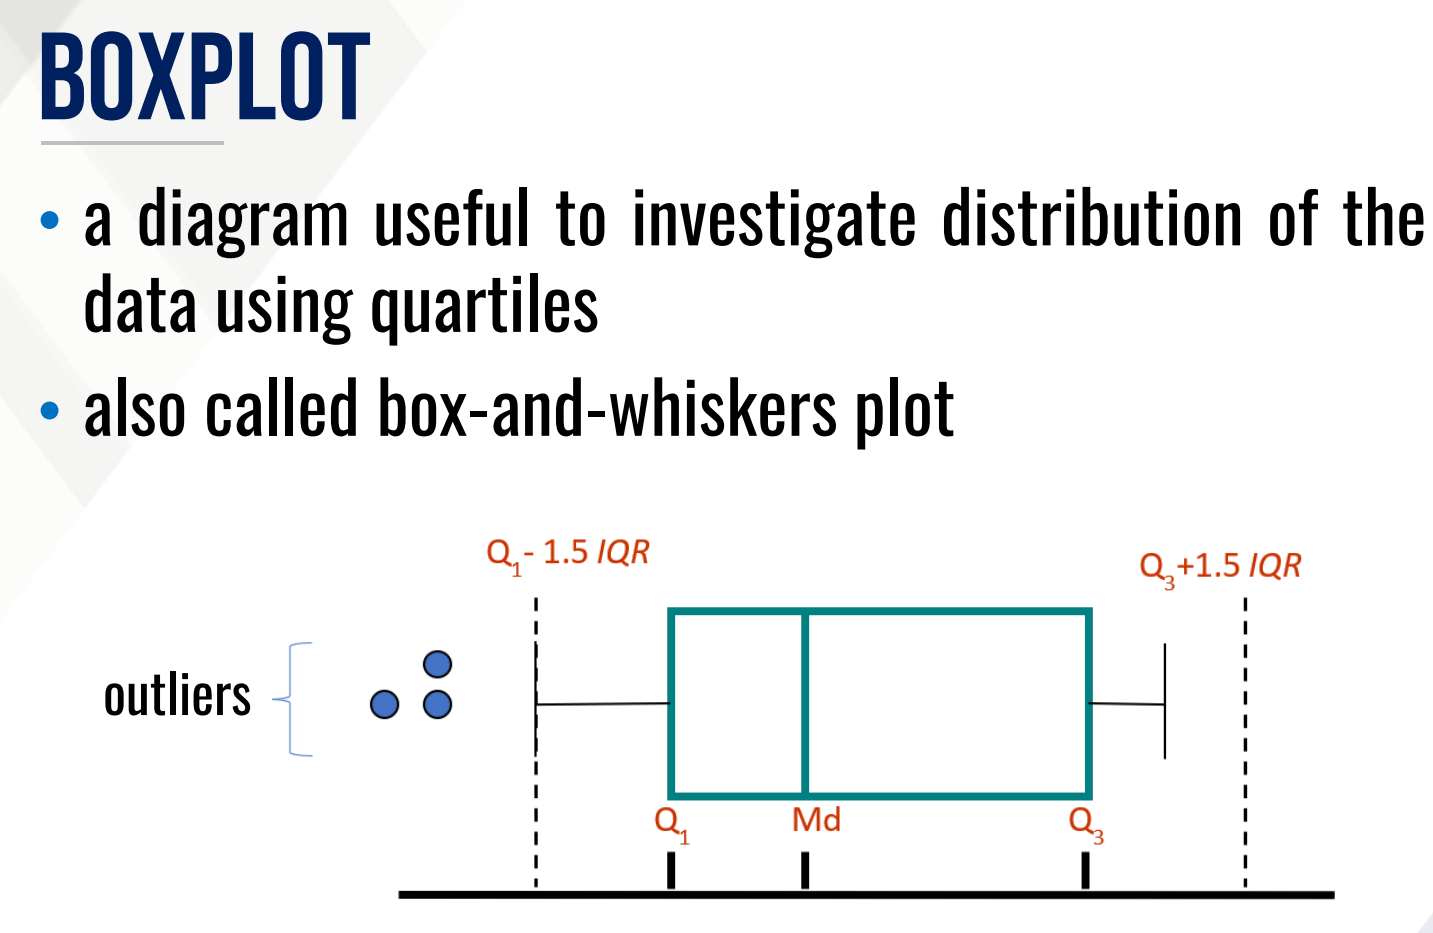
It is a diagram useful to investigate distribution of the data using quartiles
It is also called box-and-whiskers plot