MLS chem exam 1
1/123
There's no tags or description
Looks like no tags are added yet.
Name | Mastery | Learn | Test | Matching | Spaced | Call with Kai |
|---|
No analytics yet
Send a link to your students to track their progress
124 Terms
Standard deviation
The most frequently used measure of variation. The variance represent the “average” distance from the center of the data (the mean) and every value in the data set.
Standard deviation usefulness
Used to determine normal ranges for clinical tests by measuring variability in healthy populations. Useful in analytical precision.
Normal distribution curve
A symmetrical, bell-shaped probability distribution where data clusters around a central mean value. 68% of the data falls within one standard deviation of the mean, 95% of the dats within two standard deviations of the mean. About 4-5% of the population falls outside of the ±2 standard deviations.
Coefficient of variation (CV)
Allows you to compare standard deviations with different units and reflect the SD in percentages.
Coefficient of variation calculation
Divide the standard deviation by the mean and multiply it by 100 to express it as a percentage. SD/mean x100
Resistivity and conductivity
Used to get an idea of the water’s ionic content. A high resistivity means low conductivity. Generally, water with more ions is less pure and will conduct more electrical current.
Type I reagent grade water
Resistivity of greater than 18 MΩ·cm, and a conductivity of less than 0.056 microS/cm. Should be used for gas chromatography, mass spectrometry, making of reagents for molecular biology, and preparation of solutions for electrophoresis and blotting. Hard to get water at this level.
Type II reagent grade water
Resistivity of greater than 1MΩ·cm, a conductivity of less than 1microS/cm. Used in general applications to make buffers, pH solutions, microbiological culture preparation, to feed instruments and analyzers, electrochemistry, sample dilution, and radioimmunoassay. Most commonly used grade.
Analytical sensitivity
Refers to the ability to detect small quantities or changes in an analyte. Also determines the lower limit of detection for a given analyte- lowest amount that can be reliably detected.
Analytical specificity
Refers to cross reactivity with other substance. Determine if a compound; can be measured without interfering compounds.
Diagnostic sensitivity
The rate at which a test is positive in individuals with proven disease. Diminished by a high rate of false negative results.
Diagnostic sensitivity formula
True positive/true positive + false negative (TP/TP+FN)
Diagnostic specificty
Refers to the rate at which a test is negative in individuals absent from the disease in question. Diminished by a high rate of false positive results.
Diagnostic specificity formula
True negative/true negative + false positive. TN/TN+FP
TP
True positive
FP
False positive
TN
True negative
FN
False negative
ROC (receiver-operator characteristic) curve
Aid in selecting a cutoff point that maximizes test sensitivity and/or specificity or optimizes both. Each point represents a different cutoff level. For every cutoff level, a sensitivity and specificity value is plotted.
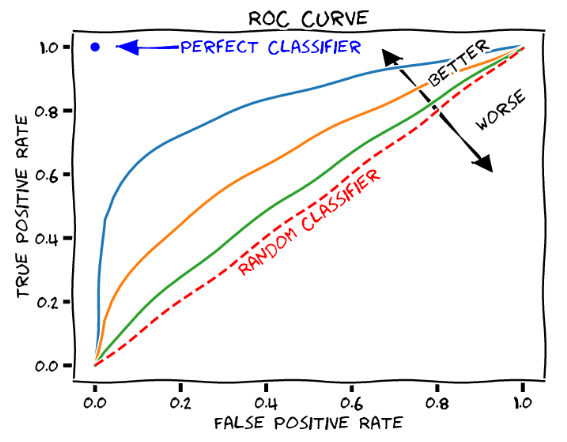
AUC (area under the curve)
In ROC curves, useful estimate for evaluating overall efficacy of a diagnostic test.
Predictive values
Evaluate whether a test performs reliably to rule in or to rule out a diagnosis. Highly dependent of the population analyzed and prior probability of disease in an individual patient. Example: D-Dimer rule out test
Positive predictive value
True positive/true positive + false positive (TP/TP+FP)
Negative predictive value
True negative/true negative + false negative (TN/TN+FN)
Beer-Lambert Law
Relates absorbance of a colored compound to its concentration in solution. Absorbance is directly proportional to concentration of a colored substance in solution. A=abc where A=absorbance, a=molar extinction coefficient, b=path length of light transiting cuvette (1cm), c=concentration in M.
Absorbance calculation using Beer-Lambert Law
Absorbance = -log T or Absorbance = 2-log(%T) where T=0-1
Dynamic range
Refers to the range of values from very low to very high that can be reliably measured.
Matrix effect
Refers to other substances in a specific sample that interfere with a test and affect its accuracy. For example, a test that measures calcium in serum may not work the same in urine or breast milk.
1 2s Westgard rule
One control observation exceeding the mean ±2s. A warning rule that initiates testing of control data by other rules.
1 3s Westgard rule
One control observation exceeding the mean ±3s. High sensitivity to random error.
2 2s Westgard rule
Two control observations consecutively exceeding the same +2s or -2s. High sensitivity to systematic error.
R 4s Westgard rule
One control exceeding the +2s and another exceeding the -2s. Detection of random error.
4 1s Westgard rule
Four consecutive control observations exceeding +1s or -1s. Detection of systematic error.
10x Westgard rule
Ten consecutive control observations falling on one side or the other of the mean (no requirement for SD size). Detection of systematic error.
Amino group
-NH3+
Carboxyl group
-COOH
Peptide bond
-CO-NH-
Non-polar side chains
Hydrocarbon or aromatic rings
Polar uncharged side chains
Hydroxyl, amide, or thiol groups (hydrophilic, no charge)
Acidic side chains
Carboxyl group (negatively charged)
Basic side chains
Amino groups (positively charged)
A-1-antitrypsin deficiency
A genetic condition that affects the protein responsible for protecting tissues from damage by enzymes. Causes lung damage due to the loss of protection from destructive enzymes and liver damage due to the buildup of abnormal proteins. Juvenile emphysema.
Maple Syrup Urine Disease
Elevated leucine causes cerebral edema and intoxication, poor feeding/irritability, progressing to lethargy, intermittent apnea, cerebral edema, coma and death. Significant elevations of valine, leucine and isoleucine are detected, as well as L-alloisoleucine (pathogenic marker for MSUD). Liver transplant is a treatment option.
Phenylketonuria
Phenylalanine, the primary amino acid, is increased and phenyl ketones, the metabolites, are also increased. Tyrosine is the decreased amino acid. Clinical signs include intellectual disability, seizures, “mousy” odor, fair hair/skin, and eczema.
SPE bands (serum protein electrophoresis) bands
From left to right: albumin, antitrypsin, haptoglobin, transferrin, LDL, c3, IgM
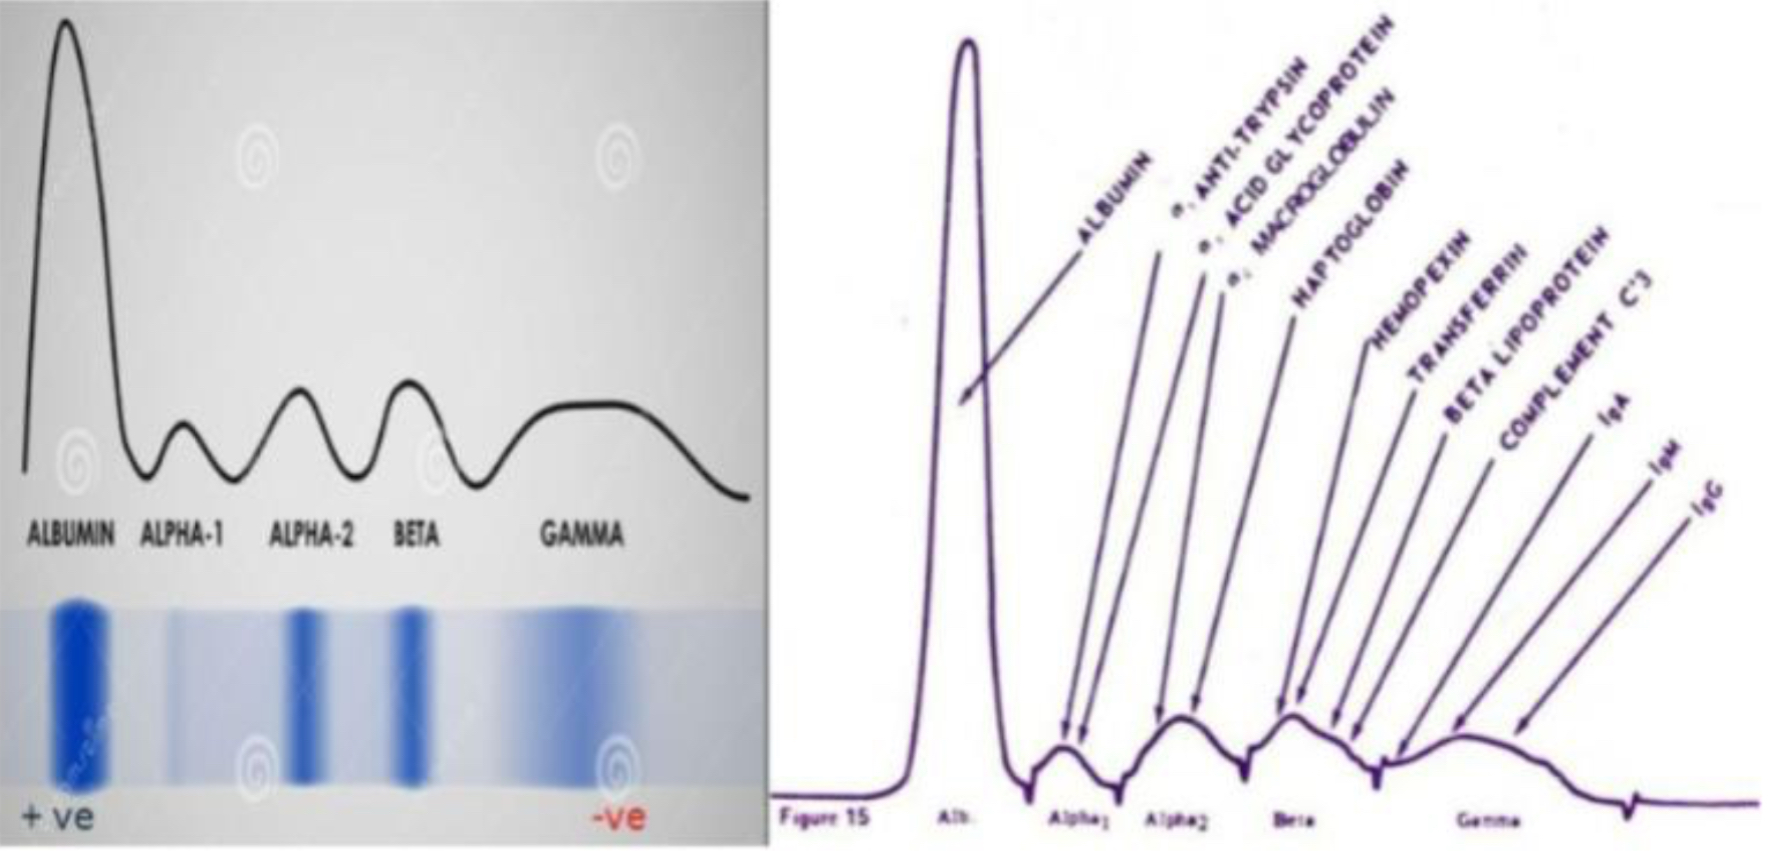
Proteins synthesized in the liver
Albumin, antitrypsin, haptoglobin, transferrin, LDL, C3.
Protein synthesized by plasma cells
Immunoglobulins (in bone marrow)
Plasma protein charges
Negatively charged in a buffer of pH 8.7 because they are in their anionic form, so they have more negative than positive charges.
Plasma proteins providing negative charge
Aspartic acid and Glutamic acid
Function of albumin
Transports insoluble ions and insoluble compounds. Carries over 200 negative charges and binds large shell of Na+ and water. Responsible for maintaining water in vascular compartment (oncotic pressure)
Decreased circulating albumin
Called hypoalbuminemia. Common finding in liver failure. Causes edema (water movement into interstitial spaces) or anasarca (widely disseminated edema). Decreases total but not free calcium level.
Decreased albumin causes
Liver disease, kidney disease, malnutrition, inflammation, digestive problems.
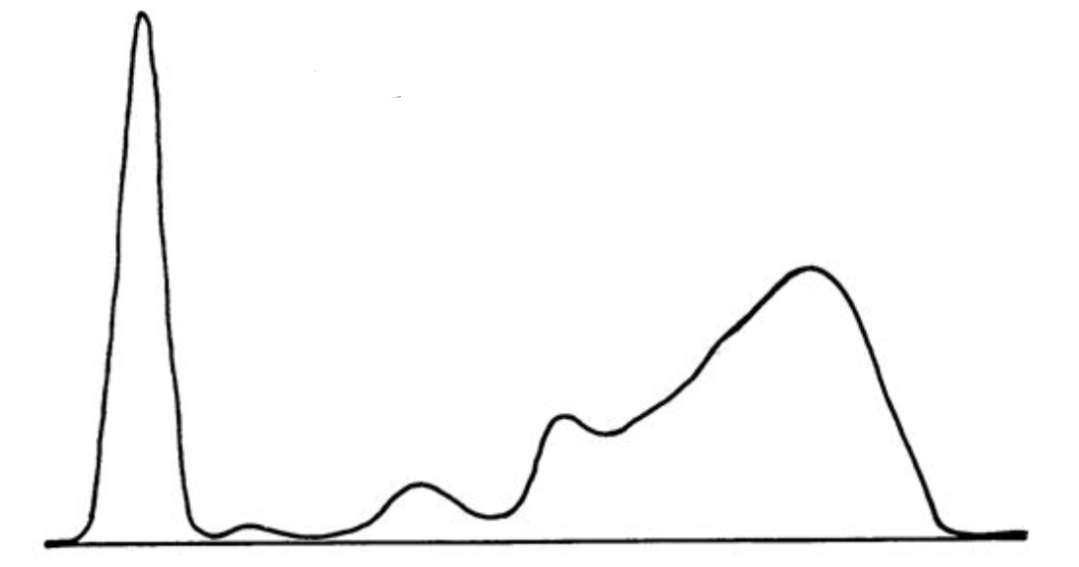
SPEP/UPEP pattern of myeloma
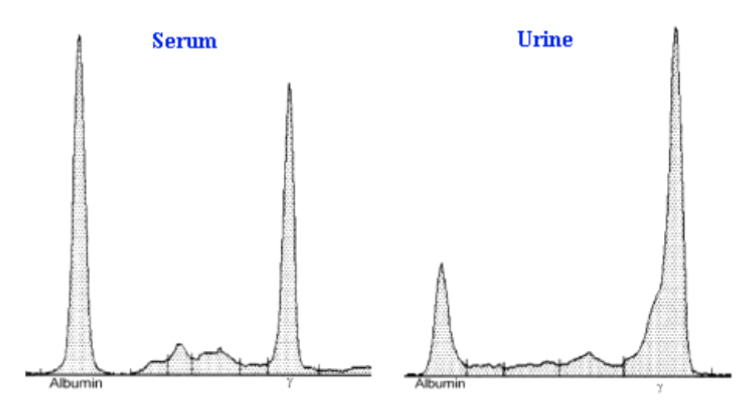
UPEP of nephrosis
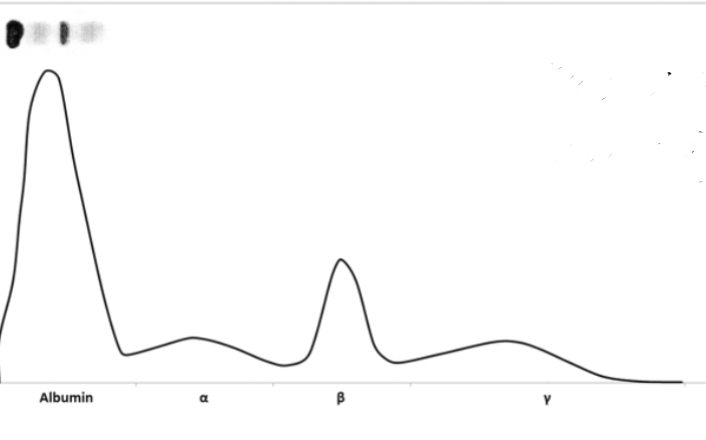
SPEP of cirrhosis
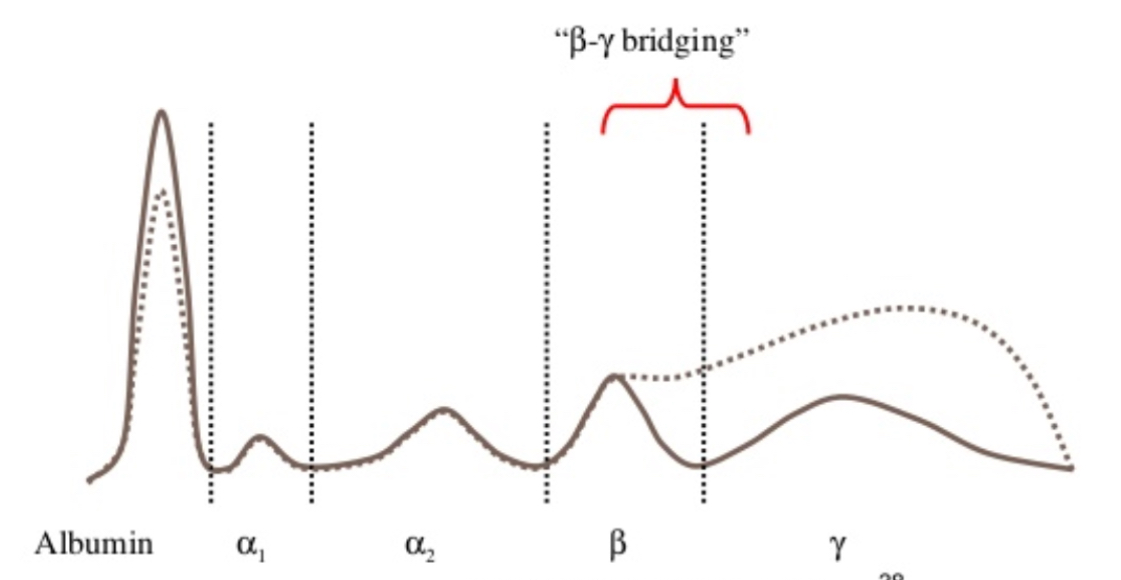
Polyclonal gammopathy
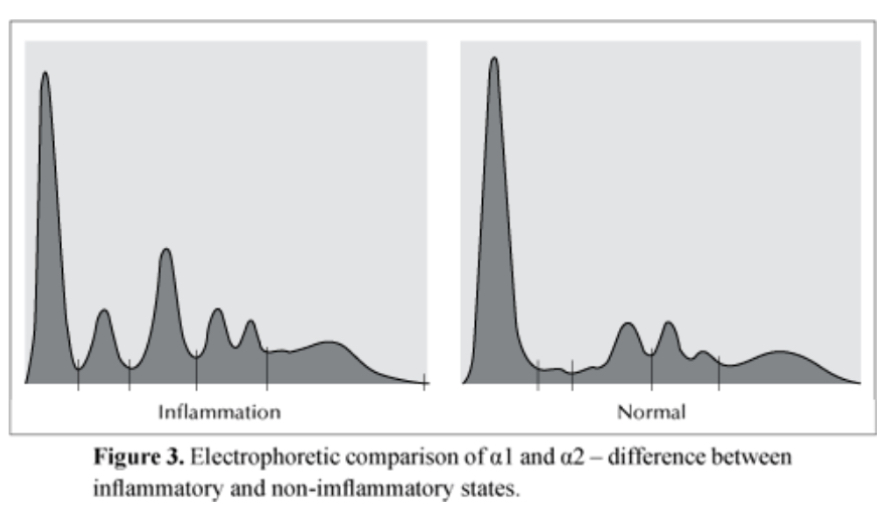
Acute phase reaction
Diagnostic criteria for myeloma
Elevated total protein and Ca2+. “Spike” in gamma region of SPEP or UPEP. Presence of Monoclonal (M) protein.
Lymphocyte representing the neoplastic (Malignant) clone in myeloma
Plasma cells-B lymphocyte-produce antibodies (Immunoglobulins)
Tumor marker in myeloma
Monoclonal protein (M-Protein). Another important marker is free light chains. Bone lesions
Immunofixation electrophoresis
Important clinical utility in myeloma because it allows for the identification and characterization of abnormal monoclonal immunoglobulins (M-proteins)
Total plasma protein reference range
6.0-8.3 g/dL
Albumin reference range
3.5-5.5 g/dL
Albumin methodology
Bromocresol green dye-binding method
Total protein methodology- biuret method
Blue colored got copper
Total protein reagent composition
Copper sulfate, sodium potassium tartrate, potassium iodide, sodium hydroxide
Albumin reagent composition
Bromocresol green,, buffer, surfactants and stabilizers
Fenestrated endothelial cells
First filtration barrier in the glomerulus, prevents passage of cells into filtrate and make for a more highly permeable barrier than ordinary capillaries.
Basement membrane (GGM)
Beneath endothelium in the glomerulus filtration barrier, enriched in non-linear type 4 collagen in a “pickup stick” array.
Epithelial cells projections (foot processes)
Wrap around GBM in the filtration barrier in the glomerulus and form filtration slits in “curving waterslide” - enriched in a transmembrane protein (nephrin) mesh.
Ideal renal filtration markers
Inulin, a plant polysaccharide; has to reach steady state by IV infusion. Be freely filterable, not be metabolized (an end-product), be produced at a steady state level, not be reabsorbed by the tubules, not be secreted by tubules.
Urea
The primary waste product of protein metabolism. Produced in the liver from the breakdown of amino acids.
Increased circulating urea
Azotemia, kidneys are not able to adequately filter and excrete urea. Chronic kidney disease, glomerulonephritis. Key marker used with creatinine levels to evaluate renal function.
Creatine
A waste product produced by the breakdown of creatin phosphate in muscle cells. Circulating levels depend on an indiviual’’s muscle mass and the renal filtration rate. Indicator of the functioning nephrons in the kidney.
Increased circulating creatinine
Seen when less than 50% of functional nephrons or nephron activity is lost. Indicate impaired kidney functions- common causes- acute or chronic kidney disease, dehydration, increased muscle breakdown (rhabdomyolysis)
Renal clearance of creatinine
Approximately 100ml/min meaning that 100 ml of plasma is completely cleared of creatinine every minute in an individual with healthy kidneys.
Creatine methodologies of measurement
Spec measurements. Enzymatic creatine has higher specificity than the jaffe method. Enzymatic creatinine assay: three enzyme method, peroxide generation coupled to oxidation of a chromogen.
Contrast alkaline picrate (Jaffe)
Ancient dye-binding method: Jafe 1886. Alkaline solution of picrate. Kinetic analysis is less subject to interferences as compared with end point.
Reference range for serum creatinine
0.40-1.40mg/dL
Urine creatinine reference range
20-275mg/dL in females, 20-320mg/dL in males.
Creatine clearance calculation
UV/Px1440
Creatine clearance reference range
97-137ml/min in males, 88-128 ml/min in females
Glomerular filtration rate (GFR) Variables and normal values
UV/P where U=the urine creatinine level in mg/dL, V= the 24hr urine volume in ml/24hrs, P= the plasma creatinine in mg/dL. Normal values: U=120mg/dL, V=1,000mL, P=1.0mg/dL
Arginine vasopressin (antidiuretic hormone)
Angiotensin II induces secretion of ADH from posterior pituitary. ADH recruits water channels to the apical membrane of connecting tubules and collecting ducts in the late (distal) nephron. Causes increased water reabsorption in the kidneys.
Central diabetes insipidus
Head injury, brain trauma, radiation therapy, severe illness.
Nephrogenic diabetes insipidus
ADH resistance: inherited or acquired defects in vasopressin type-2 receptor or aquaporin-2 genes causing ADH sensitivity.
Syndrome of inappropriate antidiuretic hormone secretion (SIADH)
Etiology: paraneoplastic syndromes- small cell lung tumor, epilepsy, meningoencephalitis, pulmonary disease
Osmolality and sodium levels in diabetes insipidus and SIADH
Dilutional hyponatremia and increased urine osmolality, central diabetes insipidus, hypernatremia, decreased urine osmolality, and increased serum osmolality.
Major intracellular cation
Potassium
Major extracellular cation
Sodium
Dietary sources of potassium
Fruits, vegetables, juice, etc.
Reserve of potassium in body
Intracellular
High potassium level
After chemotherapy especially leukemia or lymphoma
Renin-angiotensin-aldosterone axis
Low blood pressure and or low sodium being delivered.
Angiotensin II
Increases blood pressure including induction of aldosterone
Aldosterone
Sodium conserving and potassium wasting. Can be stimulated by ATII, and also independently by hyperkalemia.
ACE-inhibitors and angiotensin II receptor (ARB) blocker
Lisinopril and Losartan are used to treat hypertension. Also calcium channel blockers, beta-adrenergic blocking agents, etc.
Conn’s syndrome
Primary hyperaldosteronism- adrenal adenoma secreting inappropriately high levels of aldosterone resulting in hypokalemia. In a deficient secretion of aldosterone, hyperkalemia and hyponatremia will occur.
Pseudo hyperaldosternism
A condition in which the clinical effects of excess aldosterone such as hypokalemia are present but the aldosterone levels are normal or low. Some causes could include licorice consumption and certain genetic disorders.
Utility of the aldosterone to renin ratio
Informative in differentiating primary from secondary hyperaldosteronism.
Primary hyperaldosteronism
Typically caused by an adrenal adenoma secreting inappropriately high levels of mineral corticoid resulting in hypokalemia. ARR is higher in this.