Surface Water
1/35
There's no tags or description
Looks like no tags are added yet.
Name | Mastery | Learn | Test | Matching | Spaced | Call with Kai |
|---|
No study sessions yet.
36 Terms
strahler stream order and names
1st order means headwaters (2nd order when two first meet, 3 when two seconds, etc)
usually history/tradition determines the name, or the greater volume/depth
how does water fill a stream?
runoff generation → overland flow, interflow, groundwater flow, return flow
pathways such as transit time, water chemistry and erosion
depression storage (fill/spill)
overland flow
infiltration excess or saturation excess
will reach rivers and streams very quick, low interaction with soil, low solutes
more likely in urban areas, less likely in forests which has higher infilitration, fires and also increase
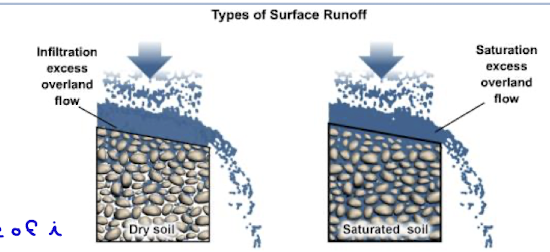
infiltration capacity
mm/hour
determined by soil properties, rate of i
ex sandy soil > loamy > frozen
occurs if rate of precipitation > than the infiltration capacity (hortonian overflow)
throughflow/interflow
water in a homogenous unsaturated zone should only move by gravity or downwards
but if there are distinct differences in pore size or permeability water may be more likely to move laterally than downwards
above the regional groundwater table
in unsaturated zones water is held in pores by capillary forces
this capacity increases with smaller pore sizes (clay>sand)
groundwater flow
a continuum of water with different transit times to streams
some respond to rainstorms, others only respond to climatic changes over years
sustains rivers even during droughts
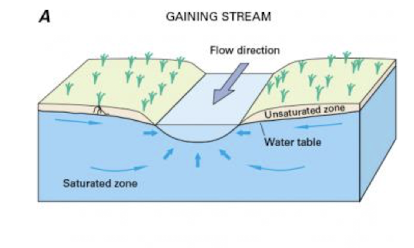
gaining rivers
receive groundwater discharge from watershed, adds to streamflow
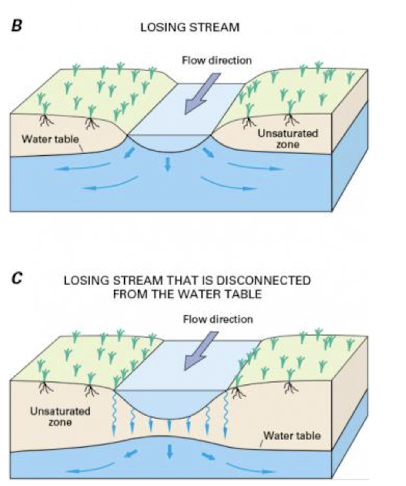
losing rivers
recharge groundwater, since the table is below the river
common when rivers leave wet regions and pass through dry
streamflow equation (Q)
= discharge (m3/s, or volume over time)
= velocity * area
velocity is not constant, friction of channel/bank/air slow down the flow
total stream discharge is the sum all subsections
how to measure streamflow
measure at 60% depth (the average) for many subsections (maybe 10) to get a good estimate
the highest would be at the top and the lowest at the bottom
measured with propellor, sensors in large rivers, flow meter in small creeks, weirs, salt dilution, etc
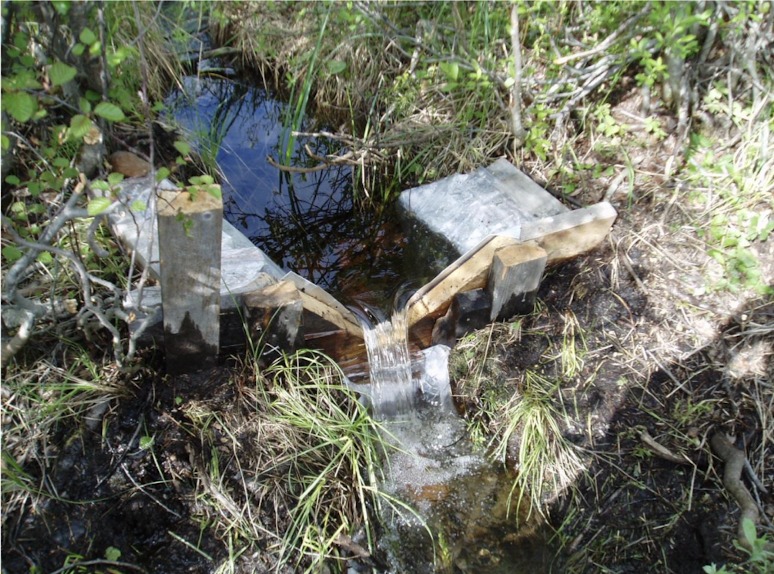
v-notch weirs
discharge known from stage (water level) behind compared to discharge at the level of notch
compute how much is actually going over, Q
another measure of streamflow
salt dilution
pour in tracer solution with high salt concentration, then measure electrical conductivity at a distance downstream
using EC, time and distance can calc streamflow, Q
does impact the environment, but can also use dyes
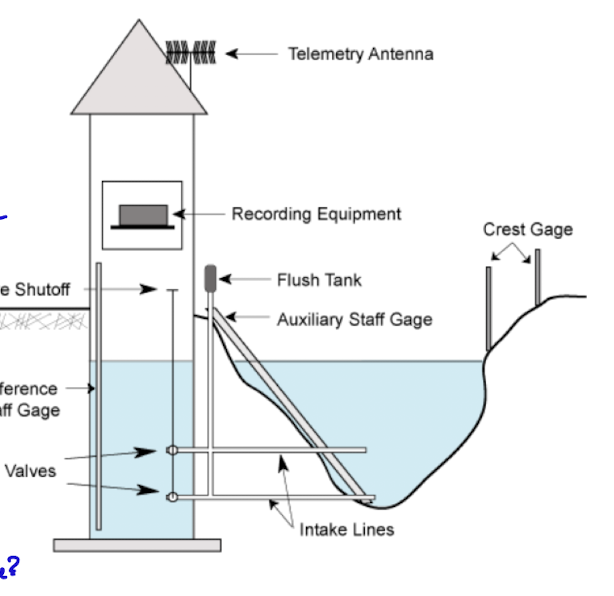
continuous discharge data
recorders can get high frequency data for water level/high/low flow
verified by staff gauges - measured every hour
the rating curve is used to get discharge from this data, specific for each water way
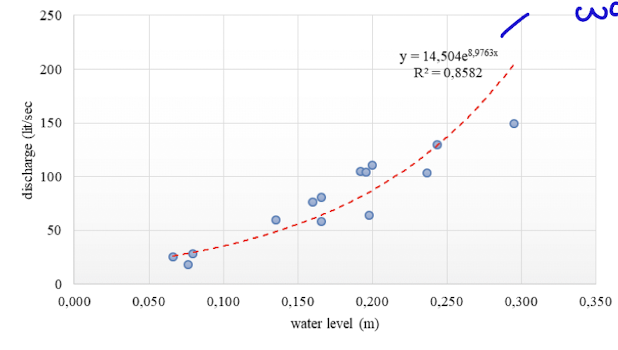
rating curve
the relationship between discharge and water level (unique to each site)
allows use to translate the water level into the discharge
runoff
the amount of water that moves into streams and further downstream, divided by watershed area
= volume/area * 1000 (bc in mm)
in mm
the depth of water for an area that becomes river discharge
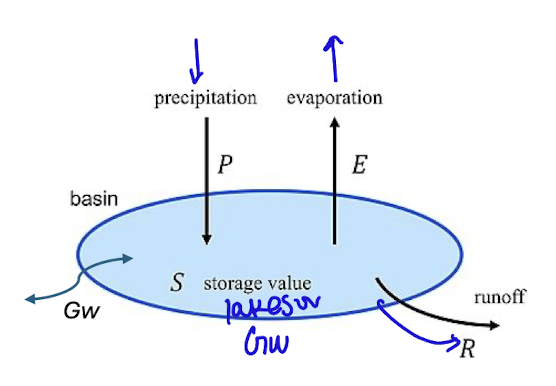
water balance
change S = P - ET - R ± GW
change in storage = precipitation - evapotranspiration - runoff ± groundwater (inflow or outflow)
in mm
if change in S and Gw are zero, R= P-ET
runoff ratio
= R/P
the ratio between runoff and precipitation, hydrological efficiency
indicates how much precipitation becomes runoff
units must match**
so for ex high in west coast, very low in prairies
variability in runoff ratio
topography, steepness = higher ratio
clay soils have higher ratio (low infiltration)
drainage channels increase
lakes provide storage, decreases
vegetation increases
wetlands are variable
urban infiltration
increases runoff, decreases evaporation, decreases infilitration
need mitigation practices such as wetlands, rainwater harvesting, green areas, etc
hydrograph
follows discharge over time - can be 1 storm or 1 year
lag time, flood magnitude, recession timing and R/P all vary on - size, steepness, infiltration, groundwater pathways, wetlands/lakes
other factors like wet/dry soils, frozen soils, and storm magnitude
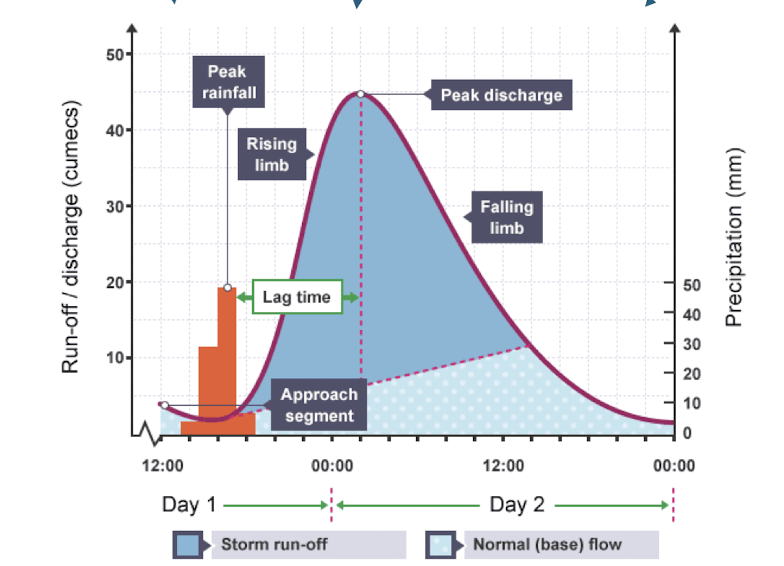
baseflow
before rain, supported during dry periods by groundwater or interflow paths
rising limb
hydrograph during rain
peak discharge
highest/flooding level on a hydrograph
lag time
the difference between peak rainfall and peak discharge on a hydrograph
falling limb
recession on a hydrograph
storm runoff
quick flow
old water paradox
stream flow separated into quickflow (considering overland) and baseflow (considered ground) on a hydrograph
headwater streams have rapid response in flow to rain (new water), yet after a rain the stream water still has characteristics of the old water…
how is it that new rain pushes out old water? esp when old water is considered the GW
water capacity holds water
old water paradox displacement flow
/piston flow
discharge is often not the overland flow we think it is
new water is pushing old water into stream

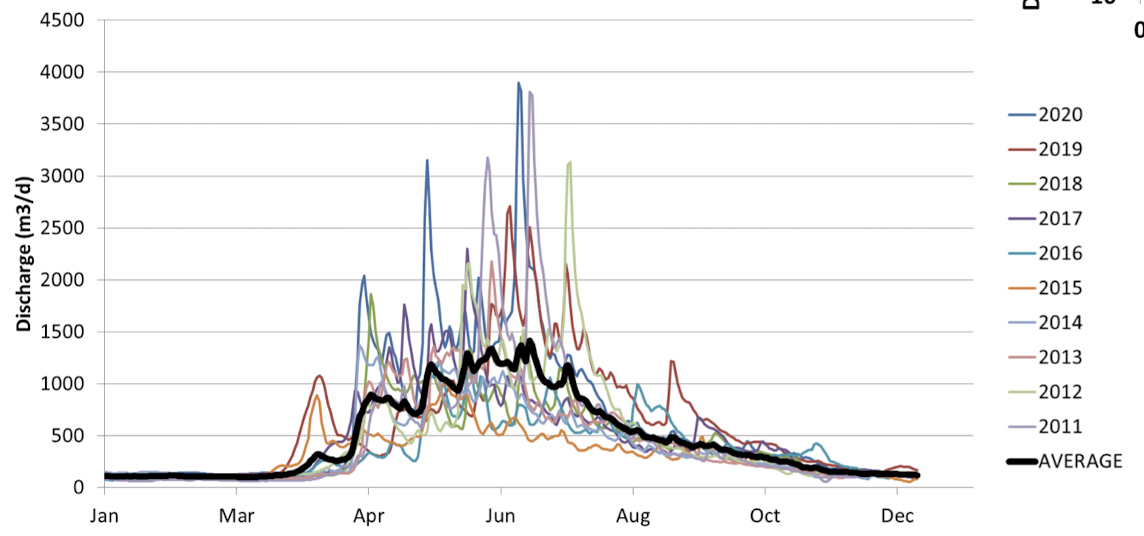
hydrograph comparisons
characteristics depend on watershed size, steepness, infiltration rate, wetlands/lakes, soils, climate, storm magnitude, etc
so for example a large watershed has longer lag time but higher peak flow, more steep means higher peak flow, plains have higher peak and lower lag as compared to forests, and impermeable soils will have lower lag and higher peak
hydrological regime components
magnitude - timing and peak of baseflow, annual runoff, R/P
variability - frequency/duration of exceedance, flashiness (spikey), predictability
nival regime
streamflow dominated by snowmelt, followed by generally receding flow during summer
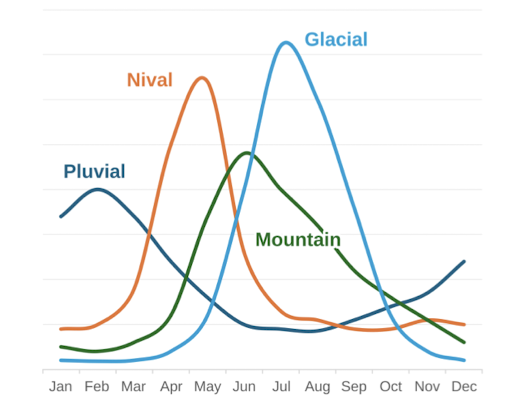
glacial regime
streamflow dominated by glacial meltwater, peaks during summer months

pluvial regime
streamflow dominated by rain events during a wet season - winter months in coastal canada

mixed regime
streamflow with characteristics of more than one
anthropogenic regime
dams, urban, forest harvesting, irrigation
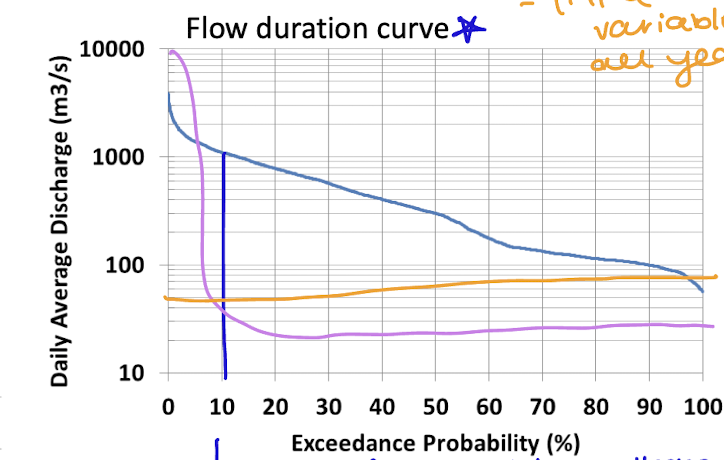
hydrological regime exceedance prob
on a flow duration curve, shows percent of time where discharge is at a specific level