9. What I look for (more confluences, the better)
 Call Kai
 Learn
Learn Practice Test
 Spaced Repetition
 Match
Match Flashcards
 Knowt Play
1/6

There's no tags or description
Looks like no tags are added yet.
Name | Mastery | Learn | Test | Matching | Spaced | Call with Kai | Chat |
|---|
No analytics yet
Send a link to your students to track their progress
7 Terms
Candlesticks
Look for strong rejection signals (e.g. long wicks) for potential reversals. Lack of rejection may hint at a breakout
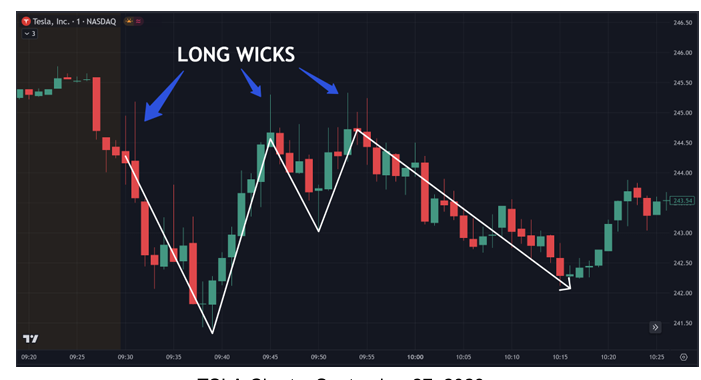
Chart Patterns
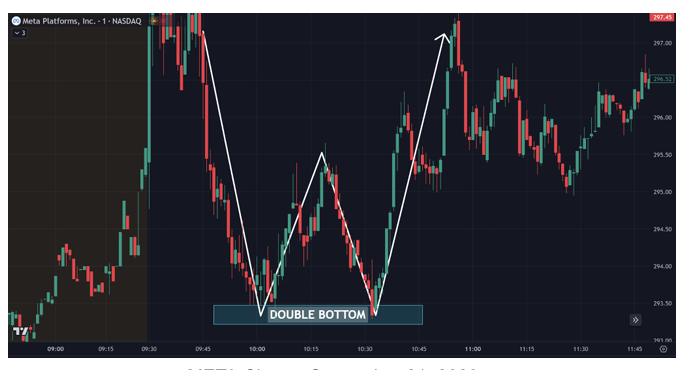
Look for bearish or bullish patterns that suggest a continuation/reversal
Volume
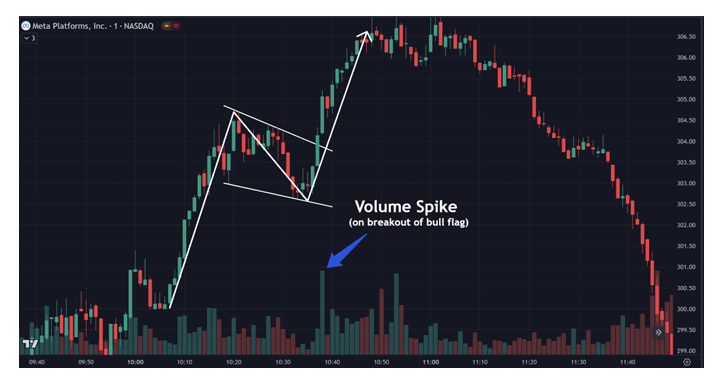
Higher volume during a breakout indicates a stronger move, meaning many other traders are interested in the breakout as well
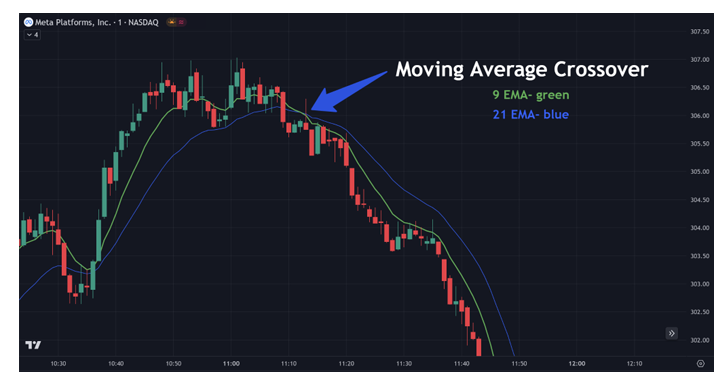
Indicators
Depending on the indicator, crossovers or divergences may indicate a reason to buy/sell
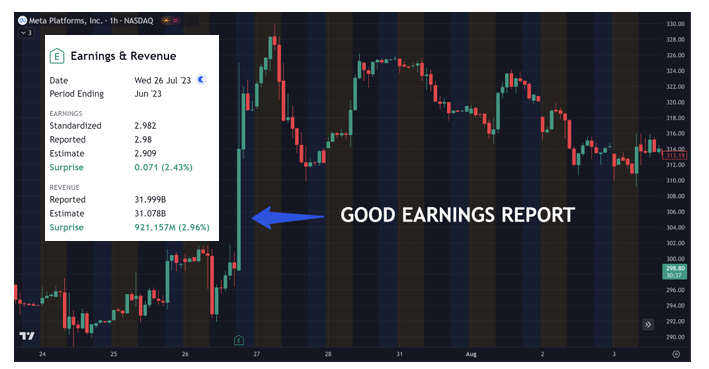
News
Major events can influence reactions. E.g. Good earnings report typically leads to a jump in price
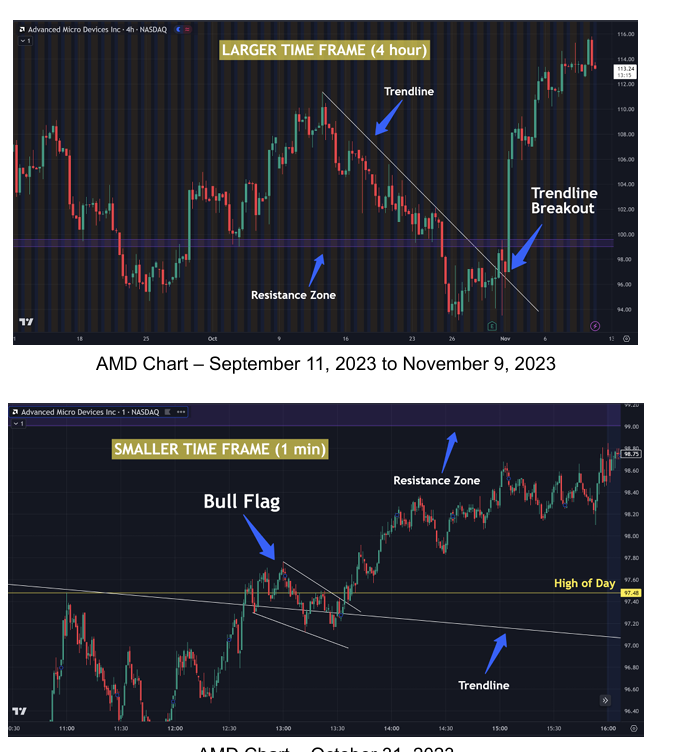
Time Frames
When the direction on bigger time frames match smaller time frames, there is a higher probability of trend direction. The 2nd picture is a zoomed in version of the 1st picture trendline breakout. The 1st picture shows a trendline breakout to the upside and 2nd picture shows a bullish pattern to the upside as well.
Confirmation
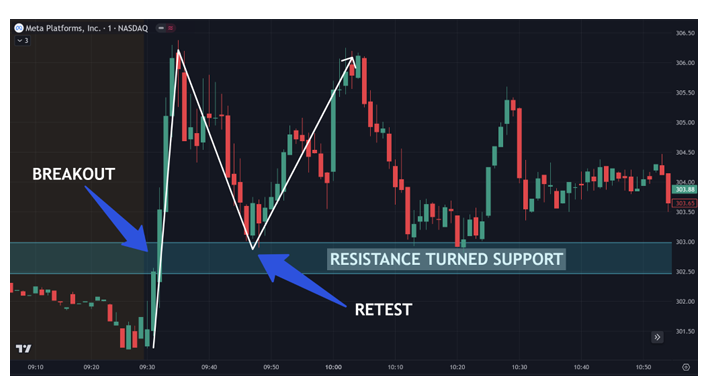
Wait for follow-up price movement for confirmation. Price may pull back after a breakout, retest the breakout area and then continue in the breakout direction