Class 12 (Unit 4)
1/29
There's no tags or description
Looks like no tags are added yet.
Name | Mastery | Learn | Test | Matching | Spaced |
|---|
No study sessions yet.
30 Terms
what intervals does the 68-95-99.7 rule use?
intervals are very “nice
how do we calculate not-so-nice intervals
use the statistical tables
how to read the statistical table
The numbers in the column under “z” at the left side of the page represent the whole number part and the first decimal place of z
The values in the row to the right of “z” represent the second decimal place of z
The value at the intersection of each row and column is the corresponding proportion to the left of z: (i.e. P(Z < z))
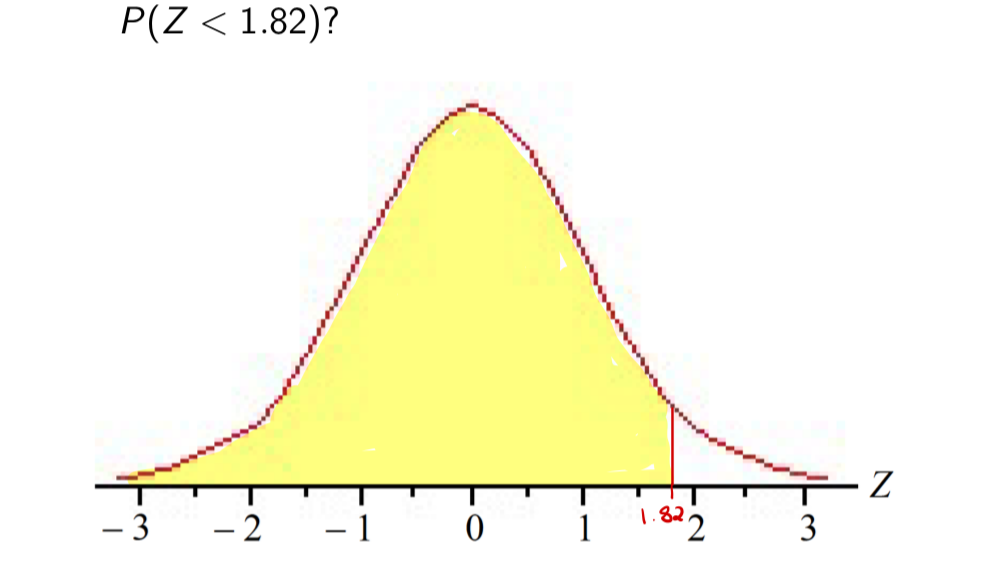
Example (Z < 1.82)
The entry at the intersection of 1.8 and 0.02 is 0.9656
This represents the exact proportion underneath the standard normal curve to the left of the value z = 1.82
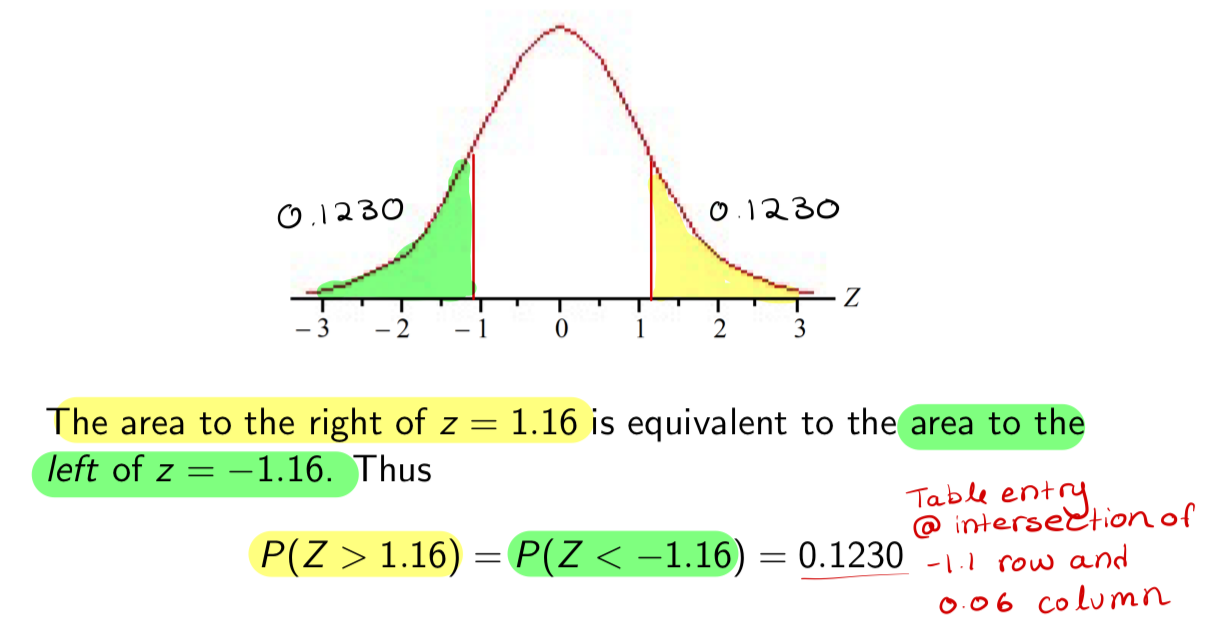
The proportional signs
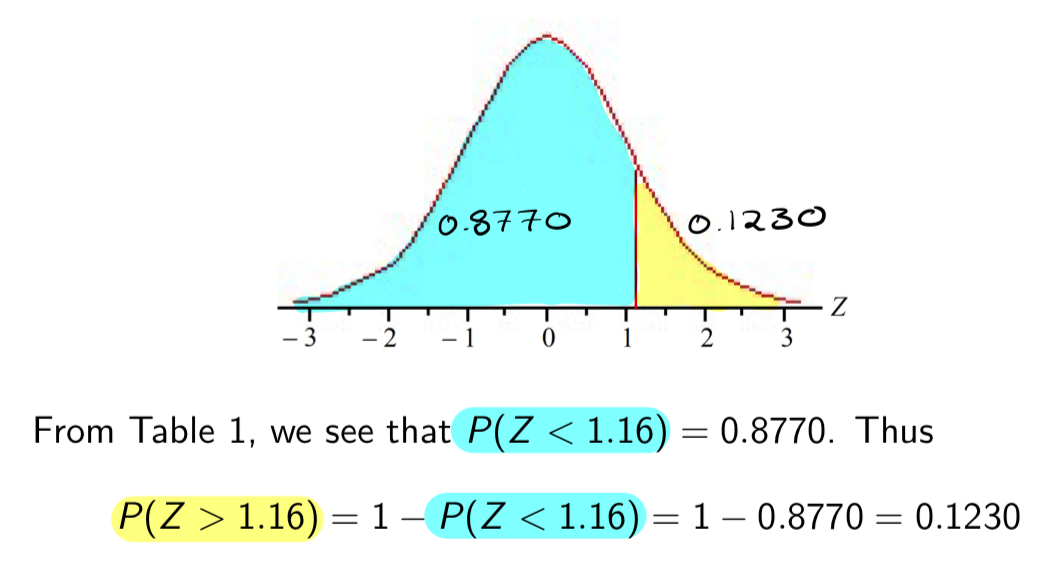
We cannot just take the proportion for the z = 1.16 entry in Table 1, because this gives us P(Z < 1.16) (i.e. the proportion to the left of 1.16). We want P(Z > 1.16), i.e. the proportion to the right!
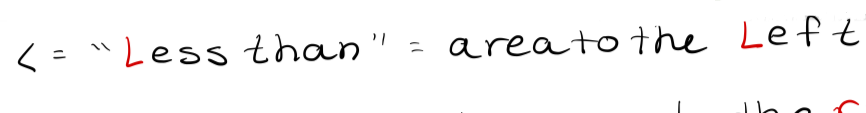
< (left)
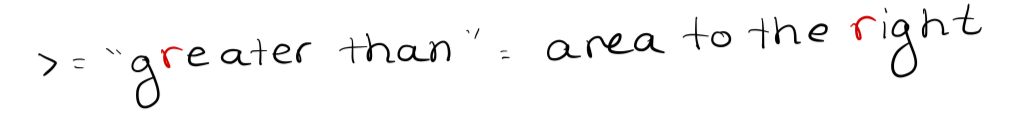
> (right)
< (left) {The proportional signs}
Less than = area to the left
> (right) {The proportional signs}
Greater than = area to the right
P(Z > 1.16) {symmetry}
P(Z > 1.16) {entire area under the curve = 1}
entire area under the curve = 1
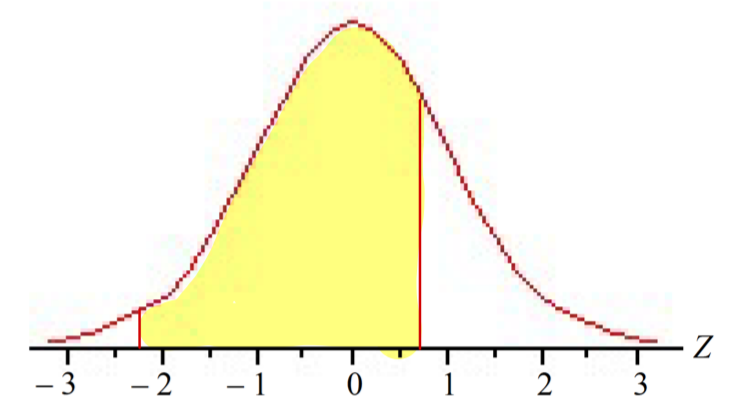
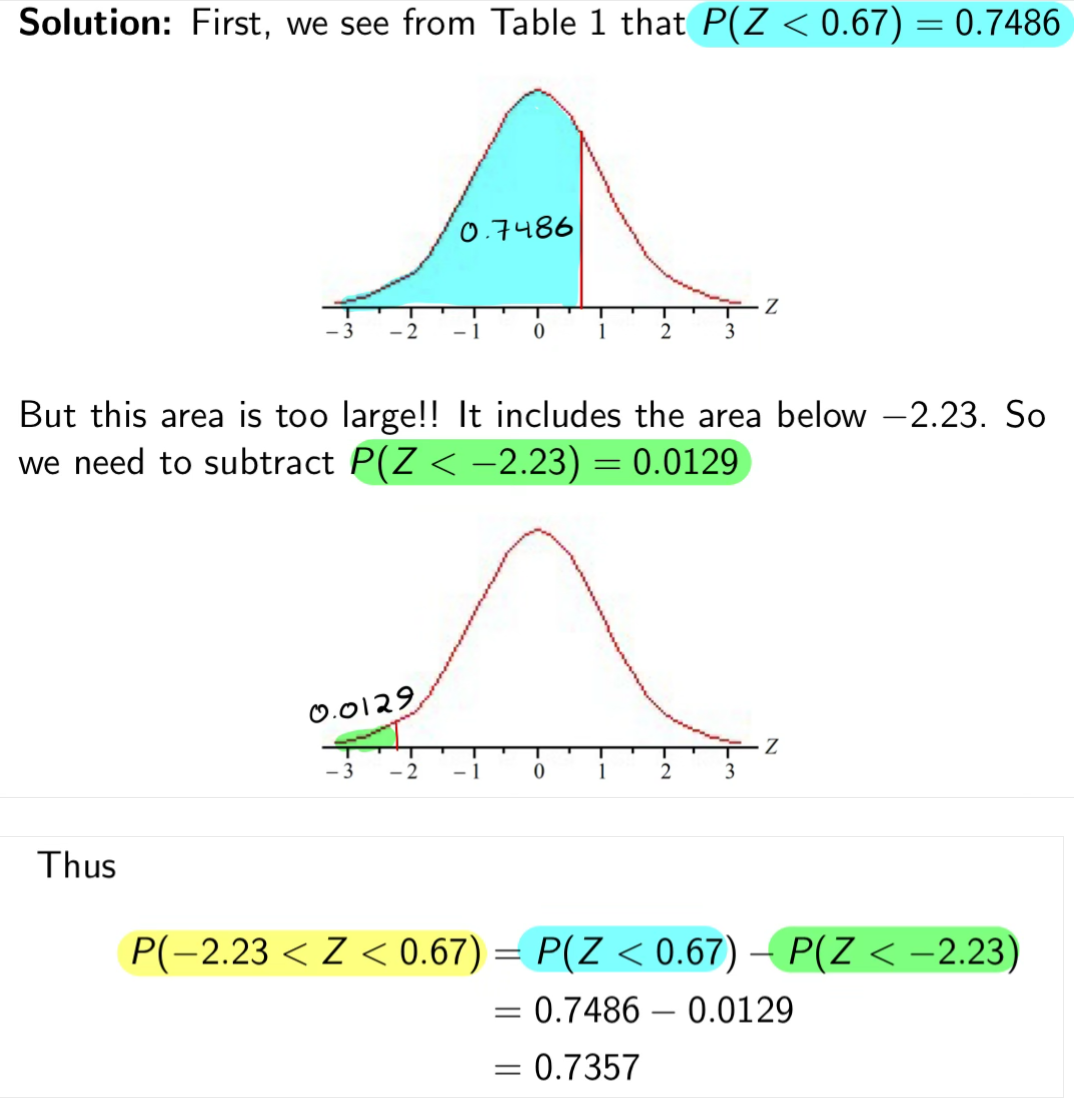
Example P( -2.23 < Z < 0.67)
To summarize: for any values b and c, where b ≤ c:
Our goal is always to rephrase the problem so that it only involves areas to the left (so that we can use Table 1)
P(Z < b) = table entry for z = b
P(Z > b) = 1 – P(Z < b), or P(Z > b) = P(Z < -b)
P(b < Z < c) = P(Z < c) — P(Z < b)
P(Z= b) = 0
What values does the table go out to?
values of z between -3.49 and 3.49
Why only values between -3.49 and 3.49?
This is because very close to 100% of the area under the standard normal curve falls within this interval In other words - for a normal distribution, we can expect nearly all observations to fall within 3.49 standard deviations of the mean
What are values of Z that fall outside of ± 3.49?
we can take proportions outside of this interval to be zero
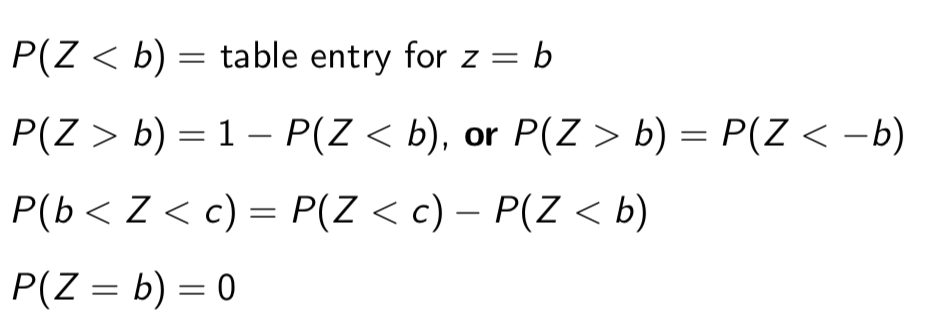
Example P(Z > 5.17)
0
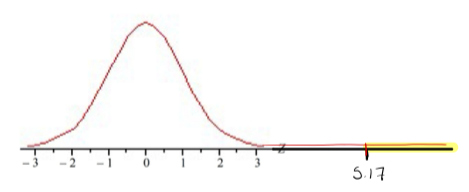
Example P (Z ≥ -6.22)
1
What did the 68-95-97.99 rule allow us to do?
The 68-95-99.7 rule provided only approximate values of P( -1 < Z < 1), P( -2 < Z < 2) and P( -3 < Z < 3)
What does the table 1 allow us to do?
find the exact values of these proportions
Finding proportions any interval for any normal distribution X ~ N(µ,σ)
We do this by standardizing X (i.e. converting it to Z ).
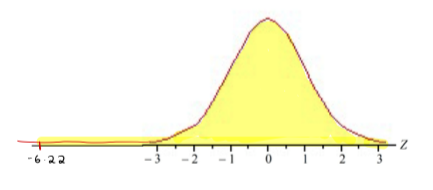
Example: Suppose it is known that pulse rates of adult females
follow a normal distribution with mean 74 beats per minute and
standard deviation 12 beats per minute
What proportion of adult females have pulse rates above 57
beats per minute?
To find this proportion, first standardize the pulse rate of 57 using the Z-score formula: Z = (X - µ) / σ, where X is 57, µ is 74, and σ is 12. Then, use the standard normal distribution table to find the corresponding area to the left of this Z-value and subtract it from 1 to get the proportion above 57 beats per minute.
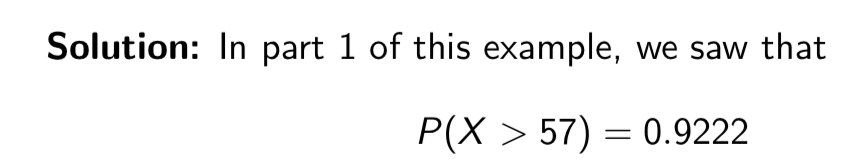
2. In a sample of 500 adult females, about how many would we expect to have a pulse rate over 57 beats per minute?
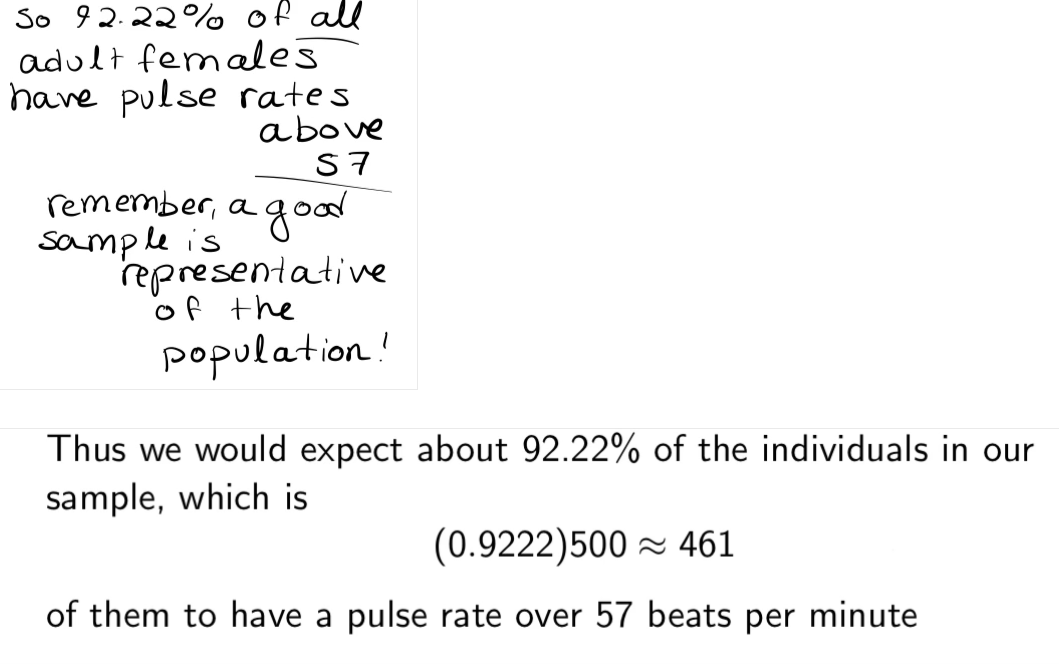
3. What proportion of adult females have pulse rates between 75 and 87 beats per minute?
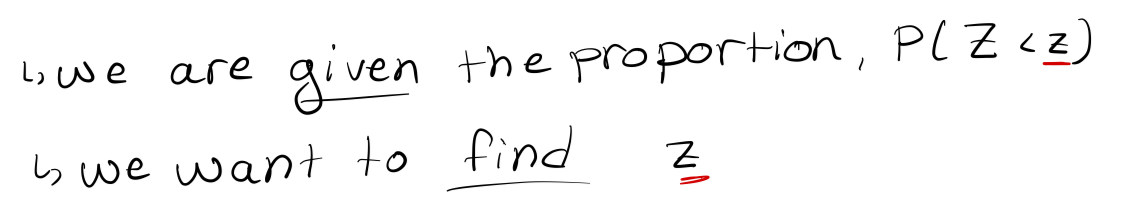
“Backwards” Normal - Percentiles
i.e. find the value z such that the proportion P(Z < z) is equal to some specified proportion.
To do so, we search the body of Table 1 for the specified proportion, and determine which value of z this proportion corresponds to
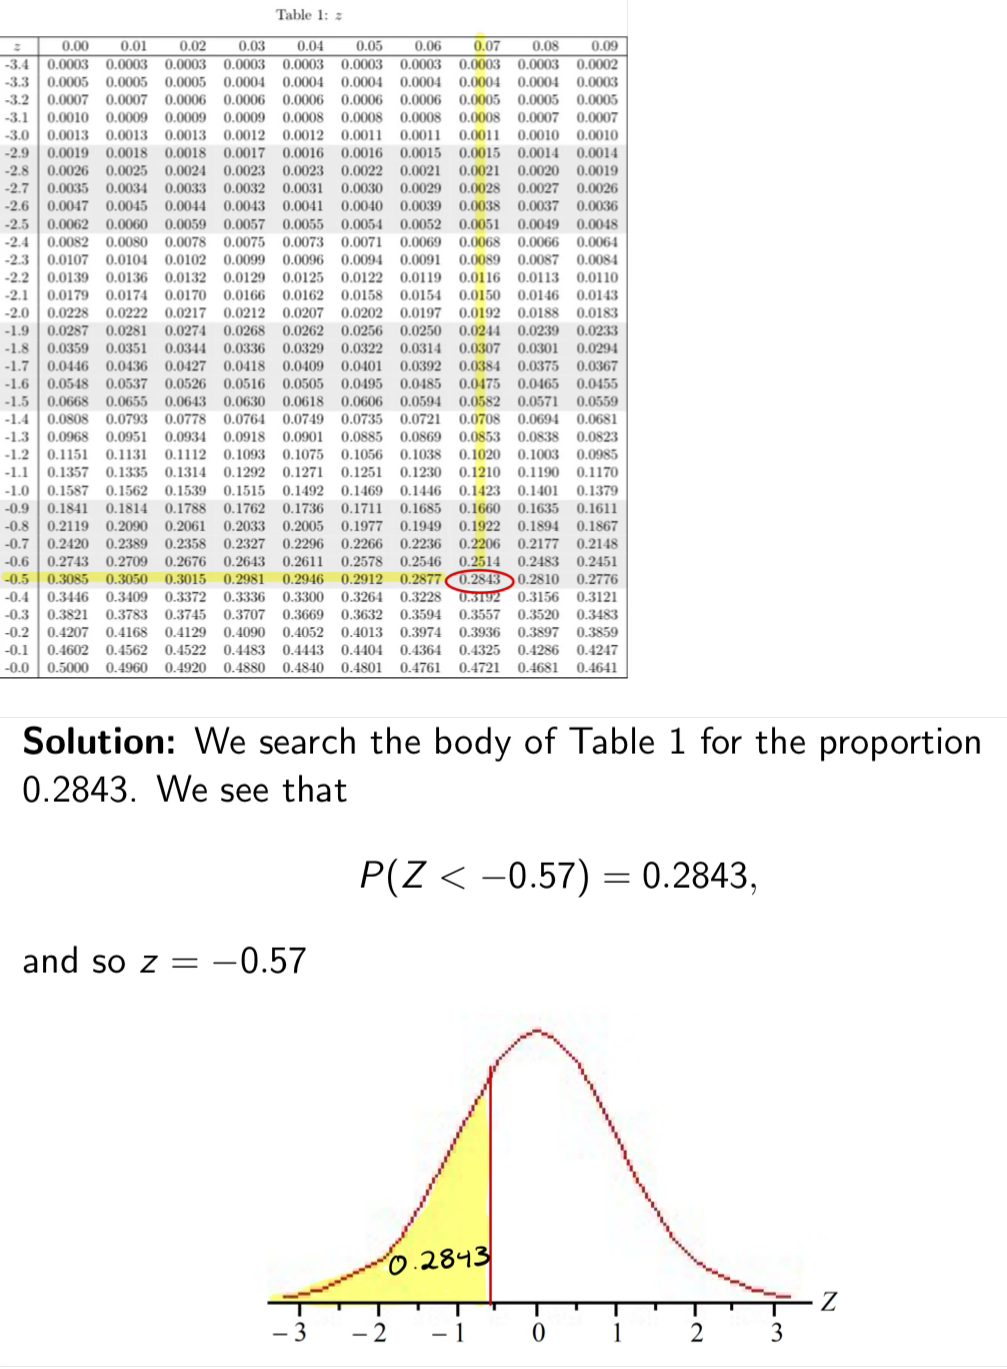
Example: Find the value z such that P(Z < z) = 0.2843
Note: We just found that 28.43% of observations are less than
z = -0.57. In other words, z = -0.57 is the 28.43-rd percentile of Z.
“Backwards” normal problems are really asking us to find
percentiles
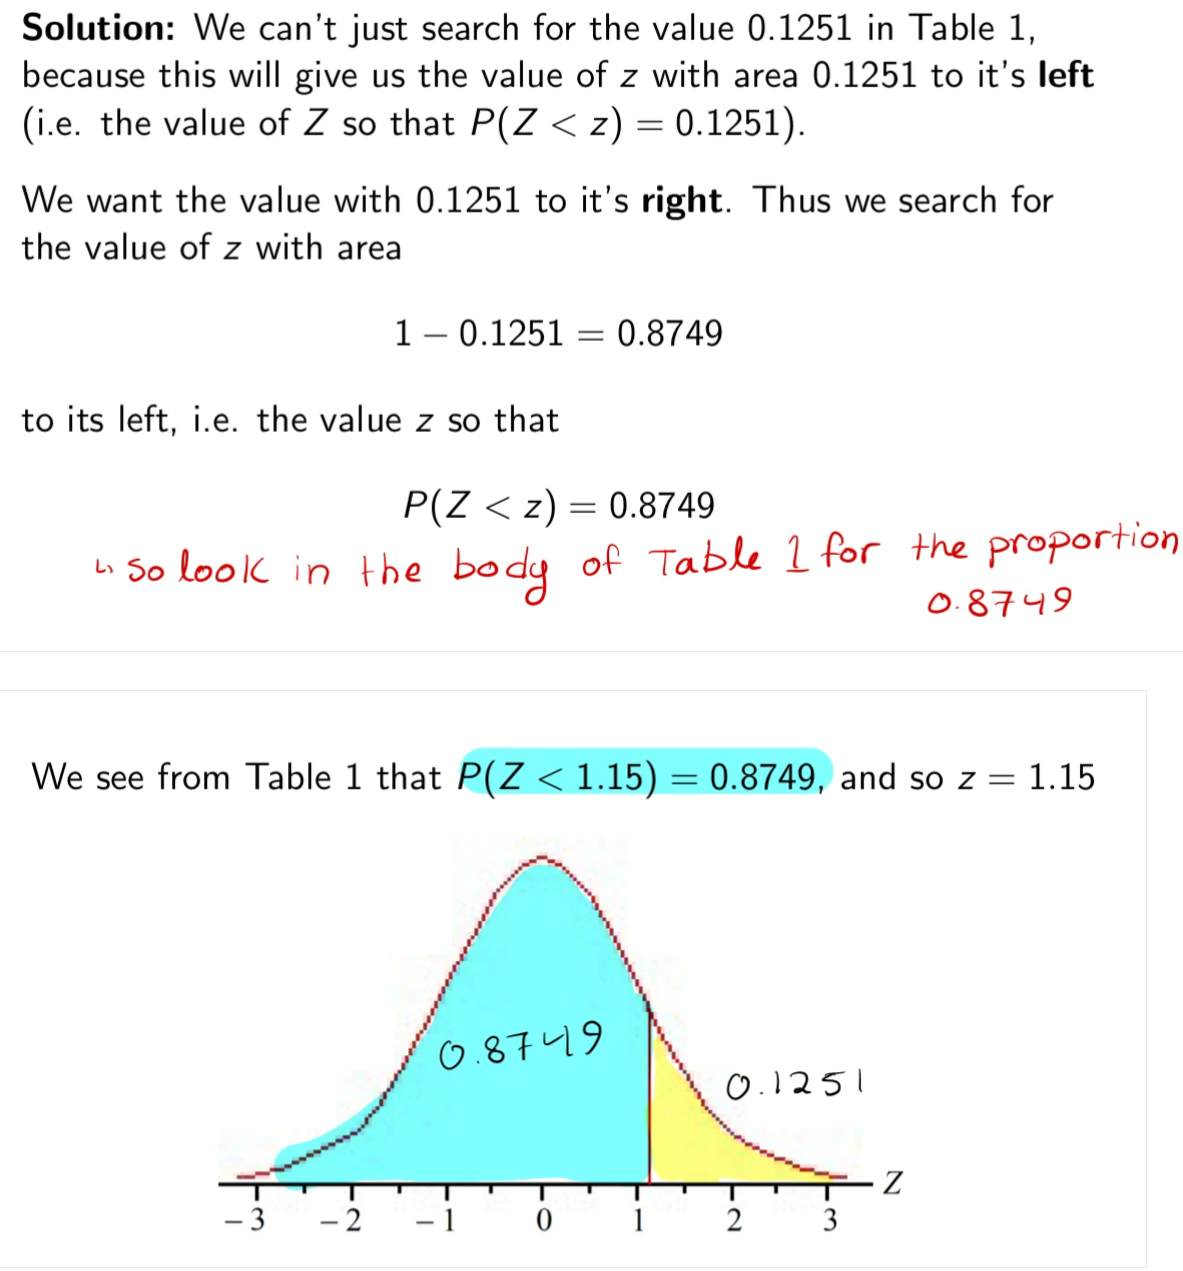
Example: Find the value z such that P(Z > z) = 0.1251
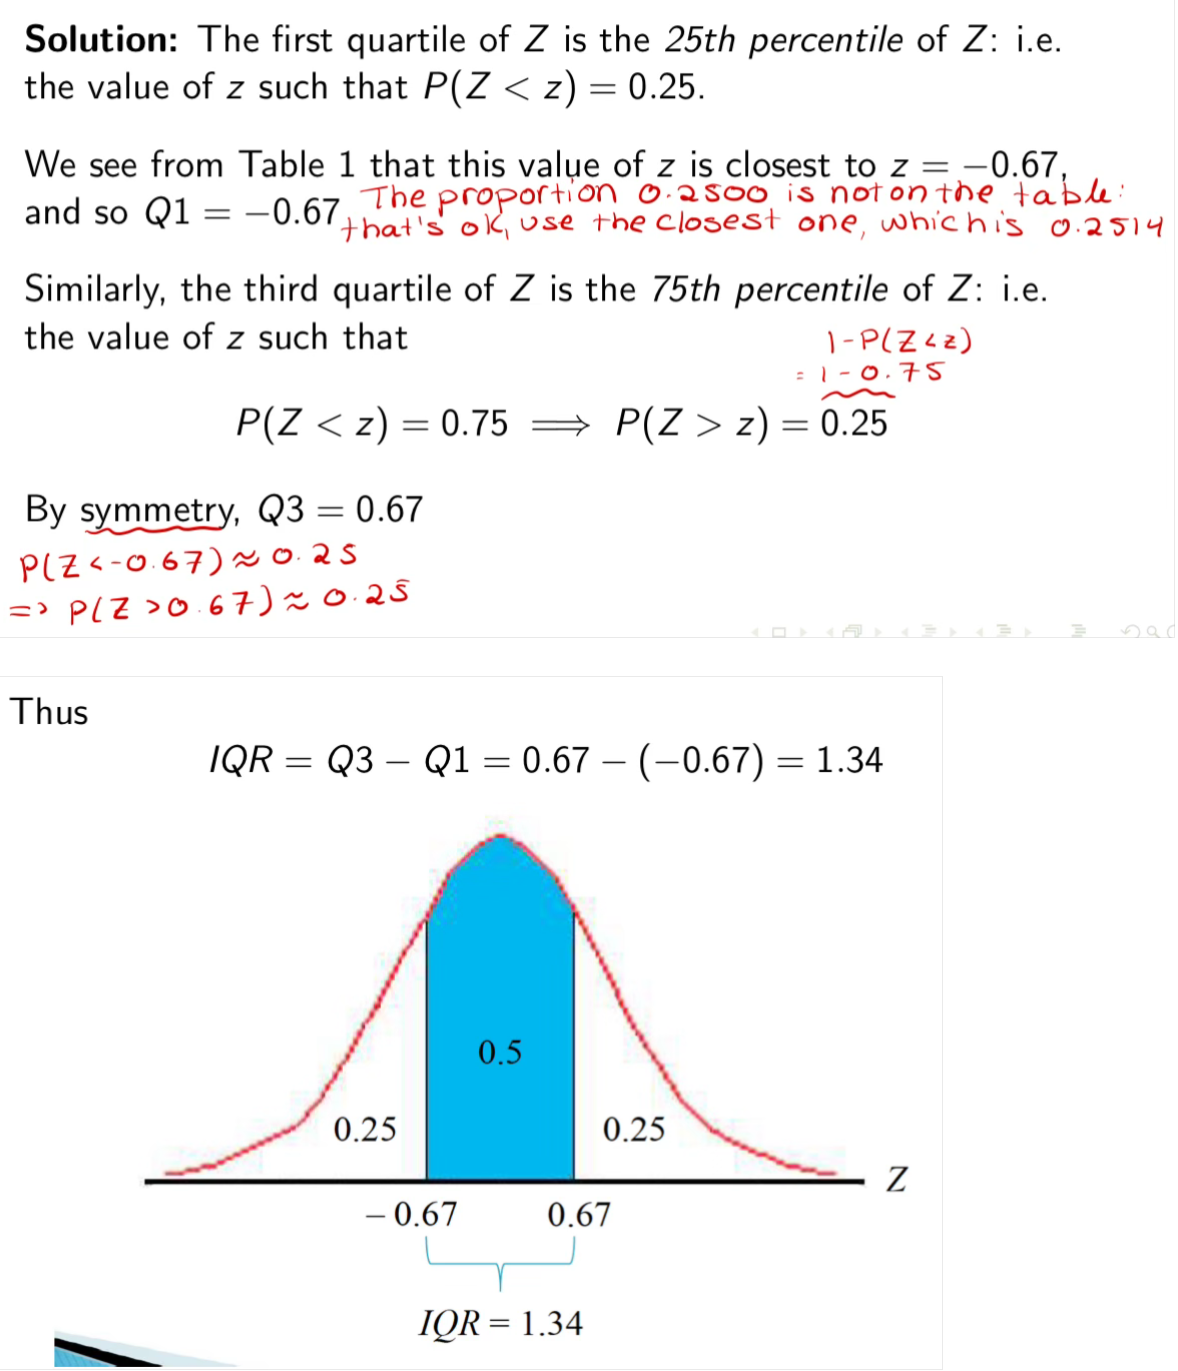
Example: Find the interquartile range of the standard normal distribution.
What to do if the actual value is not on the table
use the closest one, or if two tied = take average
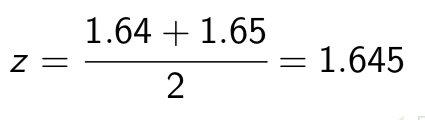
Note: If the desired proportion is not on the table, (class)
Then use the value of z corresponding to the closest proportion that is on the table.
If the desired proportion is exactly halfway between two proportions on the table, then take the average of the two z values on either side
Example: Suppose we’re looking for the value of z such that P(Z < z) = 0.95.
The proportion 0.95 is exactly halfway between the table entries for z = 1.64 (P(Z < 1.64) = 0.9495) and z = 1.65 (P(Z < 1.65) = 0.9505).
Thus we use the average of these two z values: