12ECON Ch 7 Macroeconomics and the Business Cycle
1/21
There's no tags or description
Looks like no tags are added yet.
Name | Mastery | Learn | Test | Matching | Spaced | Call with Kai |
|---|
No analytics yet
Send a link to your students to track their progress
22 Terms
What is macroeconomics and what does it focus on
. Macroeconomics is a branch of economics that studies the performance of the economy as a whole, how an overall economy behaves, and policies to improve its performance
—> It is the study of the aggregate (total) economic activity
—> the study of the business cycle
—> focuses on economic aggregates such as the total level of output, income and production (GDP), the total level of employment and overall price level
—> Overall, it is the relationship between spending, output and income at the aggregate (whole economy) level
2 important areas of macroeconomics
• Long-term economic growth
• Short-term business cycles (i.e., the business cycle)
Describe the history of macroeconomics including its age, and Keynes and Kuznets contributions
. Macroeconomics as a sub-branch is less than 100 years old
. John Maynard Keynes was key in modern-day macroeconomic theory, particularly around the focus on the theory of aggregate demand
—> Theory suggested that increases in spending by either the private or public sector, could be used to counteract economic depressions and recessions (i.e., the government had a key role to play in the economy)
. Simon Kuznets study and ideas led to the concept of GDP
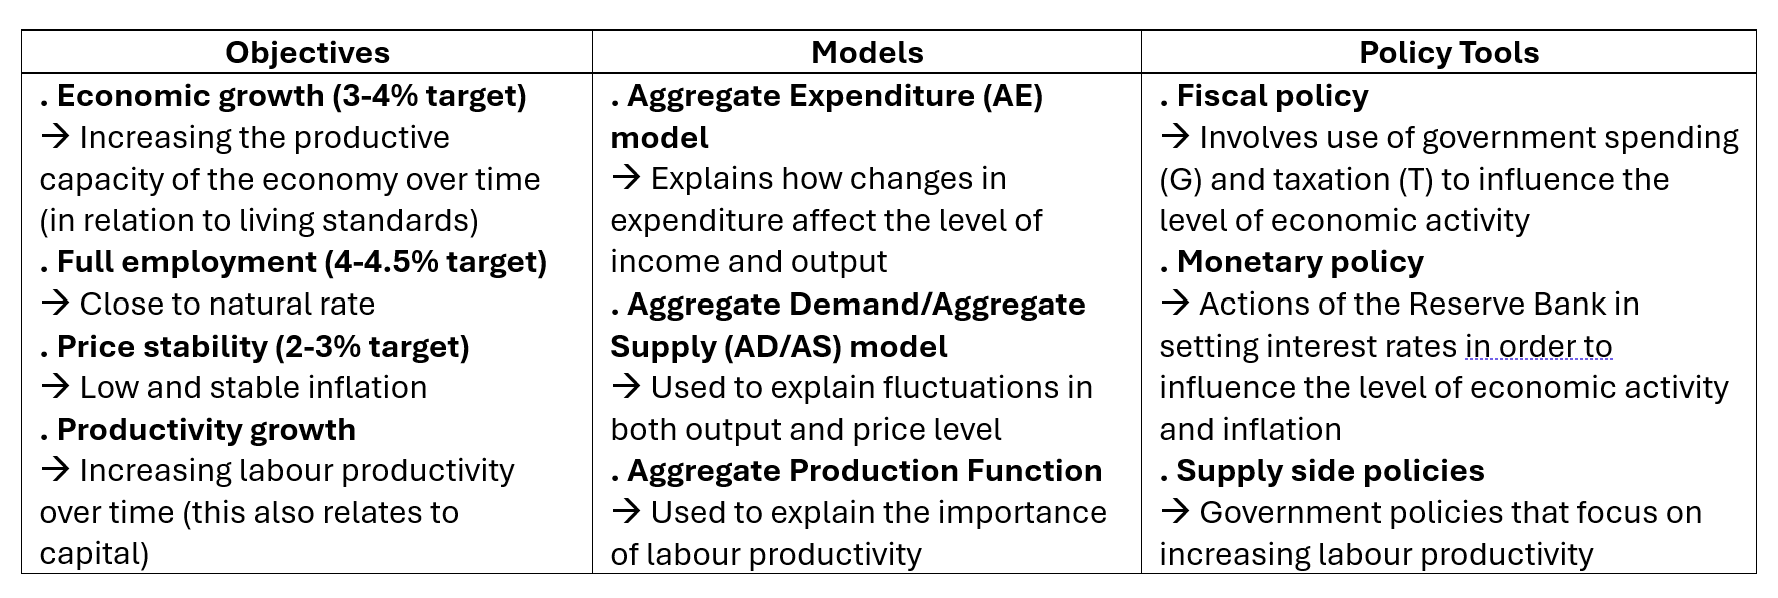
What are the macroeconomic objectives (4), models (3) and policy tools (3)
What is the business cycle
. refers to the pattern of and fluctuations in economic activity that occurs in an economy over a period of time around a long-term growth pattern
—> demonstrates the semi-predictable cyclical pattern of economic growth and economic contraction that occurs around the long-term growth rate
What is the key indicator for the business cycle
. The key indicator is real GDP (GDP adjusted for inflation)
Draw the business cycle model
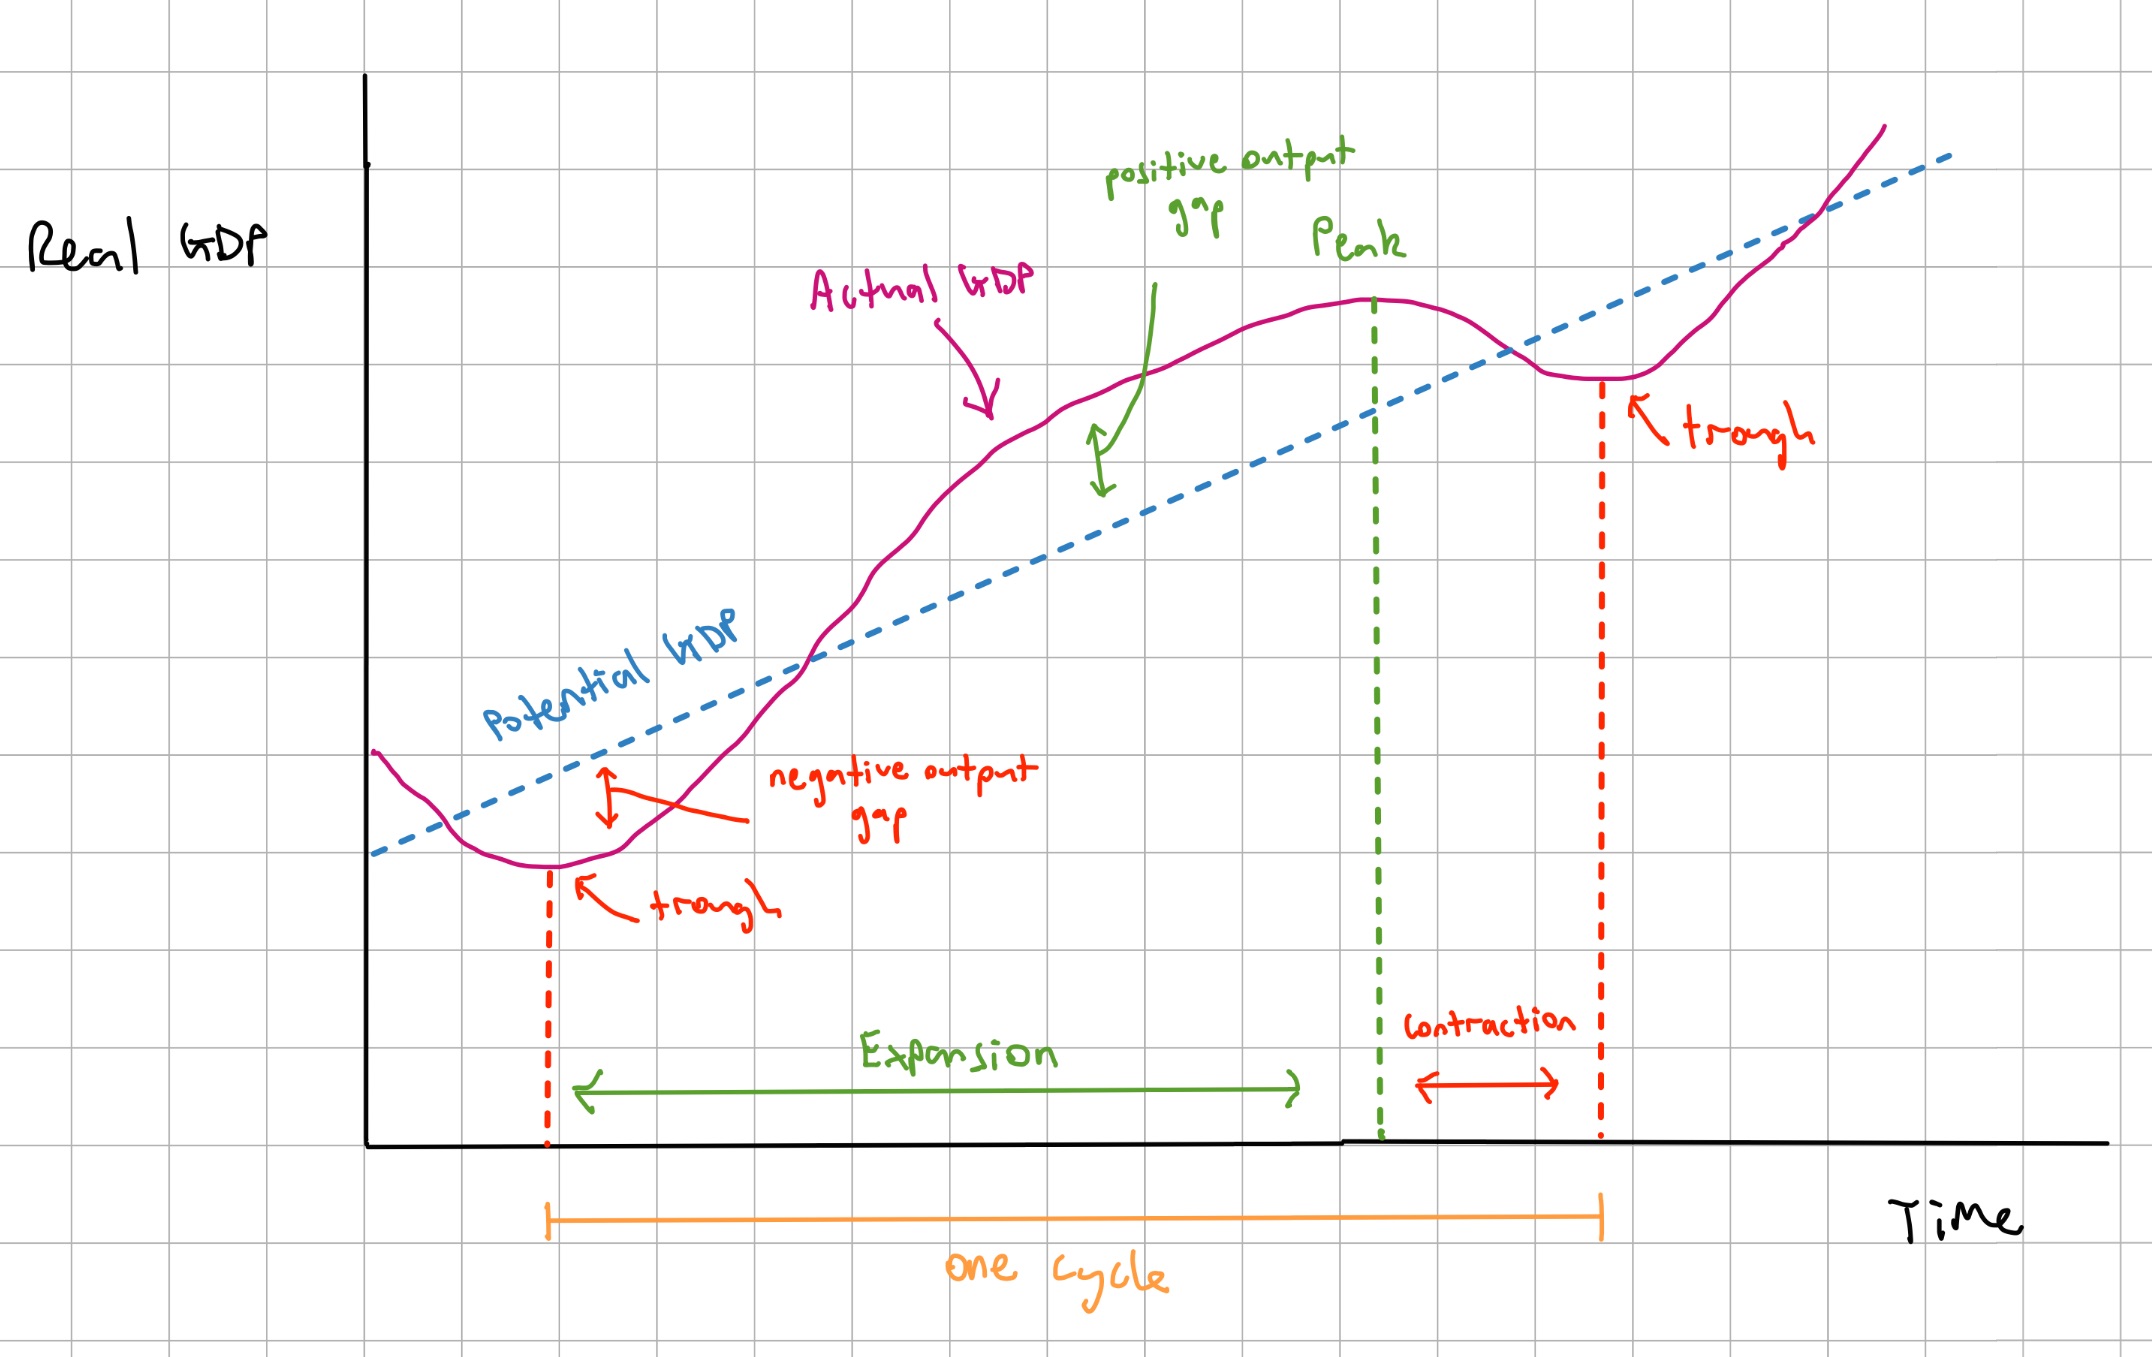
In relation to the business cycle, describe what potential GDP is, when it will increase, and what its growth rate is determined by
. Potential GDP is the maximum or full employment level of production that can be attained given the economy’s factors of production and level of technology
. If the quantity and/or quality (eg. education) of resources increase each year, then the level of potential of GDP will increase
. Growth rate of potential GDP can be determined by summing the annual growth rate of the labour force (factors of population growth and participation changes) and productivity (reflecting improvement in quality of labour and/or capital)
In relation to the business cycle, describe and account for the normal state for the economy, and what this translates to in the model
. The ‘normal’ state for the economy is to expand each year given the labour force usually grows between 1-2% and productivity grows between 1-2%
—> trend line of growth in the model has a positive slope and linear path
Describe what results in the fluctuations of the business cycle
. Actual real GDP fluctuates around the trend (line) which results in the business cycle
• Real GDP is above trend line (unemployment below natural rate) = positive output gap
• Real GDP is below trend line (unemployment above the natural rate) = negative output gap
State the 4 phases of the business cycle
. The business cycle has 4 phases:
• Expansion (upswing)
• Peak (upper-turning point)
• Contraction (downswing)
• Trough (lower-turning point)
A complete cycle in the business cycle
. One complete cycle is usually measured from a peak back to a peak (a peak, to a trough, to a peak)
Length of cycles in the business cycle
. Cycle implies regularity but contractions and expansions are unpredictable and their lengths vary
—> expansions (especially in Australia) are usually longer than contractions (eg. due to population growth, sustained commodity export demand, policy intervention)
Describe when business cycles are dated
. Business cycles are dated according to when the direction of economic activity changes – EG:
• Peak – last month before indicators (e.g., unemployment, output, retail sales) begin to fall
• Trough – last month before indicators begin to rise
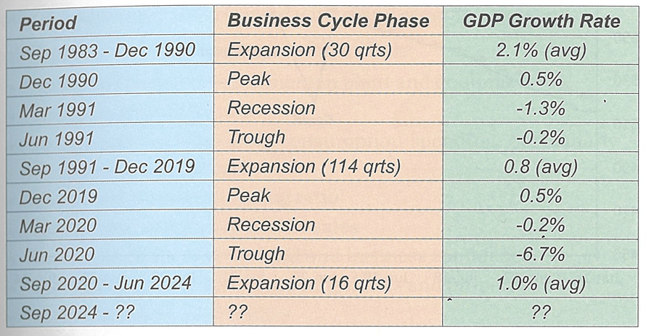
Describe the business cycle fluctuations for Australia from 1983 to 2024
. The table highlights the different business cycle phases for the Australian economy since September 1983
. In this period, there were two recessions totaling four quarters, and there were three expansion periods totaling 160 quarters (shown in the table up until June 2024 – has been in expansion since as well)
State the 2 ways Australia’s actual business cycle can be illustrated
. can be measured in 2 different ways:
the level of real GDP
the growth rate of real GDP
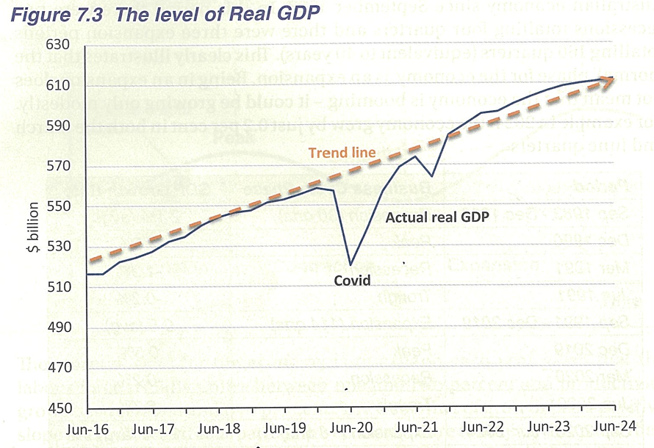
Describe and demonstrate the ‘level of real GDP’ method of illustrating Australia’s business cycle
. Figure 7.3 is the change of in the level of quarterly real GDP from June 2016 to June 2024
—> Actual real GDP stays close to the trend line with the exception of the period associated with the Covid-19 pandemic (2020-21) – this was a major negative shock to the economy
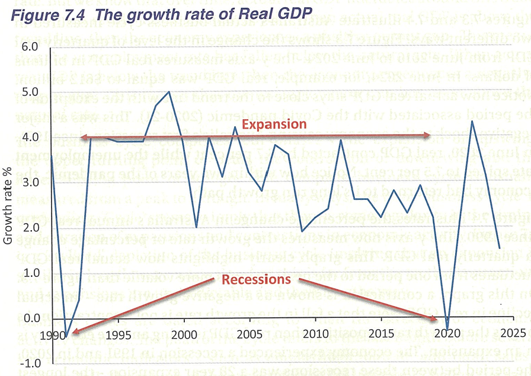
Describe and demonstrate the ‘growth rate of real GDP’ method of illustrating Australia’s business cycle
. Figure 7.4 is the percentage change in Australia’s annuals real GDP since 1990
• The graph highlights how actual real GDP fluctuates from one period to the next – it looks more volatile
• On this graph, a contraction is shown as a negative growth rate (i.e., actual decline in real GDP)
• KEY: fall in the growth rate is not a contraction – positive growth if even lower than the previous quarter is still positive economic growth
• The economy experiences a recession in 1991 and in 2020 (recession – 2 negative quarters of economic growth) – the period between these points was a 28-year expansion which was the biggest of any economy since 1900
What is the expansion phase of the business cycle
. a period when economic output increases – more goods and services are being produced in the economy
. Occurs with the first of 2 consecutive quarters of real GDP growth
. During an expansion, economic activity increases
Expansion phase characteristics and overall impact
• Increased employment
• Increase in inflation (demand-pull inflation) —> can also lead to cost-push inflation in a boom where firms raise wages to attract workers, increasing their cost of production
• Increased business investment in plant and equipment
• Rising household income
• Rising levels of household consumption spending (particularly discretionary items)
• Decreased household saving ratio
• Rising retail and motor vehicle sales
• Increased levels of household and business confidence
• Increasing asset prices, including shares and property
• Higher business profitability
• Increasing labour market participation
• Falling cyclical unemployment
. Overall: improvement in living standards and economic prosperity
What is the contraction phase of the business cycle
. a period when economic output decreases – less goods and services are being produced in the economy
. Occurs when the growth rate of GDP in an economy is negative
Contraction phase characteristics and overall impact
• Decreased employment
• Decrease in inflation (demand-pull) – disinflation (inflation still positive but at a lower than previous rate)
—> In prolonged contractions it may result in deflation (negative inflation rate)
• Decreased business investment in plant and equipment
• Falling household income
• Falling levels of household consumption spending (particularly discretionary items)
• Increased household saving ratio
• Falling retail and motor vehicle sales
• Decreased levels of household and business confidence
• Decreasing asset prices, including shares and property
• Falling business profitability (increased bankruptcies)
• Decreasing labour market participation
• Rising cyclical unemployment
. Overall: decline in living standards and economic prosperity