Survivorship Curve
1/6
There's no tags or description
Looks like no tags are added yet.
Name | Mastery | Learn | Test | Matching | Spaced | Call with Kai |
|---|
No analytics yet
Send a link to your students to track their progress
7 Terms
Survivorship curve
Diagram showing the number of surviving members over time from a measured set of births and the life history of a species
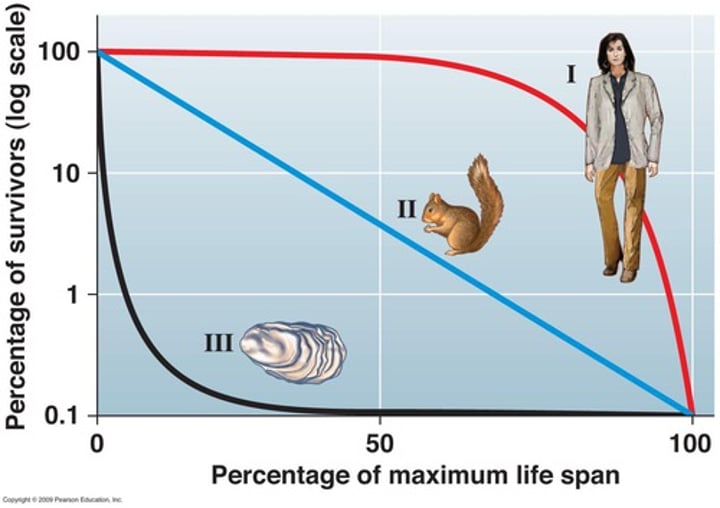
Type 1
Common for large animals, low infant mortality, high parental care, usually a long life span

Type 2
Birds, small mammals, reptiles, equal chance of dying at all ages, low parental care

Type 3
Invertebrates, fish, plants, amphibians, tons of babies but most die quickly, some survive by chance, no parental care
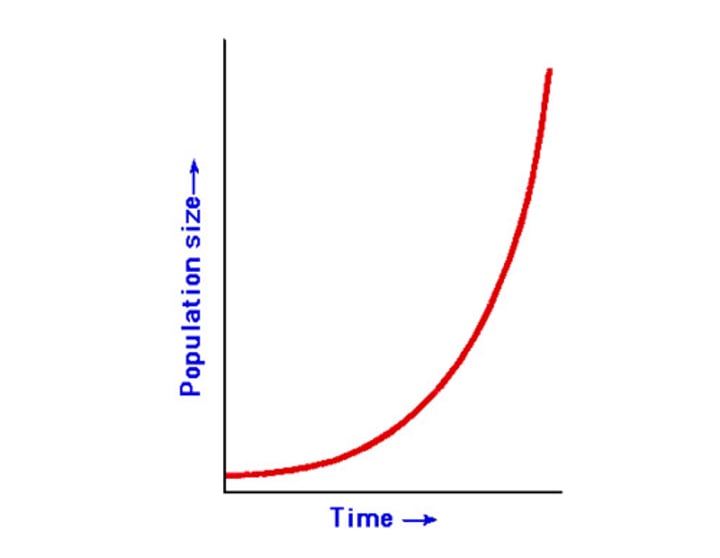
Exponentially
Nearly all populations will tend to grow ... As long as there are resources available
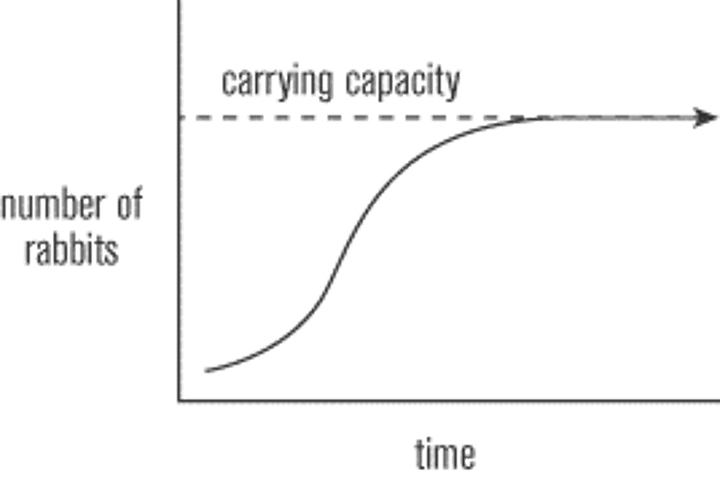
Logistic model
This models declining resources available to populations as they grow
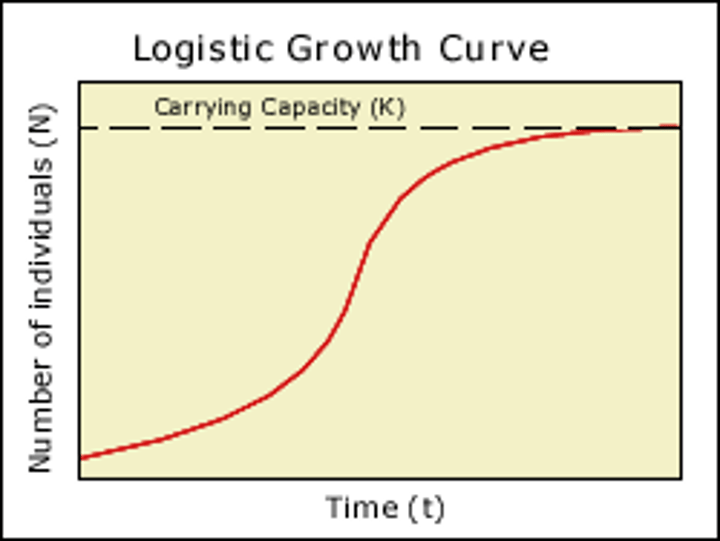
Carrying capacity
The number of organisms of species that can support indefinitely