POLSC 193 Midterms
1/61
Earn XP
Description and Tags
Save Me
Name | Mastery | Learn | Test | Matching | Spaced |
|---|
No study sessions yet.
62 Terms
What are the parts of a research proposal?
introduction
problem statement / motivation
research questions
significance and objectives
scope and limitations
review of related literature and research framework
methodology
Survey Research
a method data collection in which information is obtained directly from individual persons who are selected so as to provide a basis for making inferences about some larger population. used to ask respondents about their respective behaviors, attitudes, beliefs, opinions, characteristics, expectations, self-classification, and knowledge
Descriptive and Inferential
two types of statistics
What are the Fundamental Ethical Principles?
respect for persons
beneficence
justice
How do we protect our research participants?
using an Informed Consent Form
What are the levels of measurement?
Qualitative/Categorical
Nominal: numbers or symbols are assigned to a set of categories for the purpose of naming, labeling, or classifying observations; cannot be ranked-ordered
Ordinal: nominal levels that can be ranked from low to high; does NOT include the magnitude of differences between numbers
Quantitative
Interval-Ratio: all cases are expressed in the same units
INTERVAL: equal intervals = equal differences
RATIO: like interval, but ratios if scores must also make sense
Measurement Error
Differences in the values assigned to cases that are attributable to anything other than real differences; random vs systematic errors
Reliability
assessment of how stable the values the measure yields are; suggests that repeated, stable outcomes are the same under identical of similar conditions
Improving Reliability
clearly conceptualize all constructs; increase the level of measurement; use multiple indicators of a value; use pre-tests, pilot studies, and replication
Validity
Refers to how well the conceptual and operational definitions mesh with each other: the better the fit, the greater the measurement validity; the extent to which our measures correspond to the concepts they are intended to reflect
Types of Validity
Face Validity
A judgment by the scientific community that the indicator really measures the construct
Content Validity
Is the full content of a definition represented in a measure?
Construct Validity
Internal: infer validity of the indicator from its relationship to other indicators of the same concept using multiple indicators
External: infer validity of the indicator from its relationship to indicators of other concepts to which the concept being measured should theoretically be related
Survey Research
the purpose is to discover relative incidence, distribution, and interrelations of sociological and psychological variables (Kerlinger 1986)
defined as “the collection of information from a sample of individuals through their responses to questions” (Check & Schutt, 2012)
method of data collection in which information is obtained directly from individual persons who are selected so as to provide a basis for making inferences about some larger population
often in the form of a structured questionnaire
Surveys can be used to/for…
Describe. Surveys can be used to describe and summarize phenomena. The goal is to get a precise measurement of such phenomena.
Causal Explanations. Surveys measure associations between variables.
in statistics, we are looking for CORRELATION, not causation
Evaluation. Surveys can be useful for determining the degree to which a desired objective is attained as a result of a planned intervention.
Prediction. Survey data can be used to forecast future events.
Survey Research steps?
purpose & objective
target population
data gathering techniques
sampling
data gathering proper
data cleaning and processing
data analysis
report writing
Advantages of a survey research design?
inferences are not based on theory or dogma but it is based on facts
ensures greater objectivity and reliability
important aspect is its versatility
cost-effective
Weaknesses of a survey research design?
its reliability and validity is based on the honesty and efficiency of the researcher
mostly based on samples, so there is always a possibility of sampling error
as data is collected from primary sources, the feasibility depends upon the willingness and cooperation of the respondent
there is a possibility of response error, due to respondents’ untrue/misleading answers
Quantitative Research Questions
inquire about the relationships among variables that the investigator seeks to know
hypotheses are predictions the researcher makes about the expected outcomes of relationships among variables
follows from a test of theory, and the specifications of research questions or hypotheses follow from the relationship among variables in the theory
use the same pattern of word order in the questions or hypotheses to enable a reader to easily identify the major variables
independent and dependent variables must be measured separately, and not measured on the same concept (to ensure falsifiability of hypotheses)
What type of research asks the question: How are the variables distributed?
Descriptive
What type of research asks the question: How are the variables related?
Descriptive-Explanatory
What type of research asks the question: Why are the variables distributed and related this way?
Explanatory
Null Hypothesis (H0)
a statement of “no difference” or “no relationship” that contradicts the alternative hypothesis and is always expressed in terms of population parameters
there are no differences between two groups or there is no observed differences between the two populations
there is no correlation/relationship between two variables
Conceptual Definition
a careful, systematic definition of a construct that is explicitly written to clarify one’s thinking
often linked to other concepts or theoretical statements (Neuman, 2014)
Operational Definition
definition of a variable in terms of the specific activities to measure or indicate it with empirical evidence (Neuman, 2014)
Frequency Distributions
a summary of the responses to the categories of a variable
can be used for all levels of measurements, with reservations
Examples of missing variables?
the participant…
skipped the question
didn’t know what to put
put down NAP, NA/NI, DK
What are the measures of central tendency?
mean
median
mode
Mode
most frequently occurring value in a distribution
abbreviated as mo
only measure of central tendency appropriate for nominal-level variables
Bimodal
sometimes there is more than one mode
Formula for position of the Median?
(N+1)/2
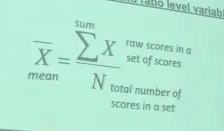
Mean
the average score
only appropriate for interval and ratio level variables
How do you find the mean?
divide the sum of the raw scores in a set of scores with the total number of scores in a set
Range
the difference between the highest and lowest scores in a distribution
How do you find the range?
R = H - L
R = range
H = highest score in a distribution
L = lowest score in a distribution
Grouped Frequency Distribution
condensing the separate scores into a number of smaller categories or groups, each containing more than one score value
Class Interval
a way of categorizing data (in 5s, 10s, etc.); preferably a whole number
Class Limits
located at the point halfway between adjacent class intervals and serves to close the gap between them
formula: (HL - LL)/K
K = number of classes
HL = higher limit; LL = lower limit
Proportions and Percentages
a way of standardizing the frequency distributions for size, when you want to compare the distribution of responses between groups
formula: P = f/N
f = frequency
N = total number of cases
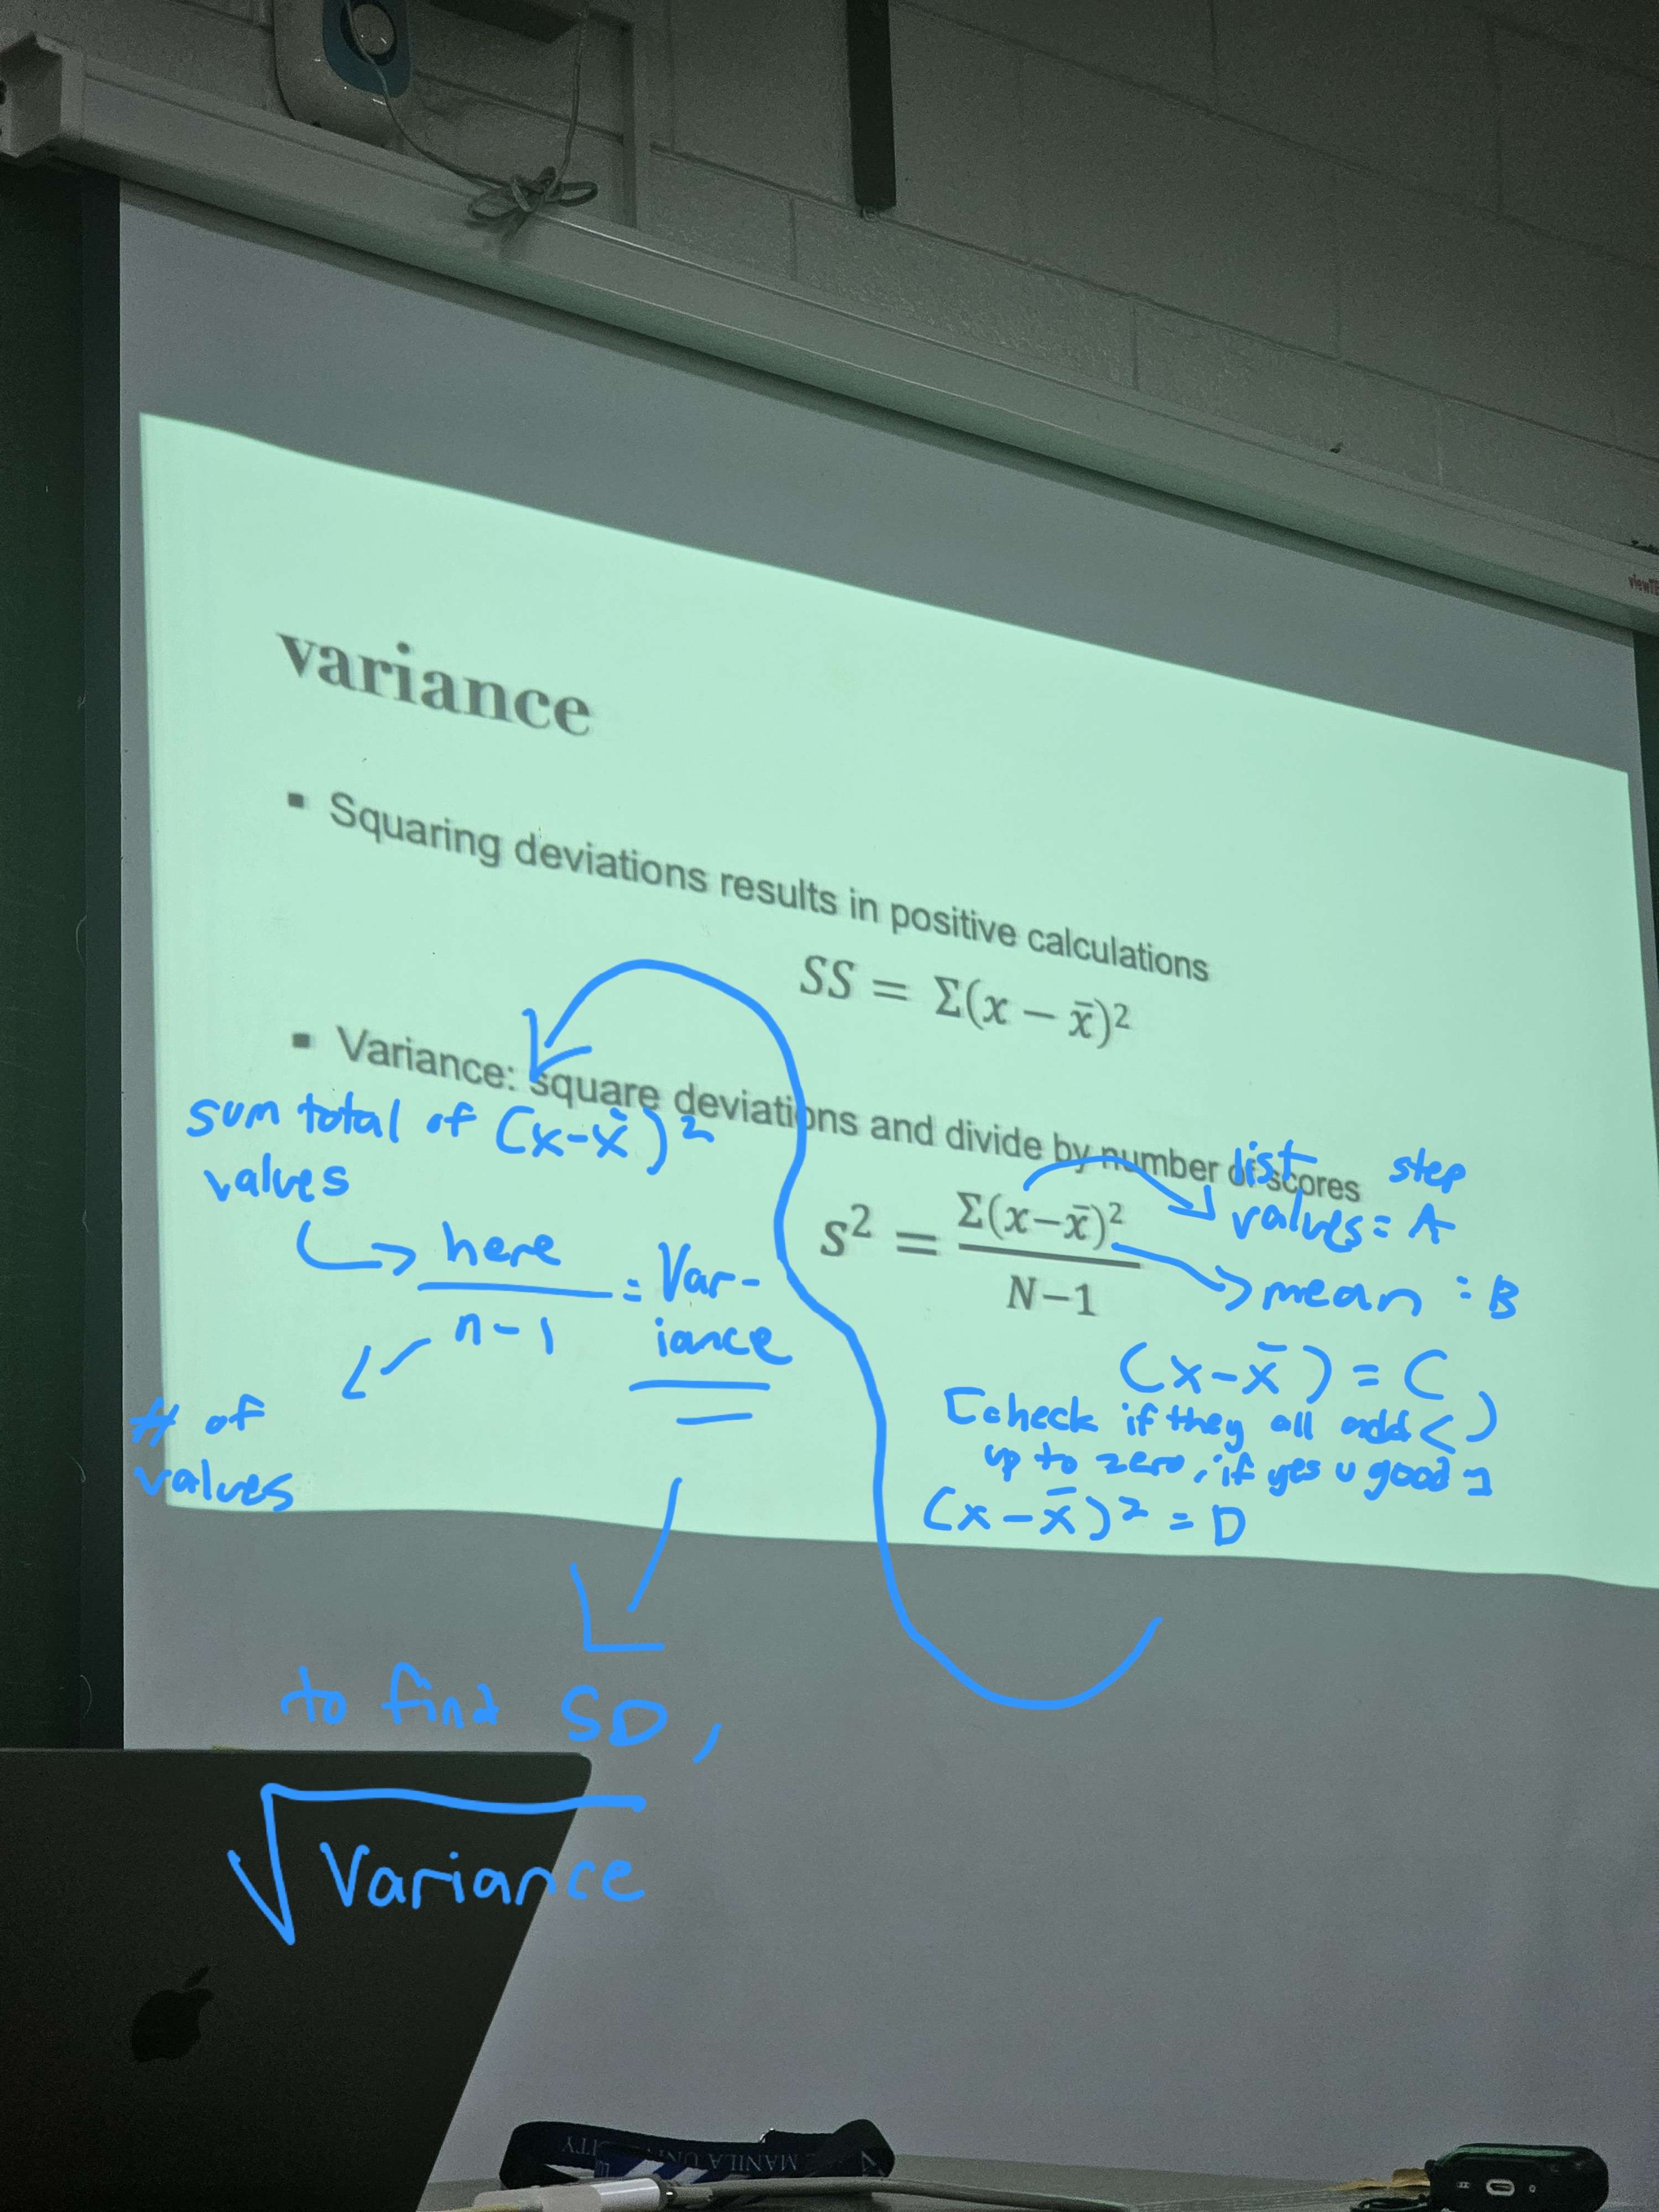
Variance
squaring deviations results in positive calculations
just… just look at the image man
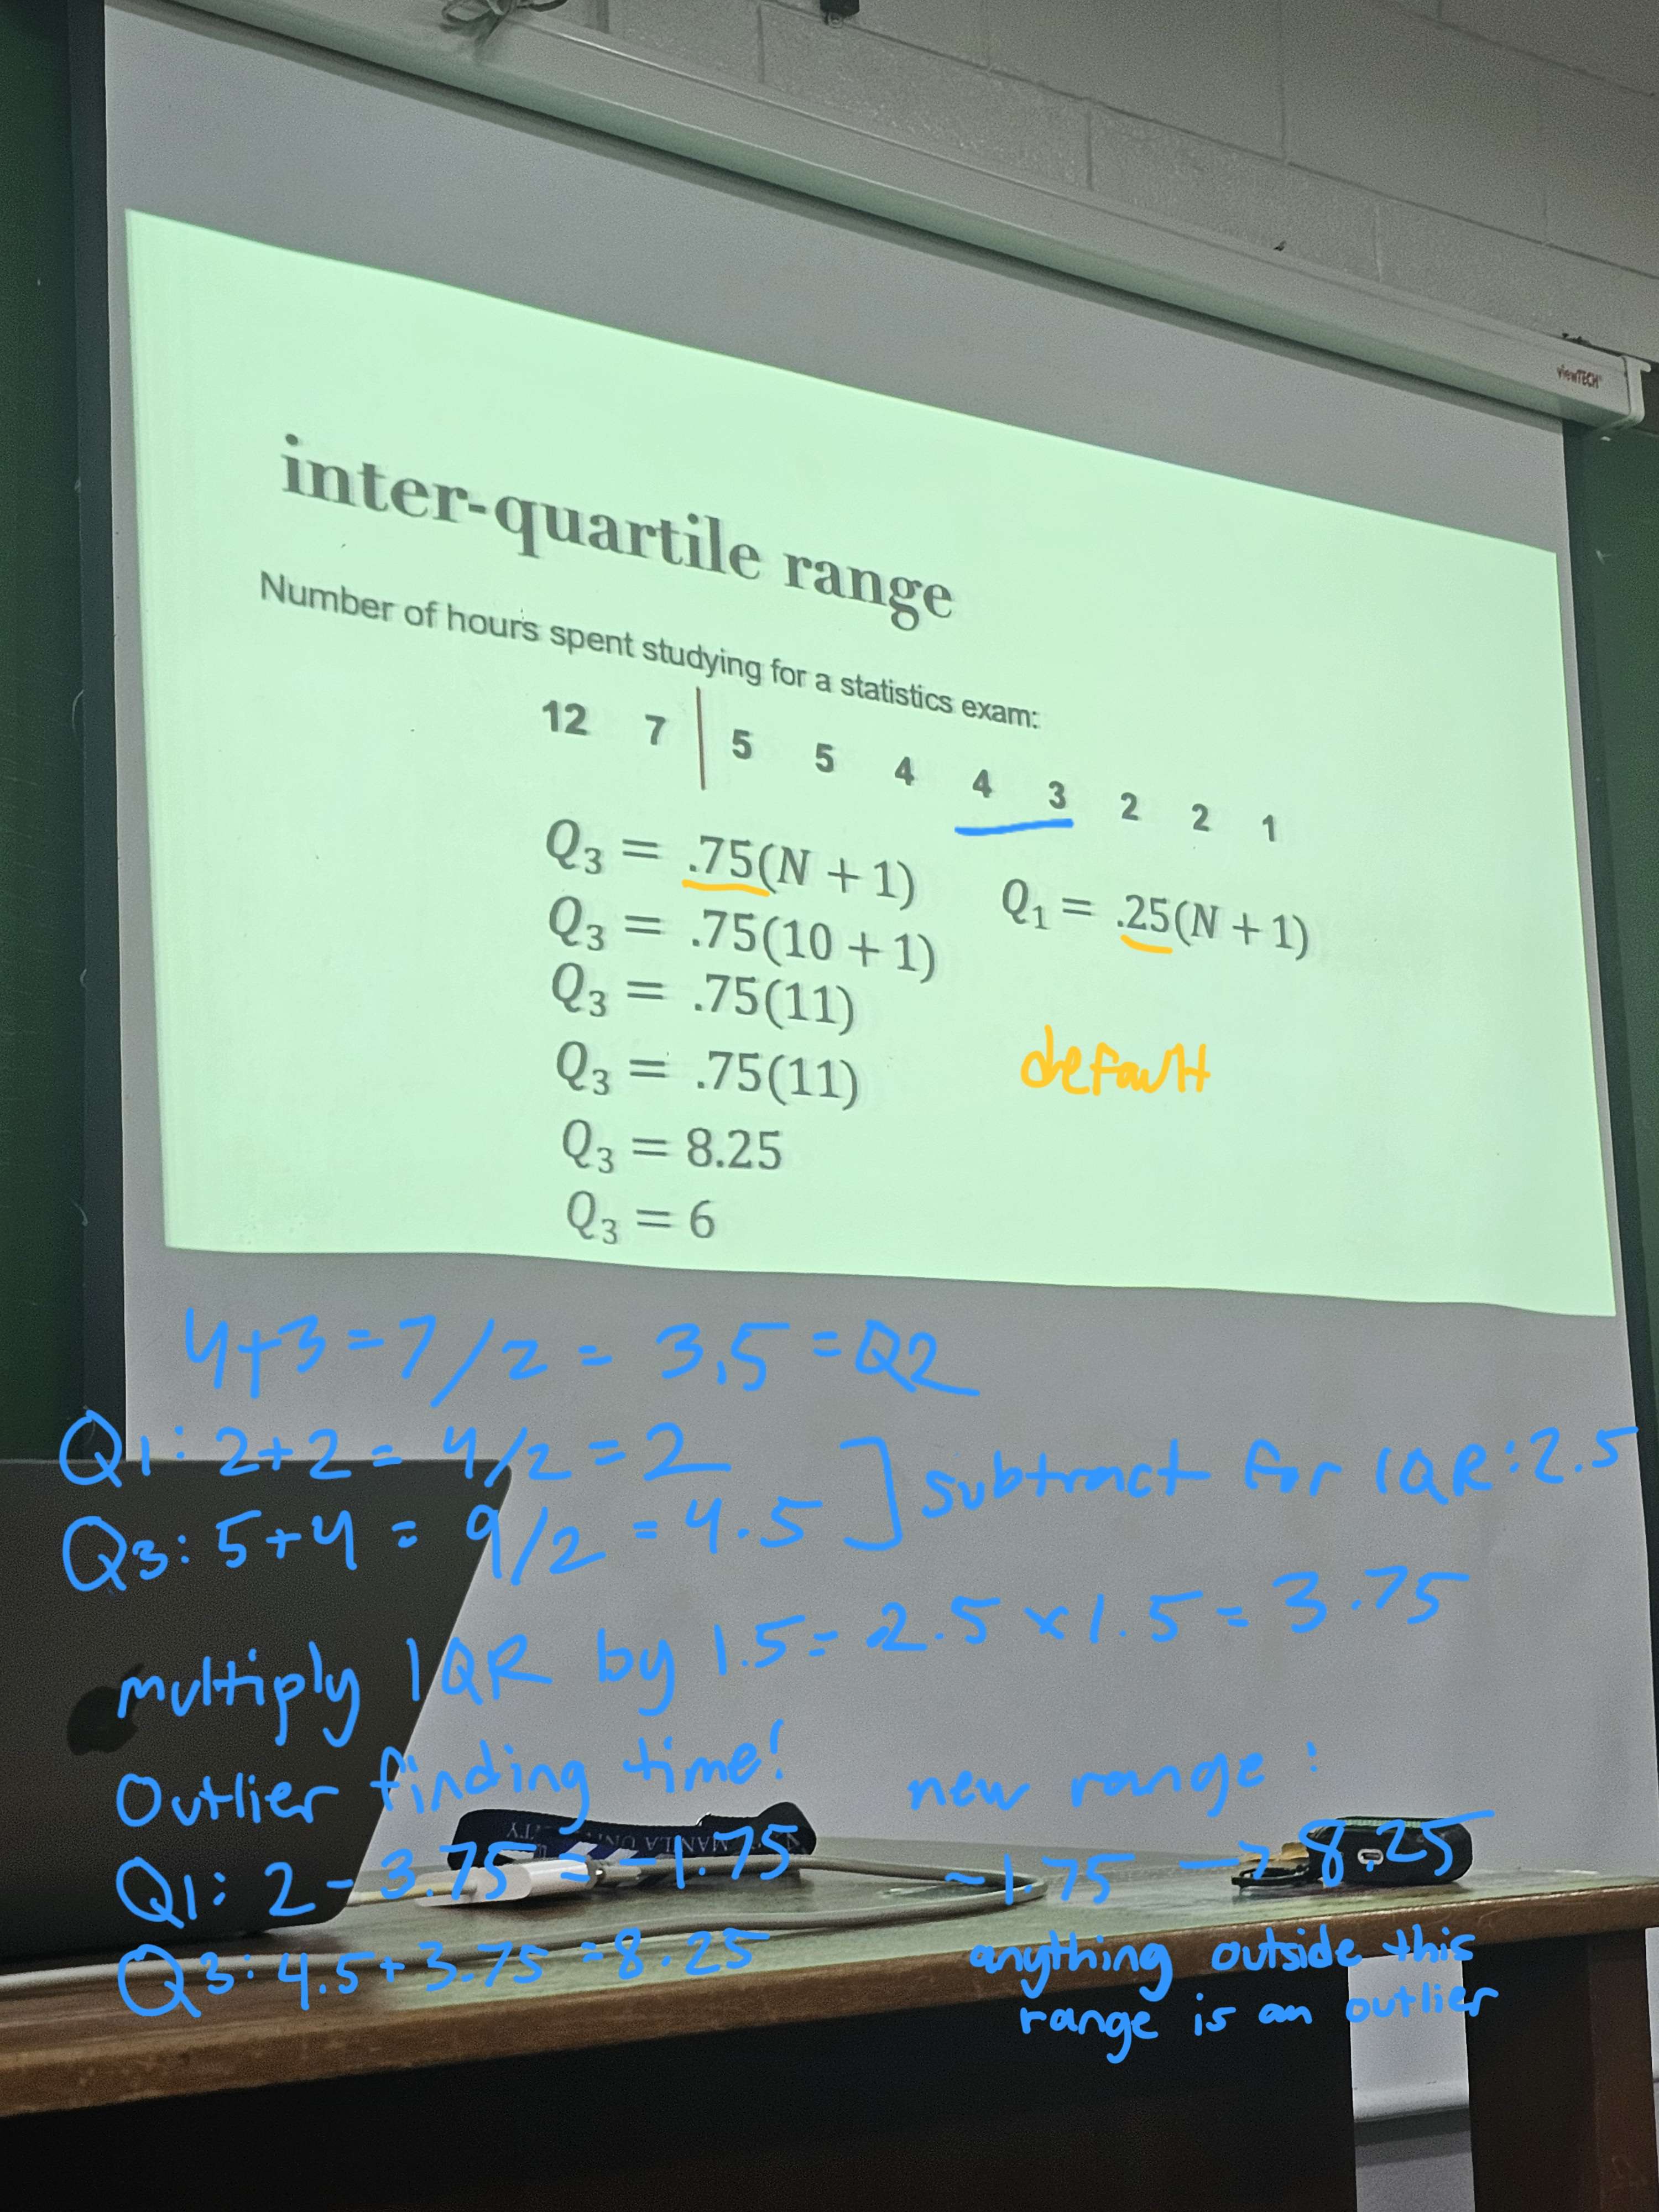
Inter-quartile range
anak ng butiki…
Inferential Statistics
population = consists of a set of individuals who share at least one characteristic; the entire group that you want to draw conclusions about
sample = a smaller number of individuals from the population; a specific group of individuals that you will collect data from
Two Types of Sampling
probability sampling
involves the equal probability of selection method (or EPSEM)
allows us to make stronger and more reliable statistical inferences from sample to population
non-probability sampling
involves non-random selection methods, which allows us to easily gather data
used when sampling frames are not available
making inferences and predictions is not possible
Types of Probability Sampling
simple random sampling
stratified random sampling
multi-stage cluster random sampling
Types of Non-probability Sampling
convenience sampling
purposive sampling
quota sampling
snowball sampling
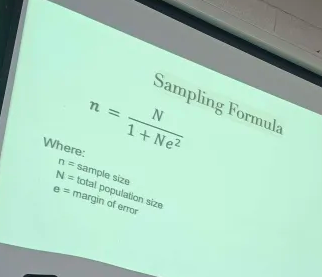
Sampling Formula
n = N/(1+Ne²)
n = sample size
N = total population size
e = margin of error
Simple Random Sampling
obtain a list of the population
assign a unique identifying number to each name
with eyes closed, “enter” the table of random numbers
move in any direction and, depending on how you assigned a number to your list of population, take the names corresponding to the numbers selected
Stratified Random Sampling
involves dividing the population into strata (homogenous subgroups)
proportionate vs disproportionate
Multi-stage Cluster Random Sampling
used to minimize costs of large surveys
random sampling of a primarily unit (e.g. barangays, residential buildings, etc.) and then random sampling of members within the cluster
Convenience Sampling
includes the individuals who happen to be the most accessible to the researcher
or participants volunteer their participation
Purposive Sampling
logic, common sense, or sound judgement can be used to select a sample
Quota Sampling
like stratified sampling, individuals are divided into sub-groups and then judgement is used to select respondents based on a quota
Snowball Sampling
referral system; drawing (future) samples based on network of existing respondents
can be linear or discriminative snowball
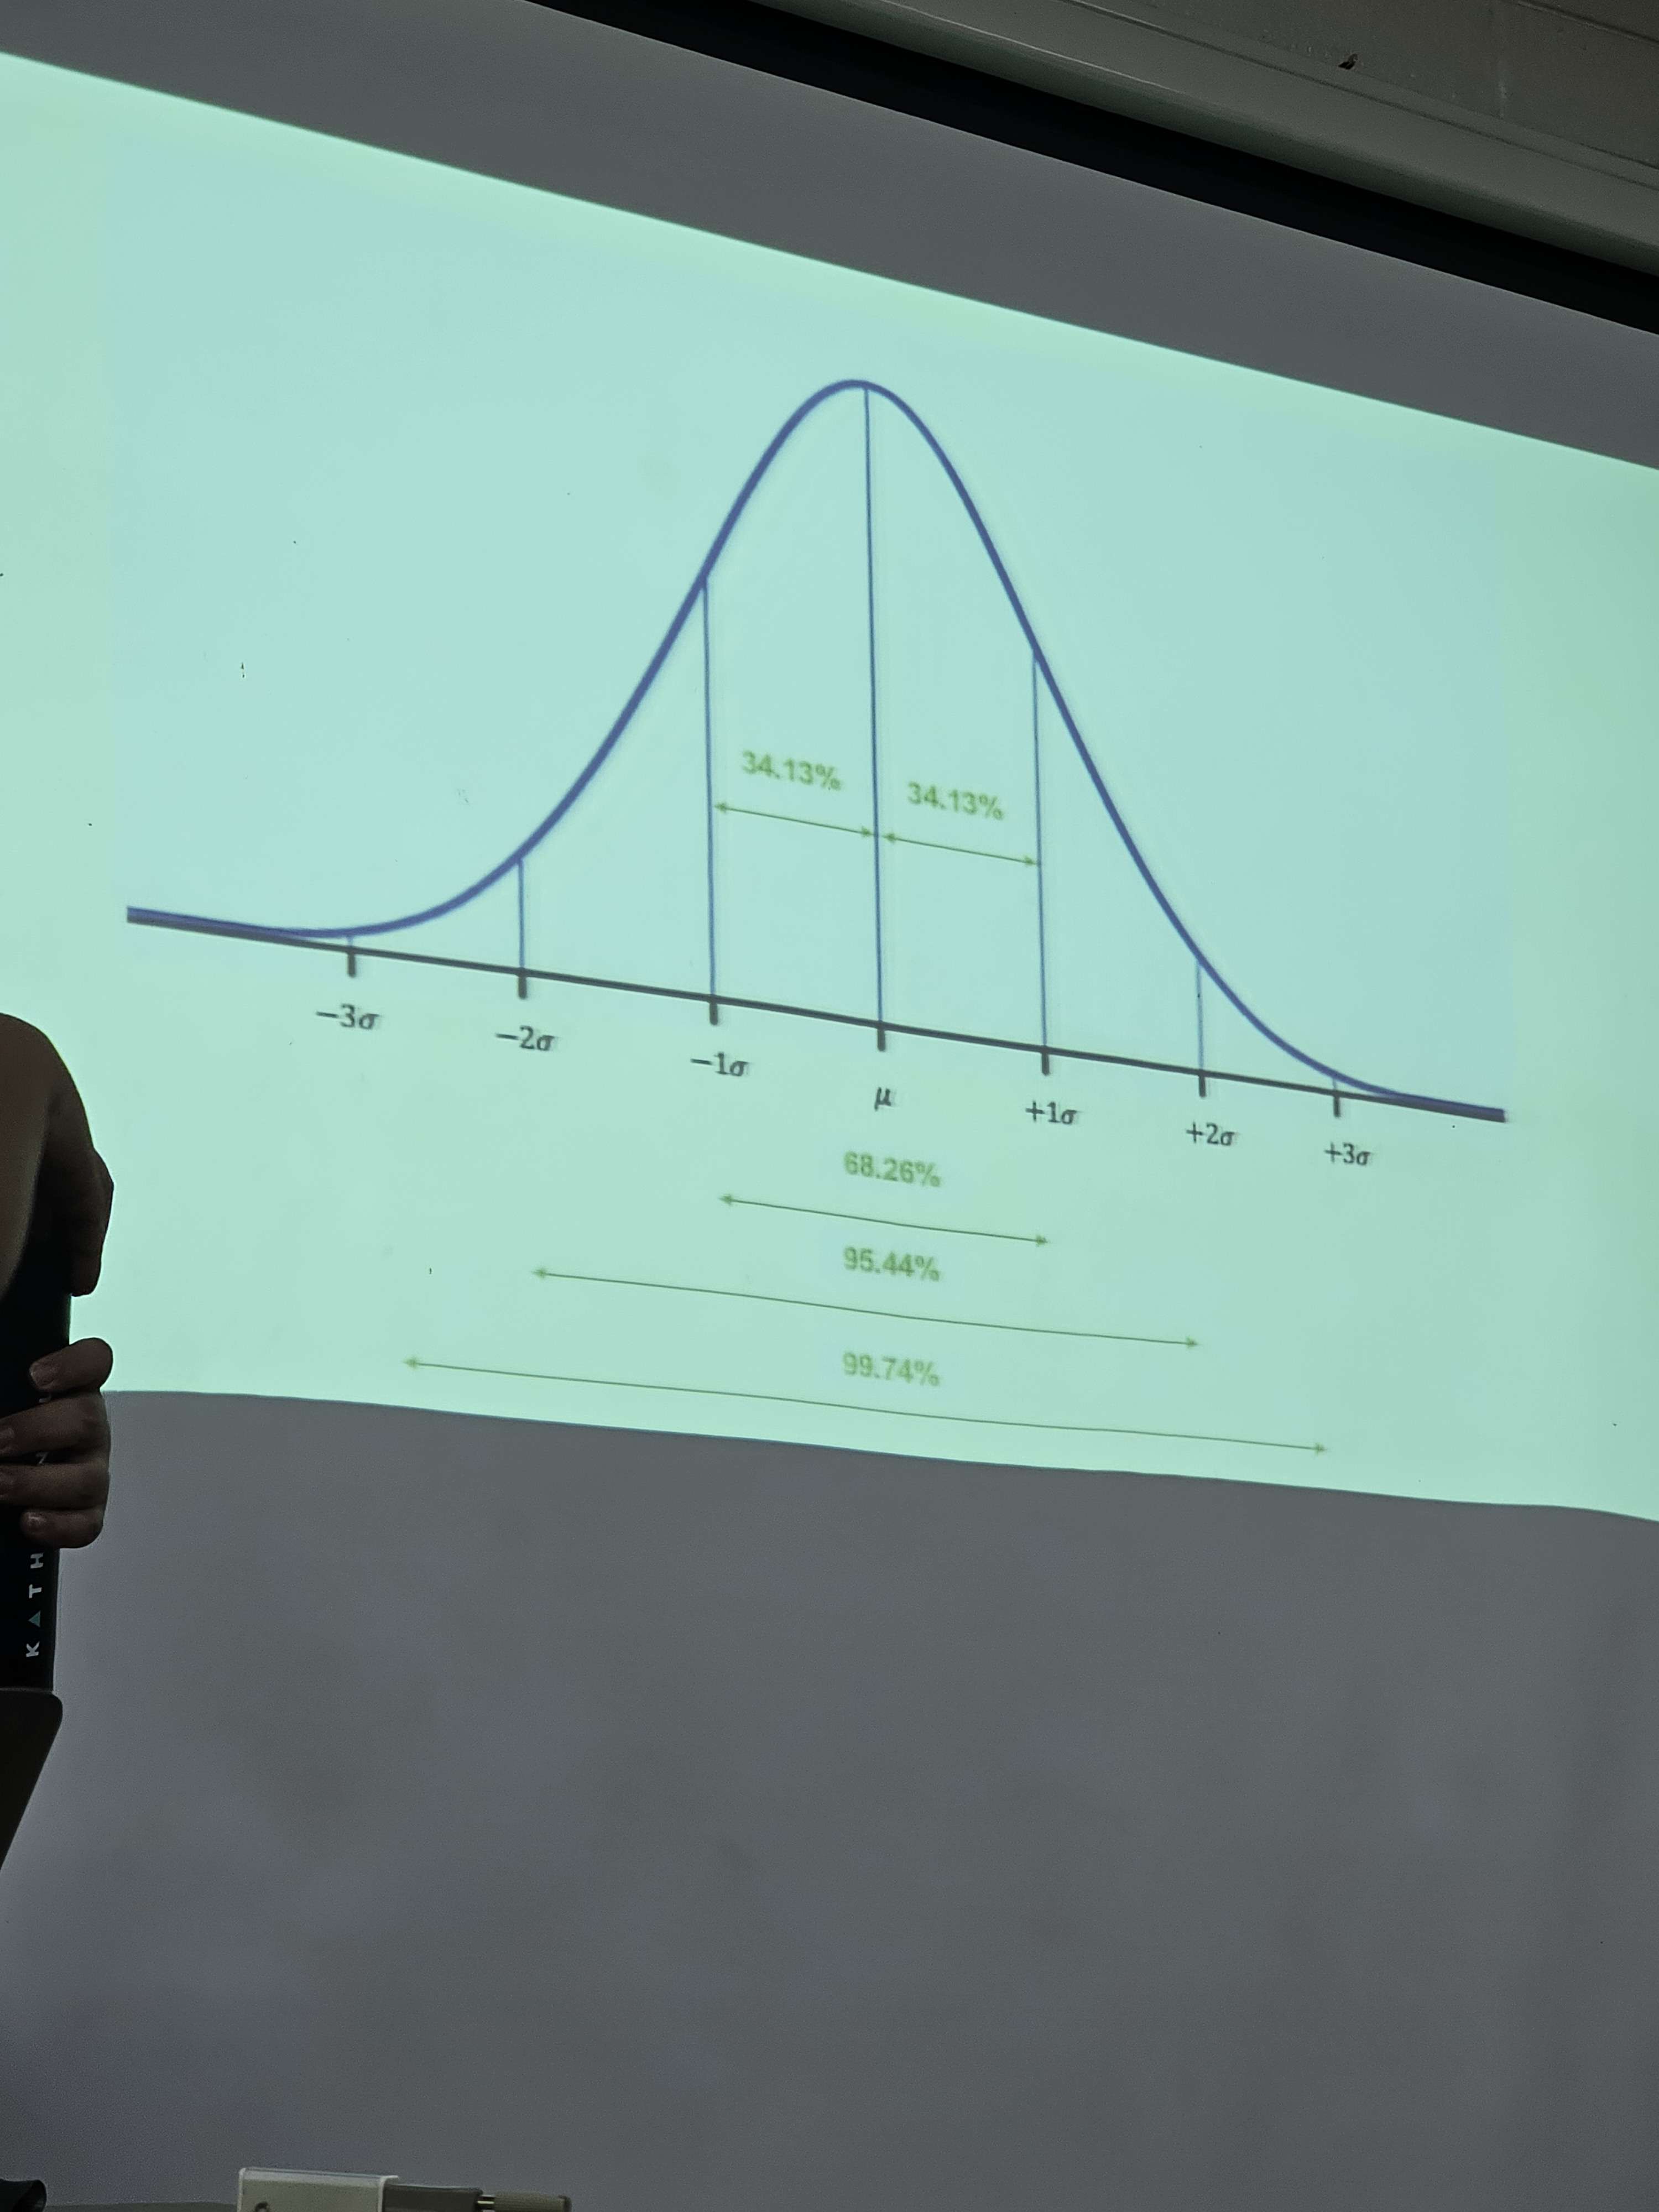
Normal Distribution
a type of probability distribution that is characterized by a bell-shaped curve
an ideal model of how data is distributed in the population
to what extent to data from our sample resemble the normal curve (i.e., the population)?
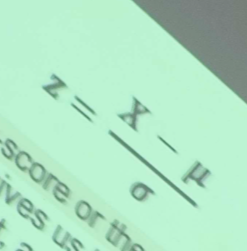
Z-score / standard score
gives us the exact (if not exact, a good approximation) number of standard deviations a particular raw score is from the mean
standardizes a score with respect to the other scores in the group
formula: z = X - mean / standard deviation
Sampling Distribution of Means
if we repeatedly get samples from our population and plot their means, the data that we will get also comes to approximate the normal curve
Statistical Hypothesis Testing
allows us to evaluate hypotheses about population parameters based on sample statistics
assumptions:
the sample was randomly selected
the variable is measured at the interval-ratio level
we can’t assume that the population is normally distributed
Alternative Hypothesis (H1)
statement reflecting the substantive hypothesis
specifies that the population is one of the following:
not equal to some specified value
greater than some specified value
less than some specified value
One-tailed Test
a hypothesis test in which the alternative is stated in such a way that the probability of making a Type I error is entirely in one tail of a sampling distribution
> greater than some specified value
> less than some specified value
Right-tailed Test
a one-tailed test in which the sample outcome is hypothesized to be at the right tail of the sampling distribution
> greater than some specified value
Two Types of Tests of Significance
Parametric
Non-parametric
Parametric tests of significance
a normal distribution
interval-ratio level of measurement for variables; and
a large sample size
examples: z-test, one sample/two samples t-test, ANOVA, and Pearson’s correlation
Non-parametric tests of significance
distribution is skewed or normal distribution is not assumed;
the variables are measured at the nominal or ordinal level; or when
we do not have large sample
examples: chi-square
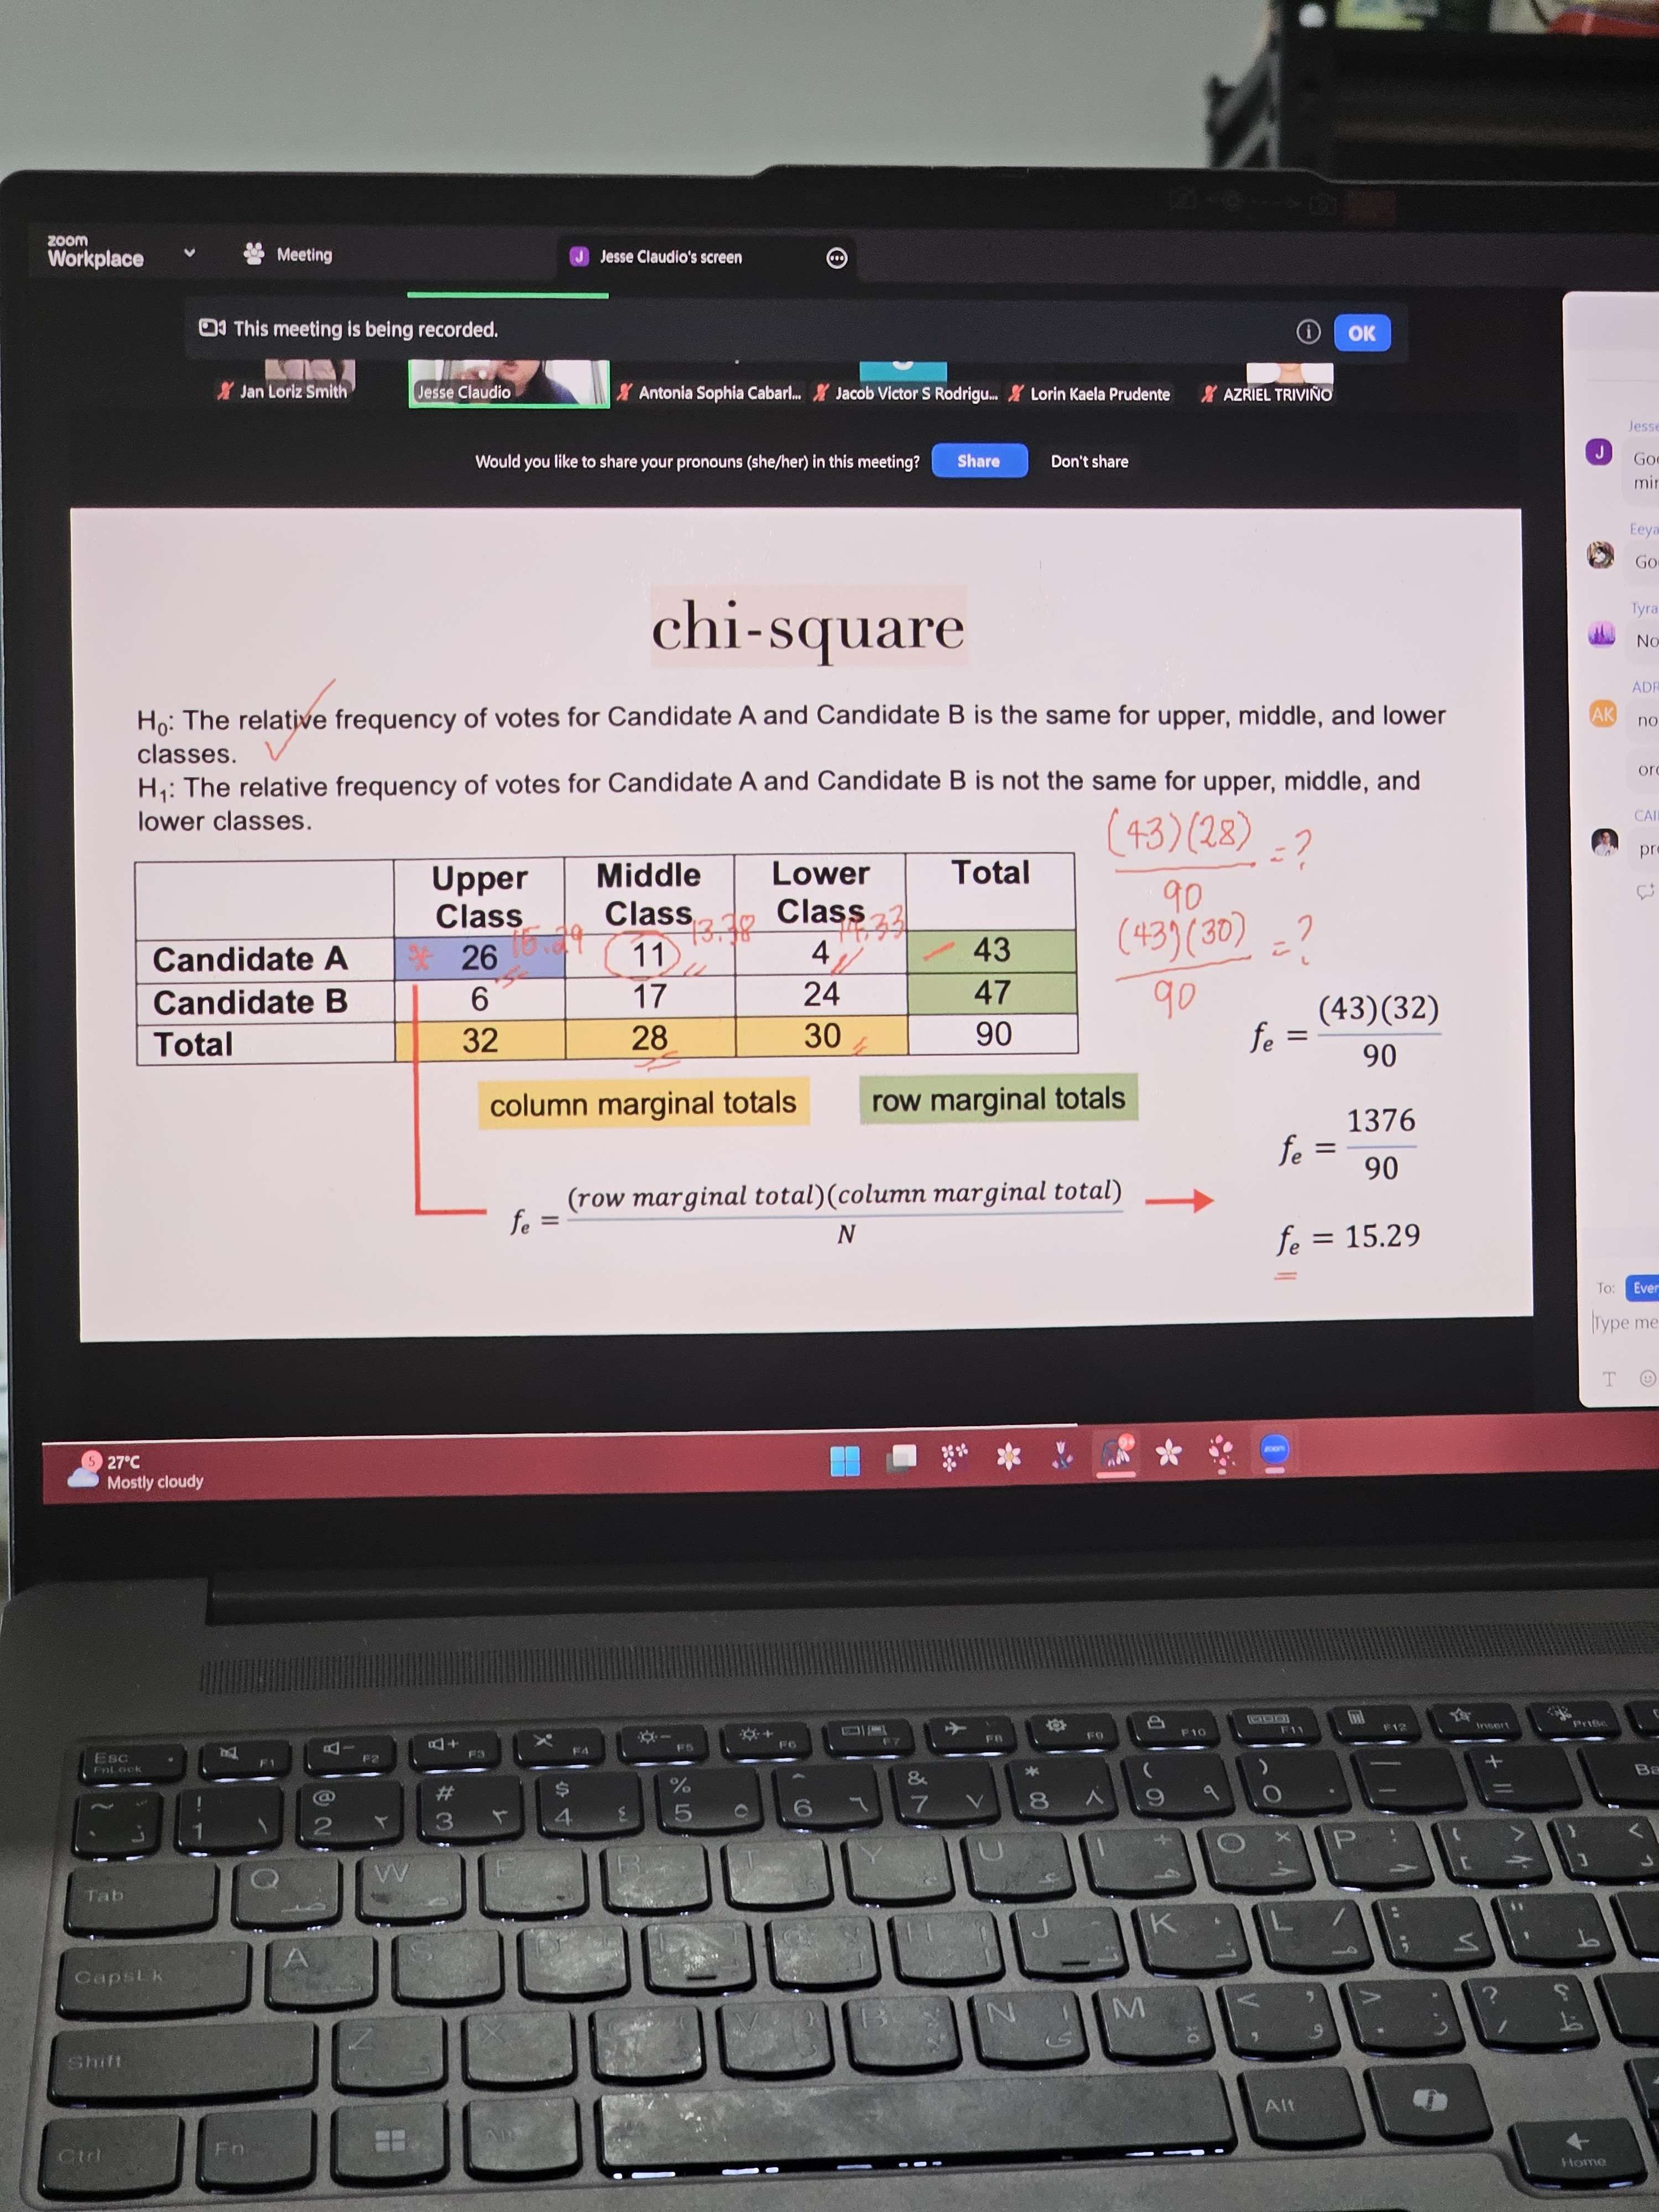
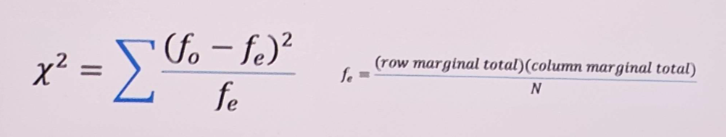
Chi-square
expected to refer to the null hypothesis
a non-parametric test of significance that allows us to test the difference between f0 and fe
a comparison of frequencies, not means
the greater the difference between the f0 (observed frequency) and fe (expected frequency_, the more likely we can reject the null hypothesis
Chi-square example
anak ng putangina just look at the slide bro (more examples sa discord)