2.1 Measures of Economic Performance
1/56
There's no tags or description
Looks like no tags are added yet.
Name | Mastery | Learn | Test | Matching | Spaced | Call with Kai | Chat |
|---|
No analytics yet
Send a link to your students to track their progress
57 Terms
National income/GDP
The total value of goods/services produced by an economy over a period of time
GDP formula
National output (GDP) = national income = national expenditure
Price level
Represents the average/typical price of all goods and services in an economy
When the price level rises, an economy experiences inflation
When the price level falls, an economy experiences deflation
Index numbers
A model used to measure changes in price, quantity or value over a period of time, compared to a base year of 100
Index numbers only show the change in GDP, not the real value of GDP
Economic growth
The increase in national income/value of output over a given period of time
Total GDP vs GDP per capita
GDP per capita is a better indicator of typical standard of living
Total GDP can still be useful to infer (e.g. the ability to fund defence/public services, or comparing GDP to national debt/trade deficits)
Real GDP
GDP adjusted for inflation
Real GDP formula
Real GDP = (GDP index / CPI (price index)) x 100
Nominal GDP
GDP not adjusted for inflation
Real GDP vs nominal GDP
Real GDP means to alter the raw GDP data to account for the actual purchasing power of consumers; even if a country is very rich, if prices are high, consumers will have less ability to actually purchase goods and services, compared to an equally rich country with lower prices, therefore the ‘real’ GDP of the country would be lower, as their purchasing power with that income is relatively lower
(e.g. if national income (GDP) grows by 5%, but the inflation rate is 6%, the economy had grown in nominal terms, however it has got poorer in real terms, because each person can afford less, despite their income rising
Relationship between GDP and inflation
If GDP growth < inflation, real GDP falls
If GDP growth > inflation, real GDP increases
if GDP growth = inflation, real GDP remains the same
Alternative measures of national income (GDP)
Gross national product (GNP)
Gross national income (GNI)
National happiness
Purchasing power parity (PPP)
Gross national product (GNP)
Measures the total value of goods and services produced by national citizens/assets, regardless of location, therefore it excludes the output of non-residents even if they produce domestically
Gross national income (GNI)
Measures the total value of income flows generated by national citizens/assets regardless of location, therefore it excludes income flows going to non-residents even if they produce domestically
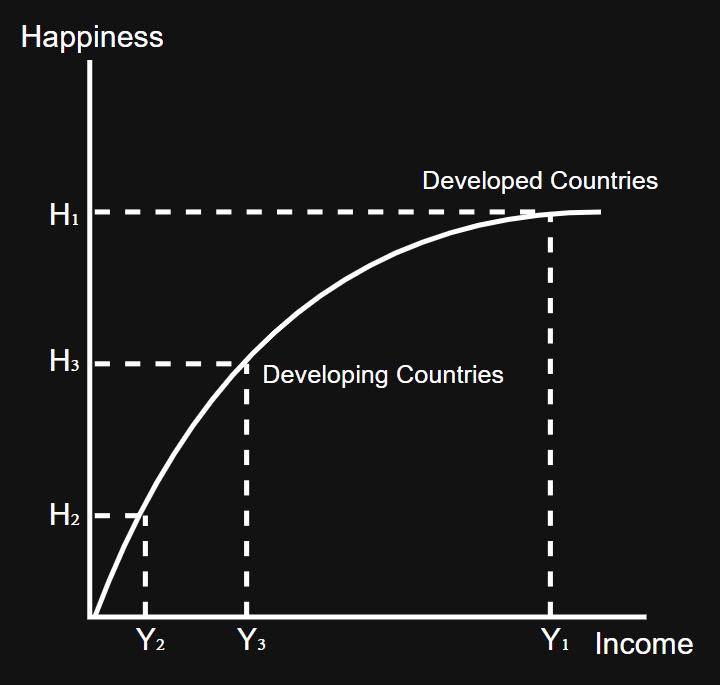
National happiness
Measurement of happiness is done via the national well-being survey, which asks a sample of the population a range of questions to quantify average life satisfaction
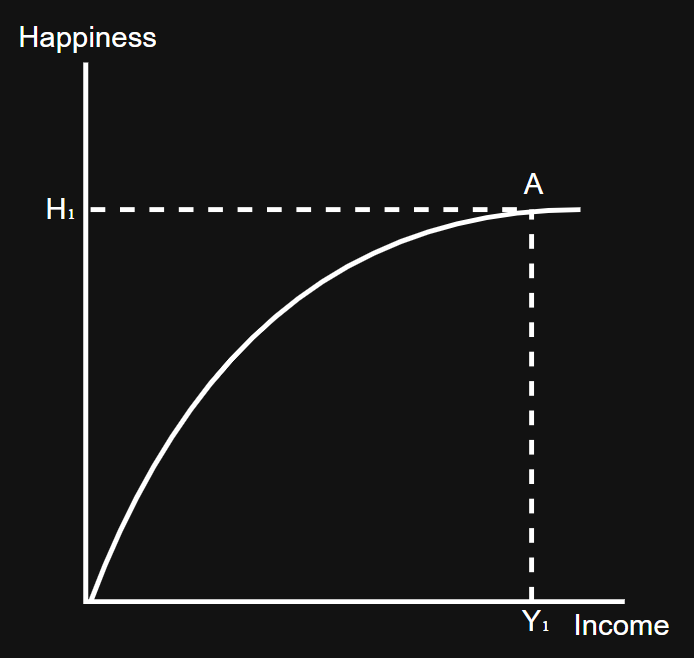
Relationship between income and national happiness
At lower levels of income, citizens may not have access to basic necessities, therefore more income does increase happiness as they can drastically improve their quality of life via spending, however once one’s income reaches a certain level, further increases do not lead to more happiness, this is because once basic necessities are covered, the sources of additional happiness cannot be acquired simply through buying them
Purchasing power parity (PPP)
A technique used to adjust GDP figures to take into account the cost of living when making international comparisons
Purchasing power parity to adjust exchange rates
US total nominal GDP = $32 trillion, @PPP = $32 trillion
China total nominal GDP = $21 trillion, @PPP = $44 trillion
China’s PPP is higher than USA’s PPP because the average costs of goods and services is cheaper in China that it is in the US, therefore every dollar spent in China has more purchasing power then it does in the USA, meaning overall the Chinese economy can purchase more total goods and services each year
Advantages of GDP as a measure of standard of living
Indicates living standards reasonably well, as more GDP/national income means consumers and the government can afford more goods and services; both material and non-material living standards (health and education)
GDP is relatively simple to calculate so easy for countries to operate GDP data and compare their growth to their past performances or the performance of other countries
Disadvantages of GDP as a measure of standard of living
Non-adjusted GDP may not indicate true living standards
Fails to account for population differences, unlike GDP per capita
Fails to account for inflation, unlike real GDP
Fails to account for differences in international cost of living, unlike PPP
Only considers domestic output, countries may have significant foreign earnings that are not counted towards GDP, unlike GNI and GNP
Hidden/underground economy businesses engaging in tax evasion or illegal black markets will not declare transactions and therefore these will not be counted towards GDP, therefore most countries will under-report their true GDP
Ignores inequality, even if a country has a very high GDP, if the income is very unevenly distributed, it might be the case that a minority of the population have very high living standards but the majority may have low living standards
Higher income may not necessarily mean higher national happiness, arguably the true goal of economic activity is to make us happier, not necessarily just to be richer
Output gaps
When the actual GDP/output of the economy is not equal to the potential GDP/output
Positive output gaps
Occurs when actual output > potential output
The economy is working beyond its efficient potential, requires over-utilising resources and its therefore not sustainable
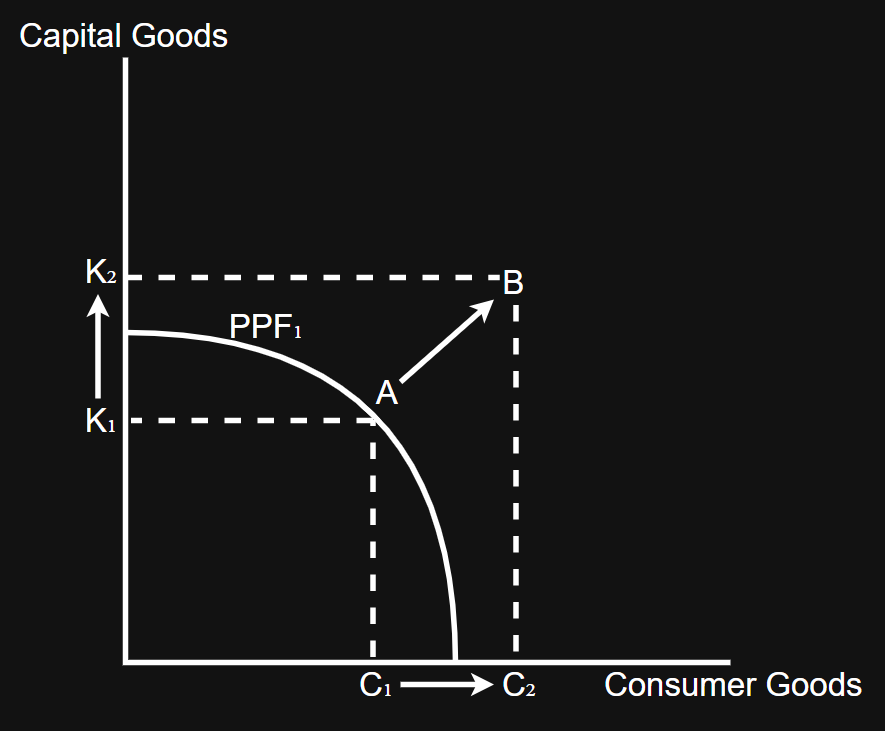
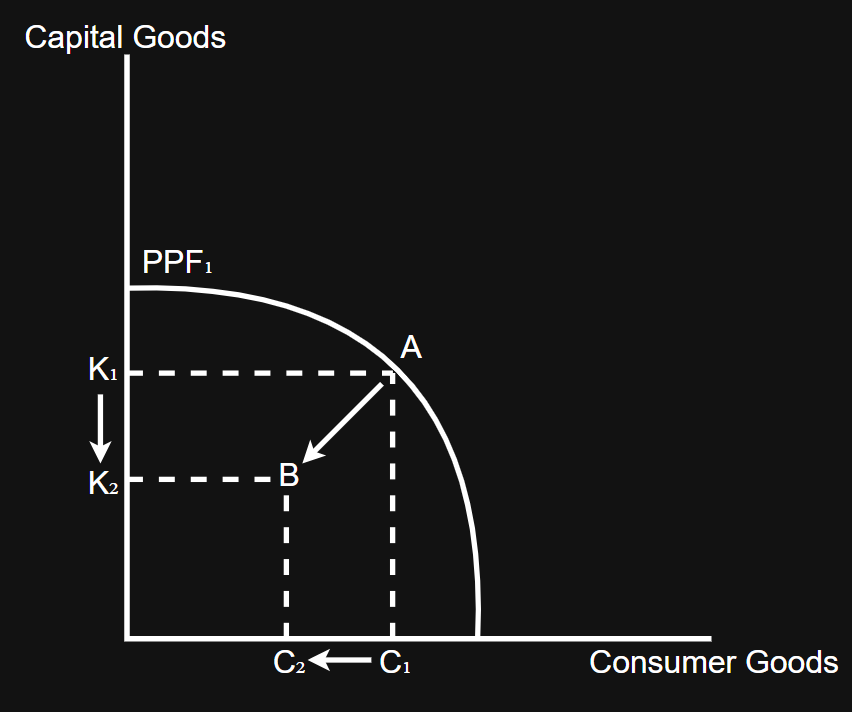
Positive output gap diagram - PPF
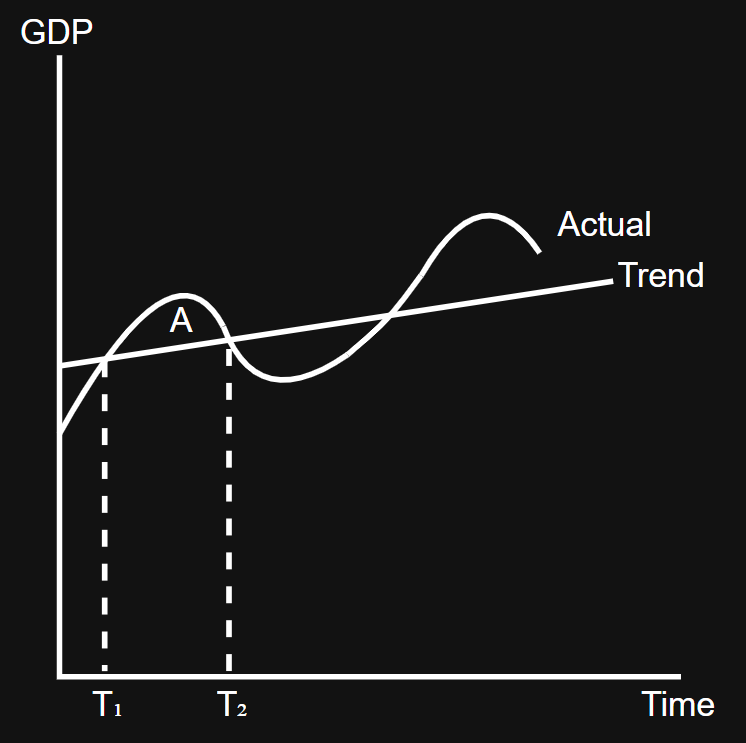
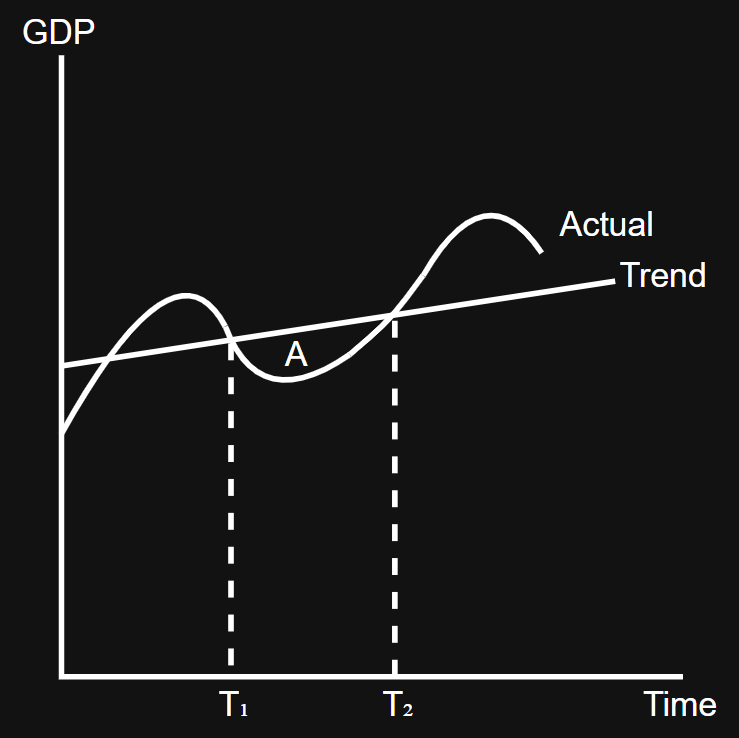
Positive output gap diagram - business cycle
Any period between T₁ to T₂ is a positive output gap
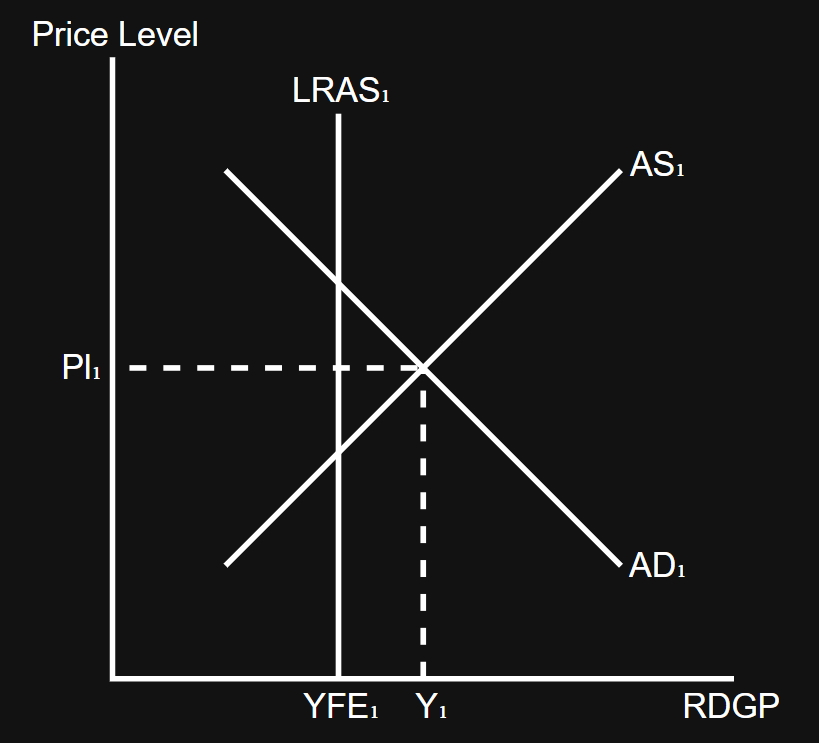
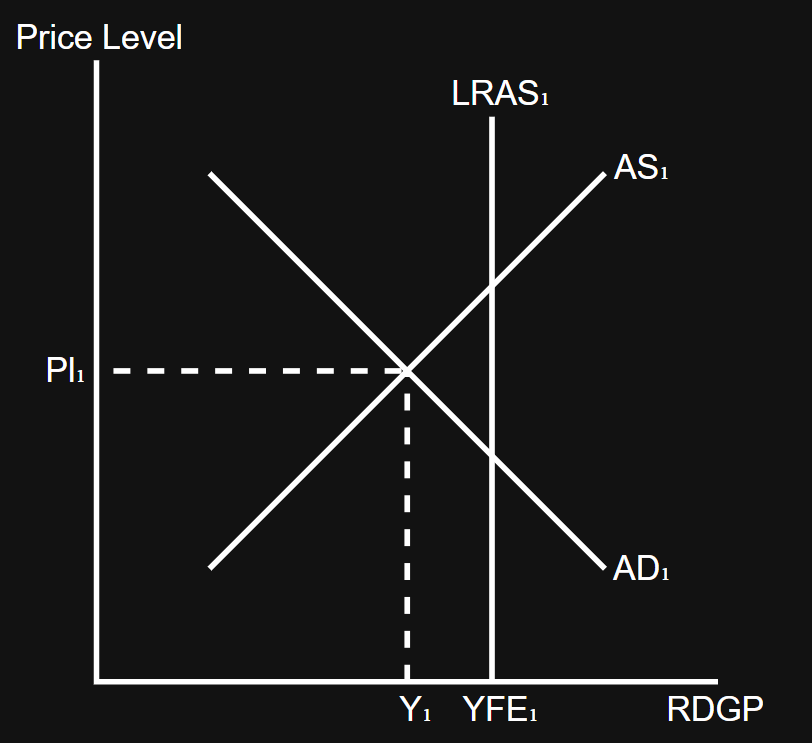
Positive output gap diagram - classical LRAS
Y₁ - YFE = positive output gap
Keynesian LRAS cannot demonstrate a positive output gap
Negative output gaps
Occur when actual output < potential output
Economy is not using all its resources efficiently
Negative output gap diagram - PPF
Negative output gap diagram - business cycle
Any period between T₁ to T₂ is a negative output gap
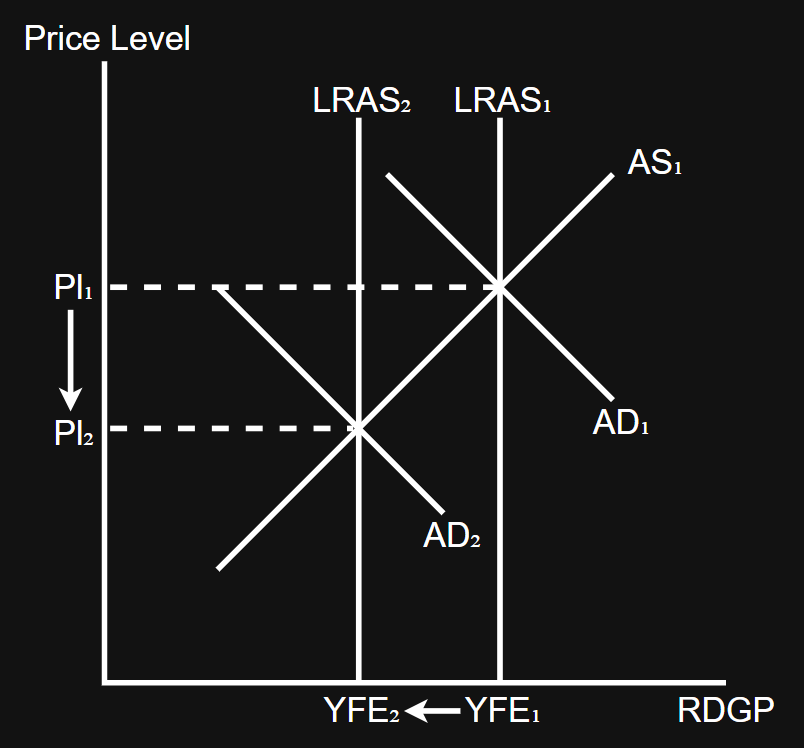
Negative output gap diagram - classical LRAS
YFE - Y₁ = negative output gap
(i.e. potential - actual GDP)
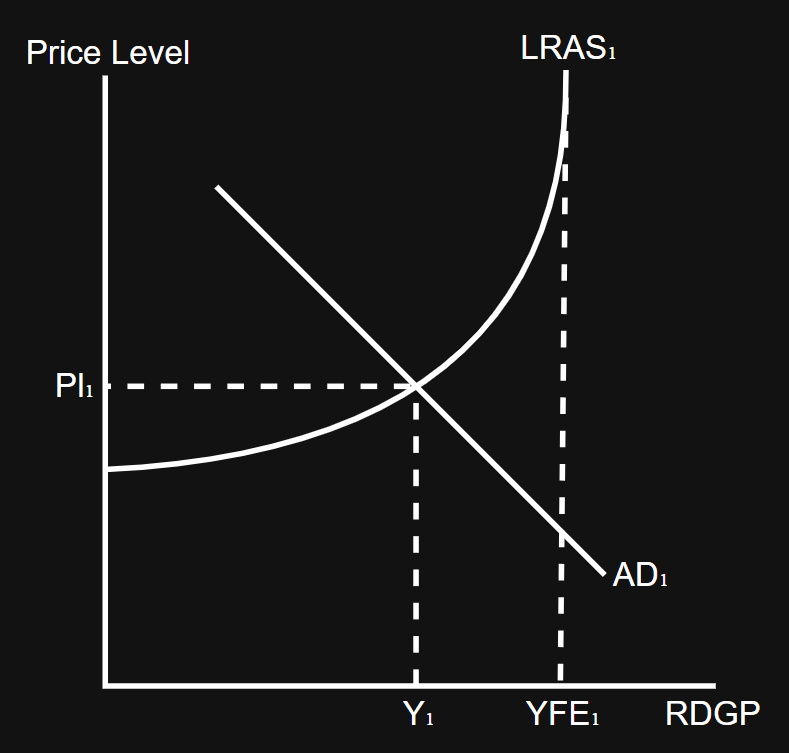
Negative output gap diagram - Keynesian LRAS
YFE - Y₁ = negative output gap
(i.e. potential - actual GDP)
Trade/business/economic cycle
The trade cycle describes the manner in which GDP fluctuates over time often separated into four stages (boom, recession, trough and recovery)
Characteristics of a boom
Inflationary (prices increase)
Low unemployment
Trade deficits are more likely
Improved government finances (less spent on benefits, therefore tax revenue increases)
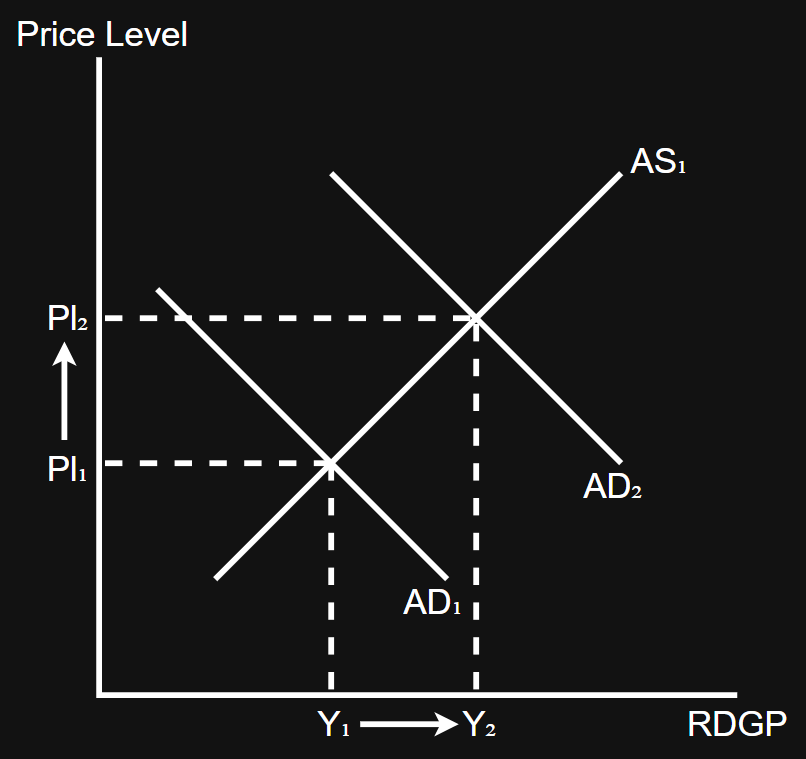
Causes of a boom - demand side booms
Both price level and income increases
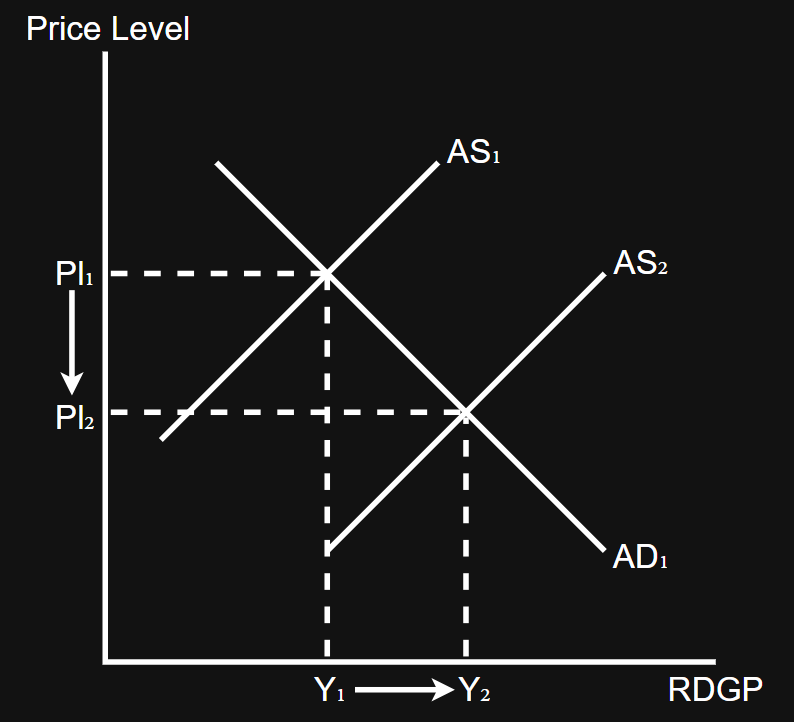
Causes of a boom - supply side booms
Price level decreases and income increases
Characteristics of a recession
Deflationary (prices decrease)
High unemployment
Trade surpluses are more likely
Worsened government finances (more spent on benefits, therefore tax revenue decreases)
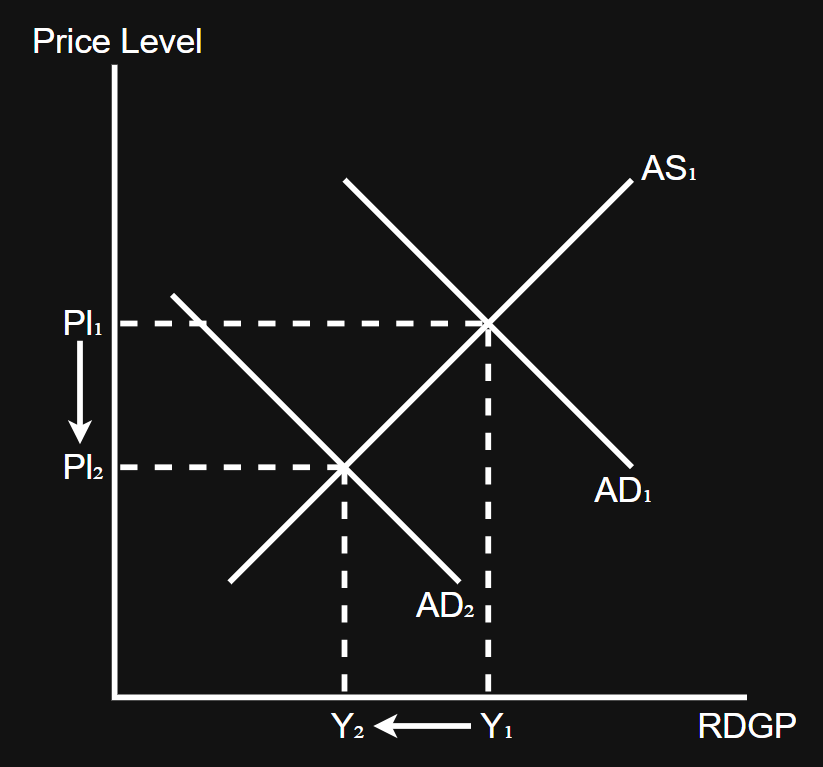
Causes of a recession - demand side recession
Both price level and income decreases
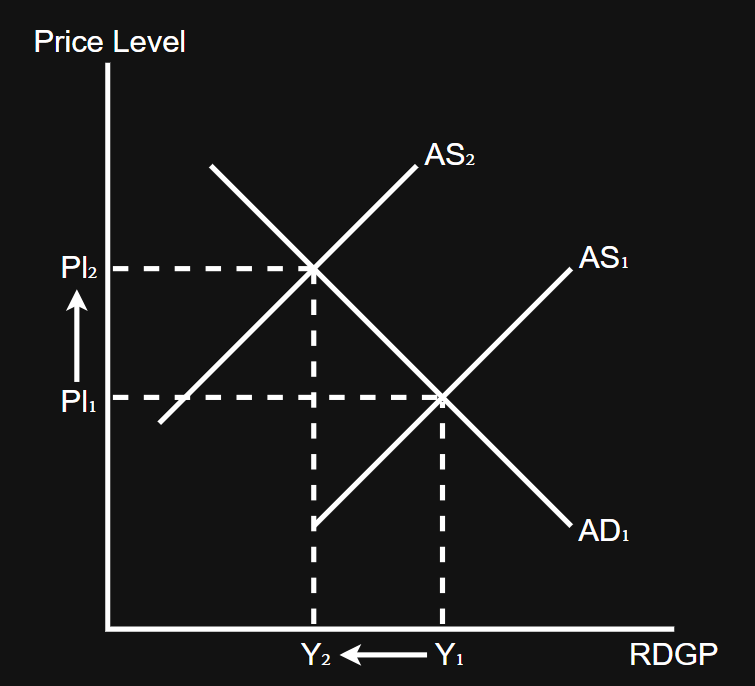
Causes of a recession - supply side recession
Price level increases and income decreases (stagflation - stagnation + inflation)
Evaluation for output gaps/the trade cycle
It is very difficult to accurately measure potential/trend GDP, and therefore it is very difficult to precisely work out how large an output gap is
For output gaps specifically, if a shift in AD/SRAS creates an output gap/changes the size of an output gap, this will be cancelled out if LRAS shifts in the same direction
The inward AD shift initially moves the economy closer to YFE, closing the output gap, however if LRAS also shifts inwards potential output decreases as well as actual, so the gap between them may stay the same
The characteristics of a recession/negative output gap or boom/positive output gap is dependent on whether the change in income is caused by a demand-side change, or a supply-side change
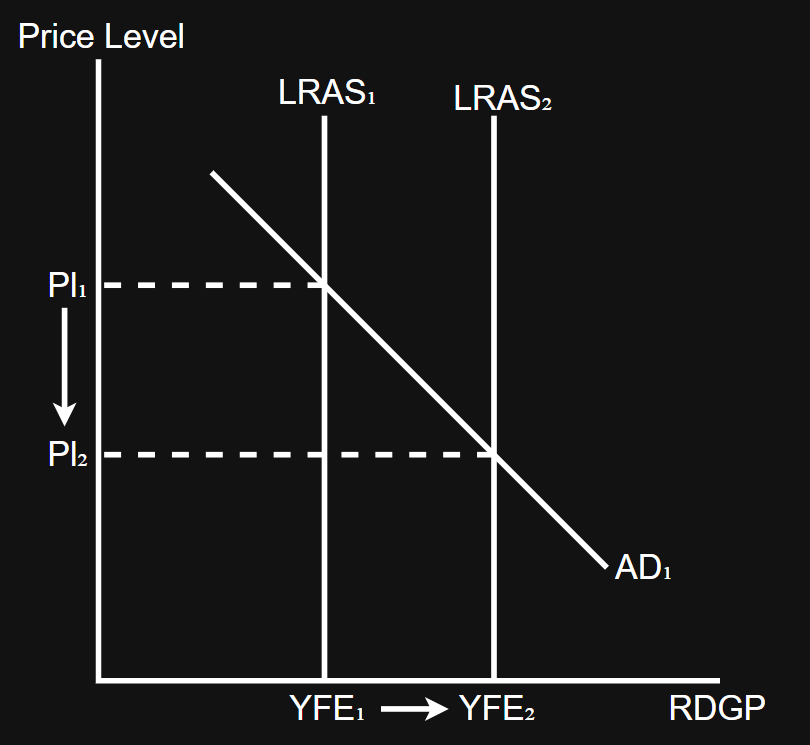
Causes of economic growth
If economic growth is measured by increases in GDP/national income, then anything that causes an increase in GDP/national income causes economic growth
More injections, less withdrawals, outward shifts of AD, outward shifts of AS, outward shifts in LRAS all cause economic growth (an outward shift of LRAS does not indicate actual growth, but an increase in potential growth)
Export-led growth is when a country achieves economic growth primarily through selling exports (e.g. China); it is very important to be internationally competitive in order to achieve export-led growth
Effects/impacts/benefits of growth - employment
Economic growth is good for employment - Y↑ = C↑ = AD↑ = Dl↑ (demand of labour is derived demand) = employment ↑
However, A.I and improvements in automatic technology mean labour may no longer be needed to increase the output of goods and services
Effects/impacts/benefits of growth - living standards
Economic growth is good for living standards - Y↑ = C↑/purchasing power = necessities↑ (for low-income earners) AND luxuries↑ (for high-income earners) = material standard of living↑ OR healthcare↑/education↑ = non-material standard of living↑
However, if income increases beyond point A, there would be a minimal impact on the standard of living as happiness increases slightly
Effects/impacts/benefits of growth - government finances
Economic growth is good for improving government finances - Y↑ = income tax revenue↑ AND C↑ = profits↑ = corporate tax revenue↑/VAT revenue↑/other indirect tax revenue↑ OR G↓ (as there is lower unemployment) = unemployment benefit spending↓
However, this depends on the level of corruption, tax avoidance (legal in some locations, e.g. setting up a HQ in Bermuda) and tax evasion (illegal, e.g. only taking cash and not declaring money to HMRC)
Effects/impacts/costs of growth - inflation
Economic growth can be inflationary - Y↑ = C↑ = AD↑ = Pl↑ = purchasing power↓ = standard of living↓
However, if the growth is caused by improvements in AS/LRAS, it will not be inflationary (price level will decrease) (it depends on whether growth is in the demand-side or supply side of the economy)
Effects/impacts/costs of growth - trade deficits
Economic growth can create a trade deficit (M>X) - Y↑ = M↑ (as domestic consumers can buy more) = trade deficit↑ AND C↑ = AD↑ = Pl↑ = competitiveness of exports↓ = trade deficit↑
However, China has managed to achieve historically high rates of economic growth whilst maintaining a trade surplus (via export-led growth); export-led growth can be achieved by an economy pivoting from competing on price to competing on quality/technology, OR an economy continuously improving AS/LRAS, which prevents the inflationary impact of growth and allows them to remain competitive
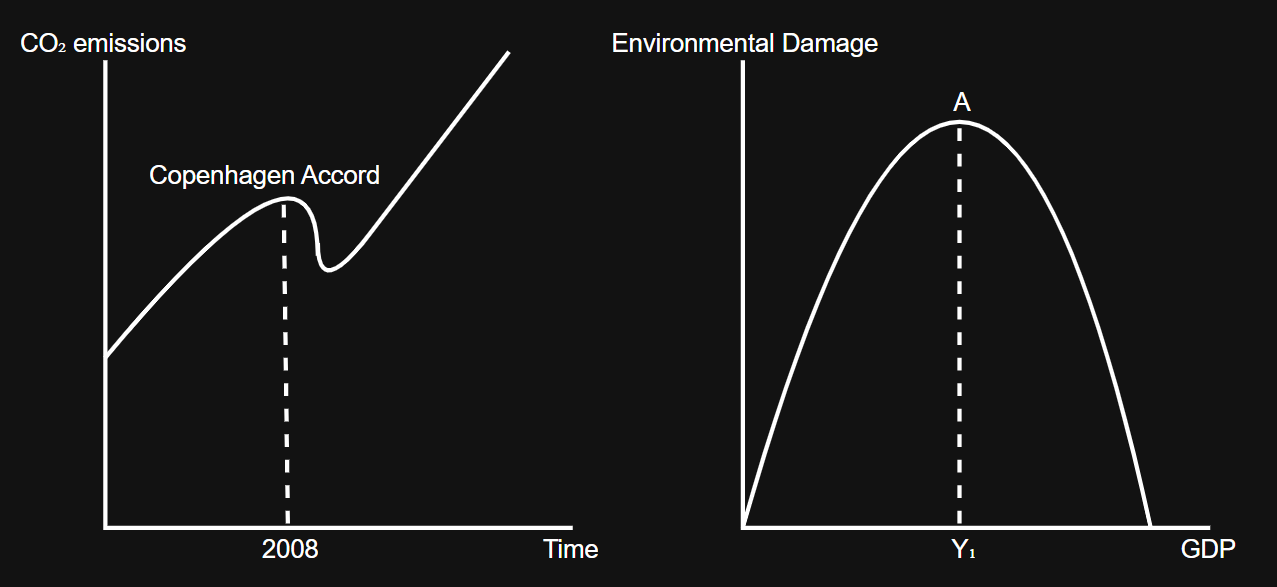
Effects/impacts/costs of growth - environment
Economic growth damages the environment - Y↑ = production↑ = pollution↑; Yoval Noah Harari “Homo Deus” is the founder of this theory that as GDP grows, emissions increase and as GDP falls, emissions decrease (political agreements have no long-run effect on pollution levels)
However, growth may initially harm the environment, but after point A, increased GDP can reduce environmental damage, this is because richer countries can afford to research or invest in greener technology (e.g. China, the richest country in 2015, had more solar panels than all the countries in the world combined) OR consumers will prioritise the environment more as income increases because it is a luxury, not a necessity
Inflation
The persistent rise in the general price level over a period of time
Deflation
The persistent fall in the general price level over a period of time
Disinflation
The fall in the inflation rate over a period of time, where the price level is still rising but at a slower rate than previously
Ways to measure inflation
Consumer price index (CPI)
Retail price index (RPI)
Consumer price index
Retail price index
Difference between CPI and RPI
RPI include housing costs (e.g. mortgages), whereas CPI does not, meaning RPI usually has generates a higher inflation rate
Causes of inflation
Demand pull inflation; when price level rises due to an outward shift in aggregate demand
Cost push inflation; when price levels rise due an inward shift in aggregate supply
An increase in the money supply
Fischer’s equation of exchange
Money supply x velocity of spending = price level x quantity of transactions
MV = PQ OR MV = PT
Assume V is constant because consumers will spend at a steady price rate over time; if M increases, the price level would increase, assuming the quantity of transactions remains the same; the quantity of transactions would not increase when money supply increases as money is not a factor of production, therefore it only leads to an increase in the price level of an economy
Evaluation for causes of inflation
Demand is not a significant cause of inflation when an economy has lots of spare capacity (Y₂ - Y₁)
Cost-push inflation may not be significant if the rising cost is a small percentage of the firms total costs (e.g. if wages rise in a capital-intensive economy, not much cost-push inflation would occur; if wages rise in a labour-intensive economy, a lot of cost-push inflation would occur)
The money supply may not be a significant cause of inflation if increases in M cause an increase in Q/T; Keynesians argue that money can be used to increase the capital stock of the economy, therefore Q/T increases when M increases, avoiding inflation
Effects/impacts/benefits of inflation - profit for firms
Inflation can be good for firms as they can sell goods/services for higher prices, acquiring more revenue, and hence more profit; inflation also encourages a faster rate of consumption, which may even increase overall demand for firms (expectations of inflation↑ = C↑ = AD↑)
However, firms may not benefit if inflation of the input price (cost of production) rises faster than the output price (sale price); if input prices are rising faster than output prices, firms would be worse off (it is always likely that wages will rise as workers try to negotiate higher wages)
Effects/impacts/benefits of inflation - reduction in government debt
Inflation can benefit the government to some degree as it reduces the real value of their debt, with the government being a typically large borrower; as inflation reduces the value of money, debtors such as the government would pay back a lower value of money than they borrowed (the opportunity cost of the money they give back is less than what they initially received)
However, the reduction in the real value of debt can be counteracted by an increase in the value of the nominal debt (e.g. public sector workers will ask for higher wages, increasing government spending, and pension benefits, which are index linked, would automatically linked would rise, also increasing government spending)