Variability
1/9
There's no tags or description
Looks like no tags are added yet.
Name | Mastery | Learn | Test | Matching | Spaced | Call with Kai |
|---|
No analytics yet
Send a link to your students to track their progress
10 Terms
Spread and Variability
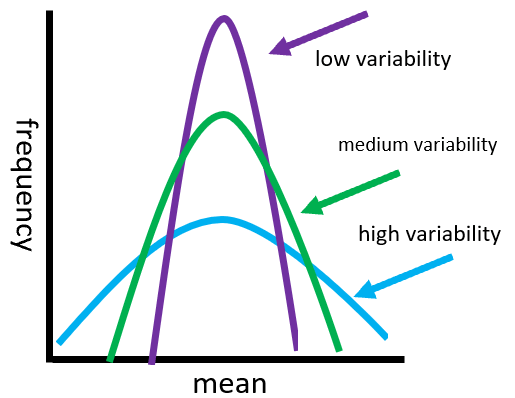
Variability - used to determine how spread out a group of scores are, or if they are bunched together
Synonymous (nearly the same) with terms spread and dispersion
While central tendency describes the center of the distribution, variability describes the divergence (gap/separation) from the center
The scores are the same = no variability
A small difference between scores = small variability
A large difference between scores = large variability
Measuring Variability
Can utilise a few difference measures to describe variability:
Describes if scores are clustered or spread over distance
informs us of how well a score represents the entire distribution
We do this through:
Range
Interquartile Range
Standard Deviation
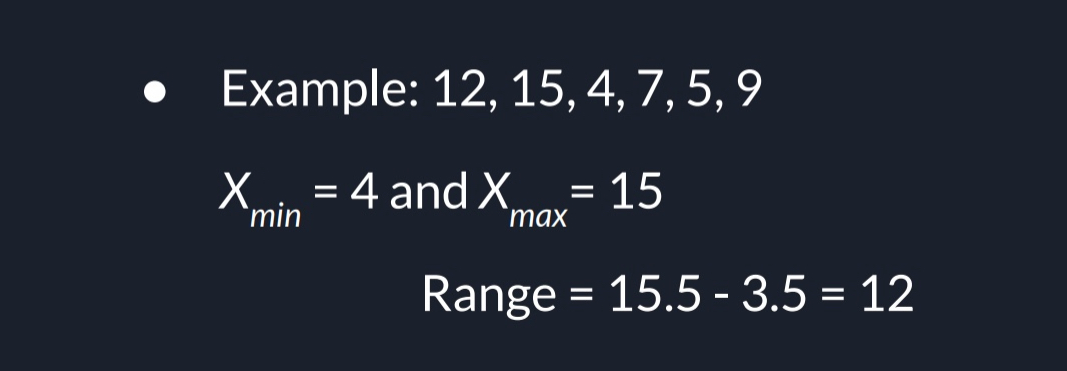
Range
distance between the largest score (Xmax) and the smallest score (Xmin)
FORMULA)
Range = URL Xmax - LRL Xmax
URL = Upper Real Limit
LRL = Lower Real Limit
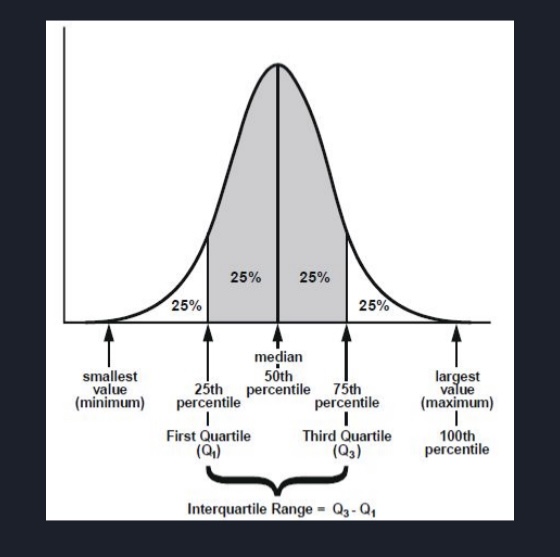
Interquartile Range (IQR)
The range of the middle 50% of the distribution
FORMULA) IQR = Q3 - Q1
EXAMPLE)
The data set: 1, 2, 2, 3, 3, 4, 4, 4(8th), 5(9th), 5, 5, 5, 6, 6, 6, 7
Step 1: Find the Median (Q2)
There are 16 numbers
Middle position is between the 8th and 9th values
8th value = 4, 9th value = 5
Median = (4 + 5) / 2 = 4.5
So the dataset is split into lower half (first 8 numbers) and upper half (last 8 numbers).
Step 2: Find Q1 (the median of the lower half)
Lower half: 1, 2, 2, 3(4th), 3(5th), 4, 4, 4
There are 8 numbers
Middle is between 4th and 5th values = (3 + 3) ÷ 2 = 3
So Q1 = 3
Step 3: Find Q3 (the median of the upper half)
Upper half: 5, 5, 5, 5(4th), 6(5th), 6, 6, 7
Middle is between 4th and 5th values = (5 + 6) ÷ 2 = 5.5
So Q3 = 5.5
Step 4: Calculate IQR
IQR = Q3 – Q1 = 5.5 – 3 = 2.5
Semi-Interquartile Range
Half of the interquartile range
Semi-interquartile range = (Q3 - Q1)/2
Semi-interquartile range = (5.5 -3)/2
Most stable measure of variability
Less likely to be influenced by extreme scores; does not give a complete picture of the variability for the entire set
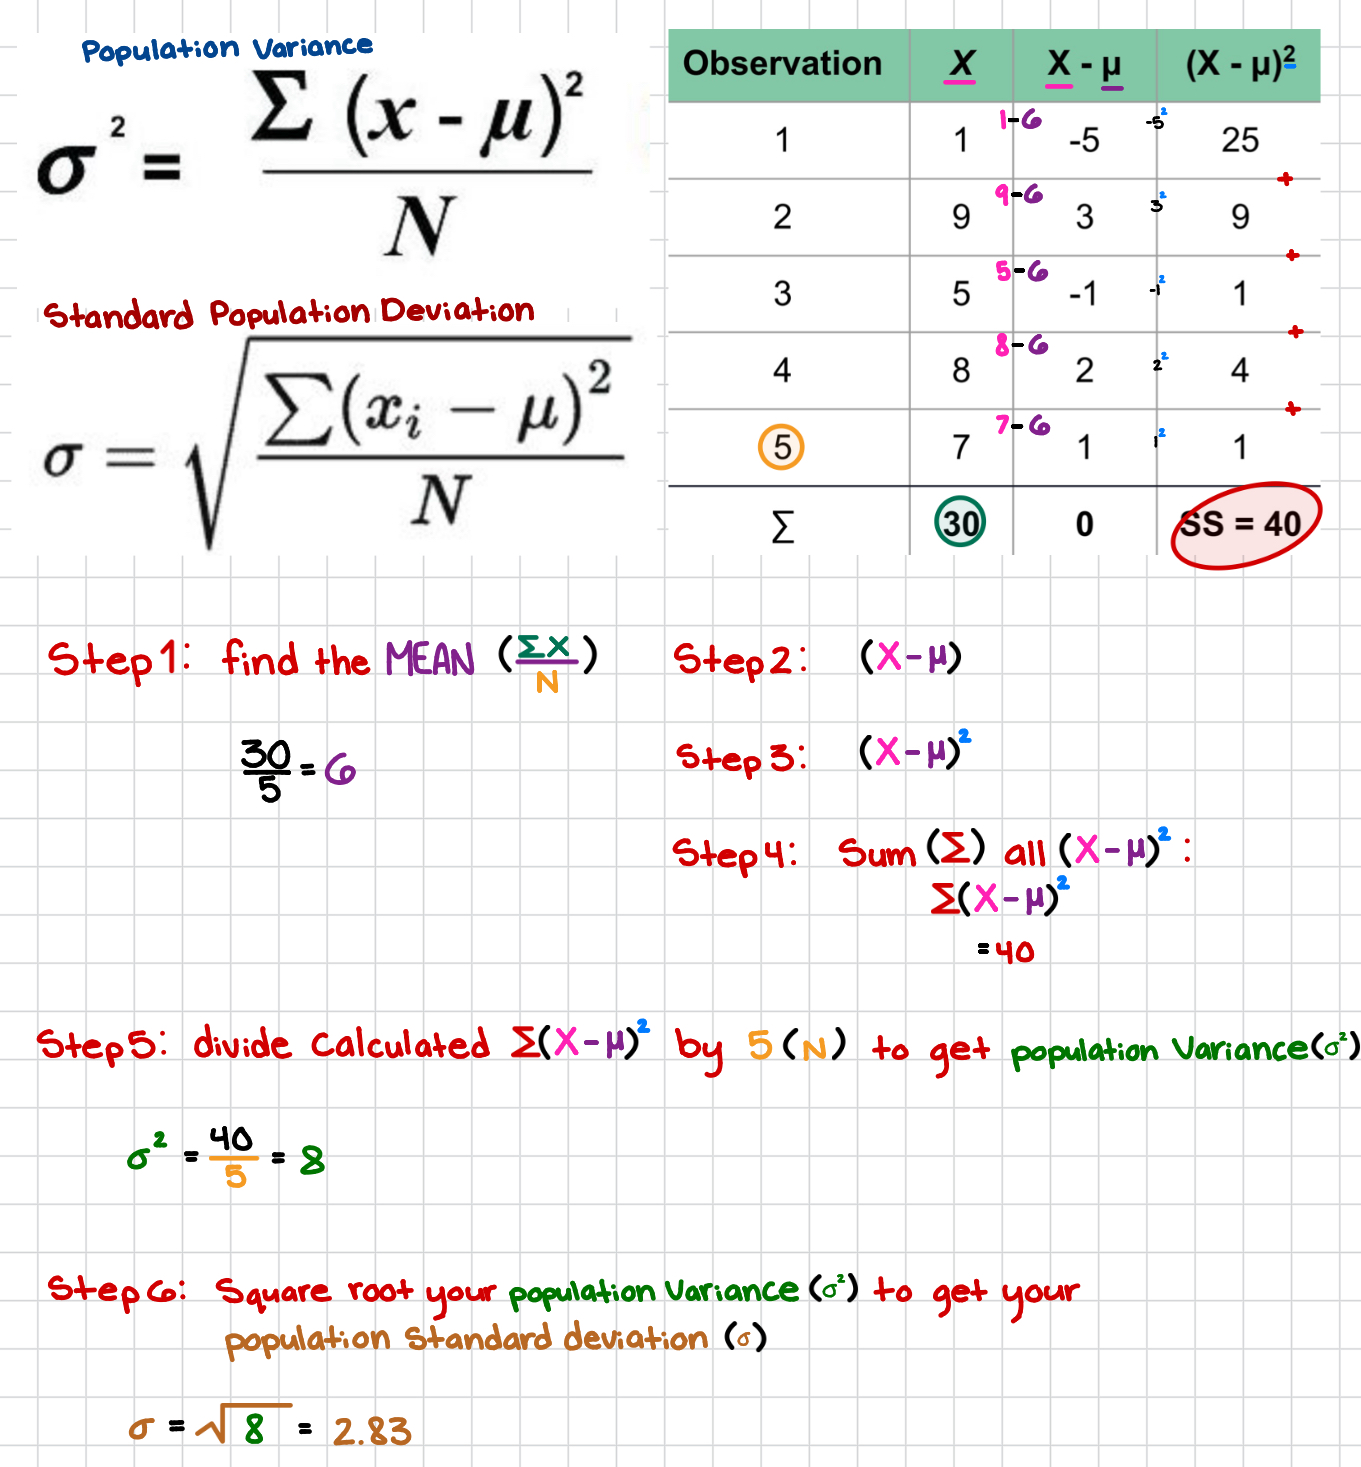
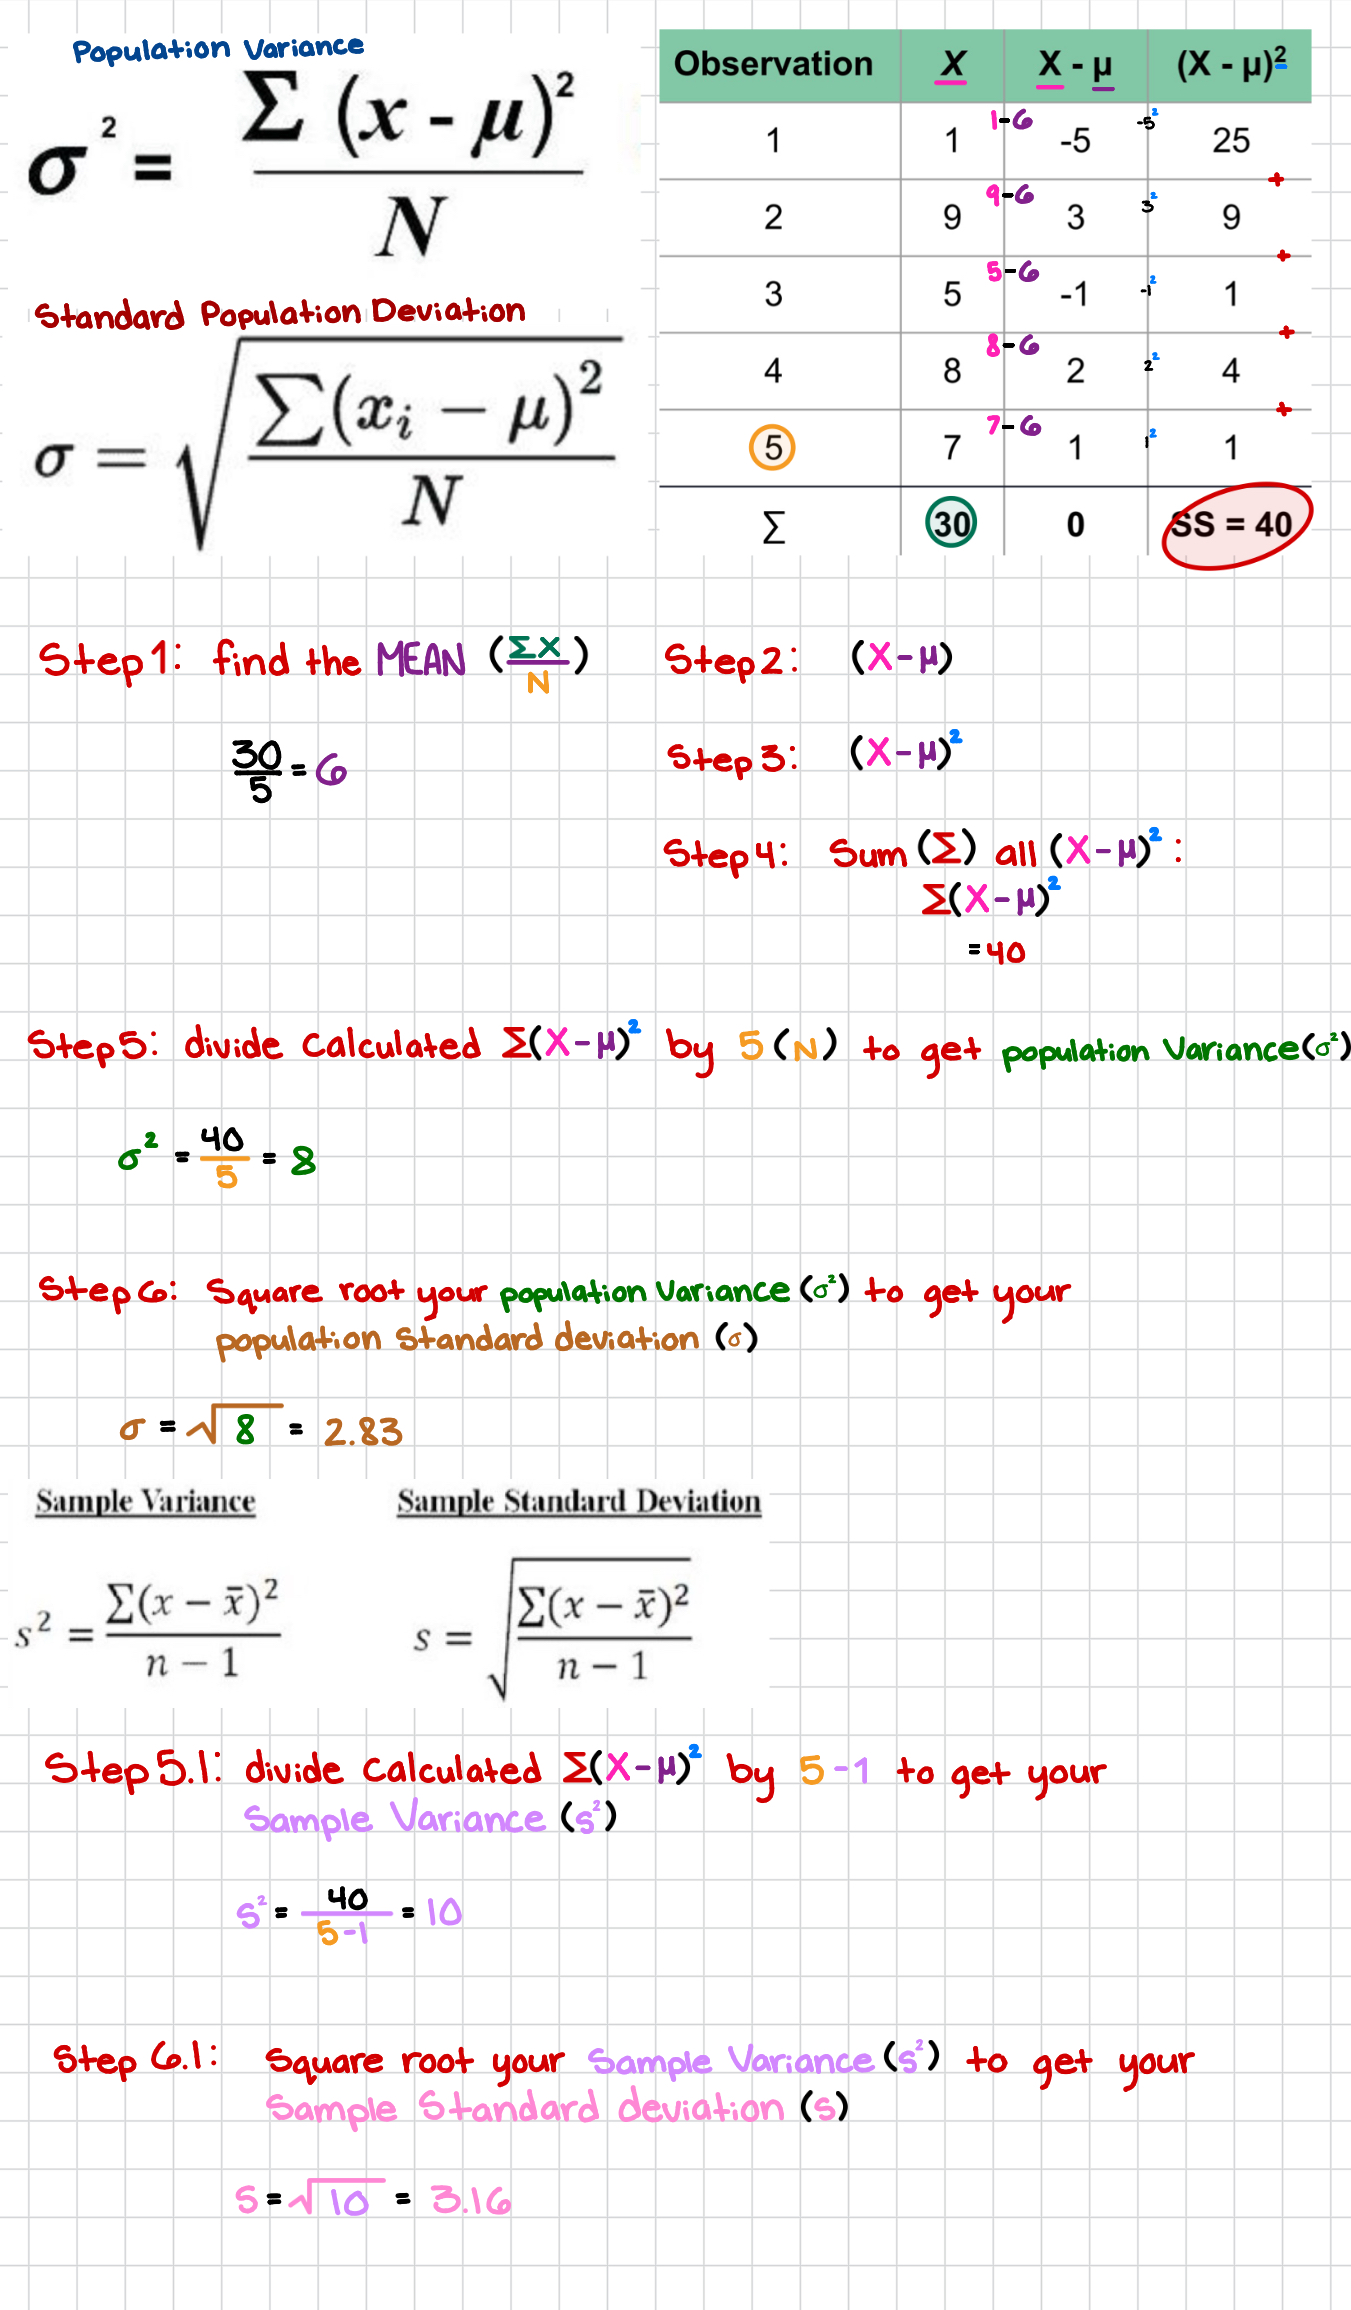
Standard Deviation and Variance 𝜎² / 𝜎: Population
Determine the distance or deviation of each score from the mean
FORMULA) Deviation score = X - μ
Square each deviation score: (X - μ)²
Sum of the Squared Deviations(SS): SS = ∑(X - μ)²
The average of these scores is the population variance
The variance is the average squared distance from the mean
Square root the variance
Correction for having all the squared distances
Standard Deviation and Variance s² / s: Sample
Bias: Sample variability is always smaller than population variability
Have to adjust for this bias
For the mean: Use X̄ instead of μ
Variability: Computation steps for the numerator are the same
1. Find the deviation for each score: X - X̄
2. Square each deviation: (X - X̄)²
3. Add the squared deviations: 𝑆𝑆 = ∑(X - X̄)²
𝑆𝑆 = ∑(X - X̄)² is the same computation as for the population
Adding the correction for this bias in sample variability, the denominator becomes N-1
Degrees of Freedom (df)
How many values can you choose freely before the last one is forced by the mean condition
Step 1: How many numbers do we have?
We have 3 numbers: 2, 4, 6
Find MEAN:
FIRST ∑X: 2 + 4 + 6 = 12 (this is our sum)
THEN DIVIDE ∑X (12) by N (3): 12/3 = 4
MEAN = 4
Step 3: How many values we can have free?
Imagine you have 3 boxes 🟦🟦🟦
You need to put numbers inside them
The rule is: the mean must equal 4
That’s because: MEAN formula needs to make sense
12 (the sum)/3 (the N) = 4
EXAMPLE)
Pick the first number; Say you put 2 in the first box - Nothing stops you, totally free choice
Pick the second number; Say you put 7 in the second box - Again, free choice
Now what about the third box; Now the first two numbers already add up to 2 + 7 = 9, But the total has to equal 12 …
That means the third box is forced to be 12 − 9 = 3; (not free anymore).
Key idea:
Box 1 = free
Box 2 = free
Box 3 = locked (it must make the total = 12)
So even though you have 3 numbers, only 2 are “free to vary.”
That’s why the degrees of freedom = 2.
Standard Deviation: Importance
Provides a measure of the typical or standard distance from the mean for a distribution
Allows for interpretation of individual scores
Common measure to describe a set of data
along with the mean
Standard Deviation: Transformation
Adding or Subtracting a constant to/from each score
Not change the standard deviation
Consider a distribution with μ = 40 and σ = 10 ; Add 5 points to every score
Multiplying or Dividing each score by a constant
Causes the standard deviation to be multiplied or divided by the same constant
Consider a distribution with μ = 40 and σ = 10 ; Multiply each score by 2