L5a: Measure wavelength of a monochromatic light (Trigonometry)
1/26
There's no tags or description
Looks like no tags are added yet.
Name | Mastery | Learn | Test | Matching | Spaced | Call with Kai |
|---|
No analytics yet
Send a link to your students to track their progress
27 Terms
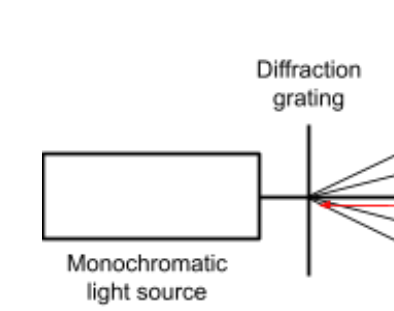
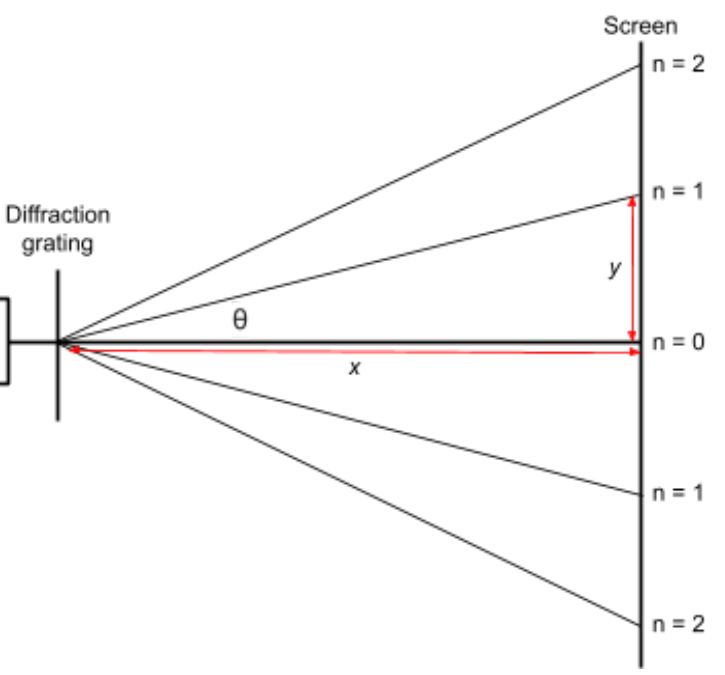
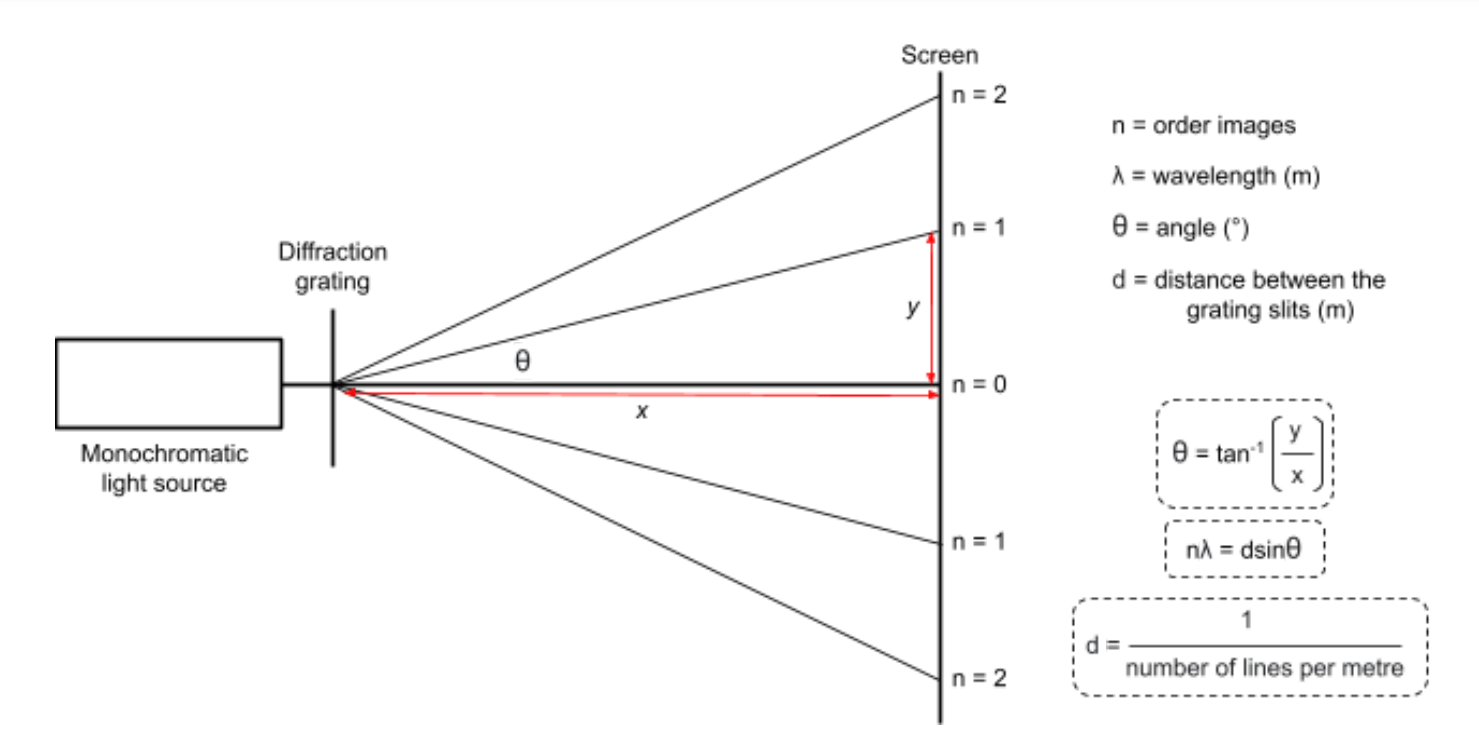
Procedure 1
1. Set up apparatus as shown.
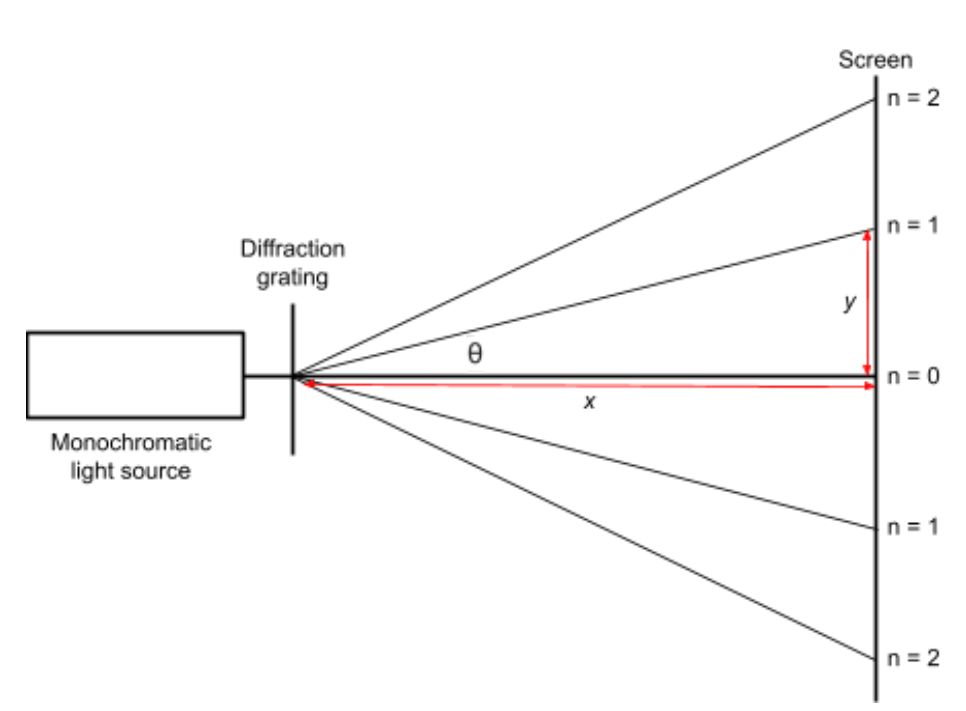
Procedure 2
2. Monochromatic light (laser) is shone through the diffraction grating.
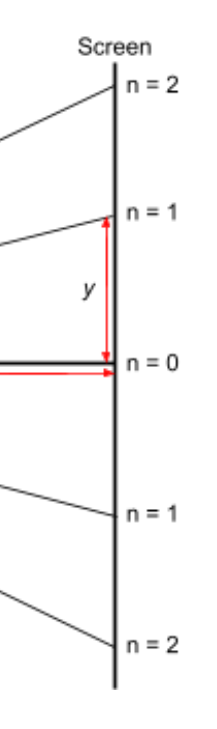
Procedure 3
3. A number of order images (n) appear on the screen.
Procedure 4
4. Measure the distance to the screen (x) with a ruler.
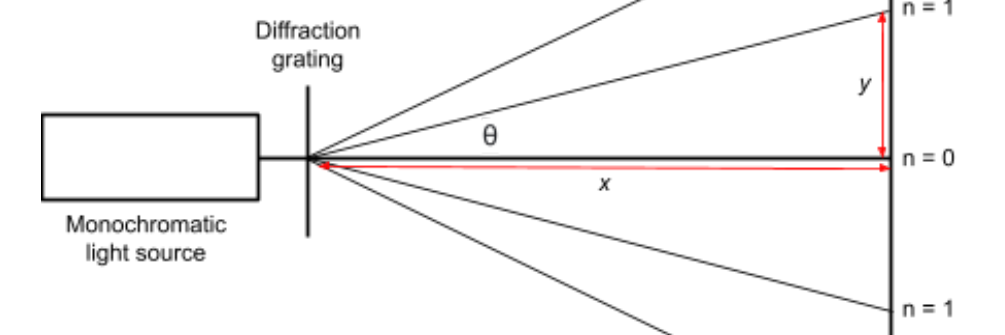
Procedure 5
5. Measure the distance to order images (y) with a ruler.
Procedure 6
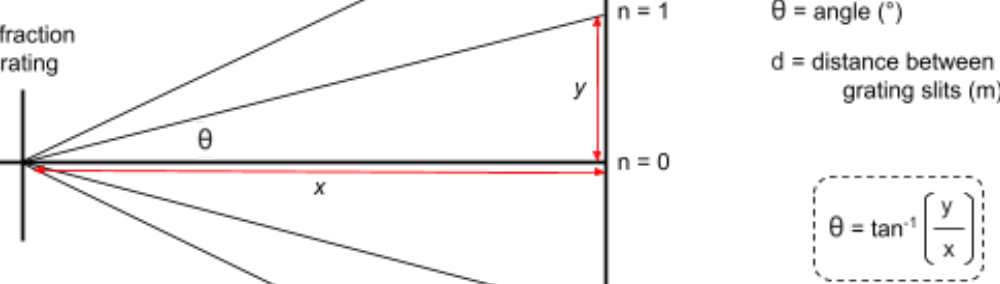
Use trigonometry to find θ.
( tanθ = y/x ) = ( θ = tan-1(y/x) )
Procedure 7
7. Use 𝑛λ = 𝑑𝑠𝑖𝑛θ to calculate the wavelength of light.
Procedure 8
8. Repeat for further order images.
Precautions & Errors
Ensure the screen is perpendicular to the light source (i.e. parallel to the diffraction grating) otherwise the readings on the left may differ to the readings on the right.
Use larger lines per mm to produce larger angles of diffraction and thus reduced percentage error.
Common Questions/Mistakes
How were the first order images identified? Immediately either side of the central image.
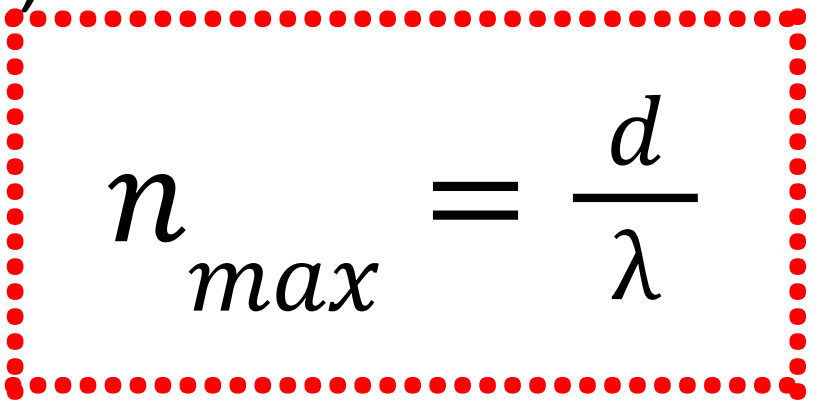
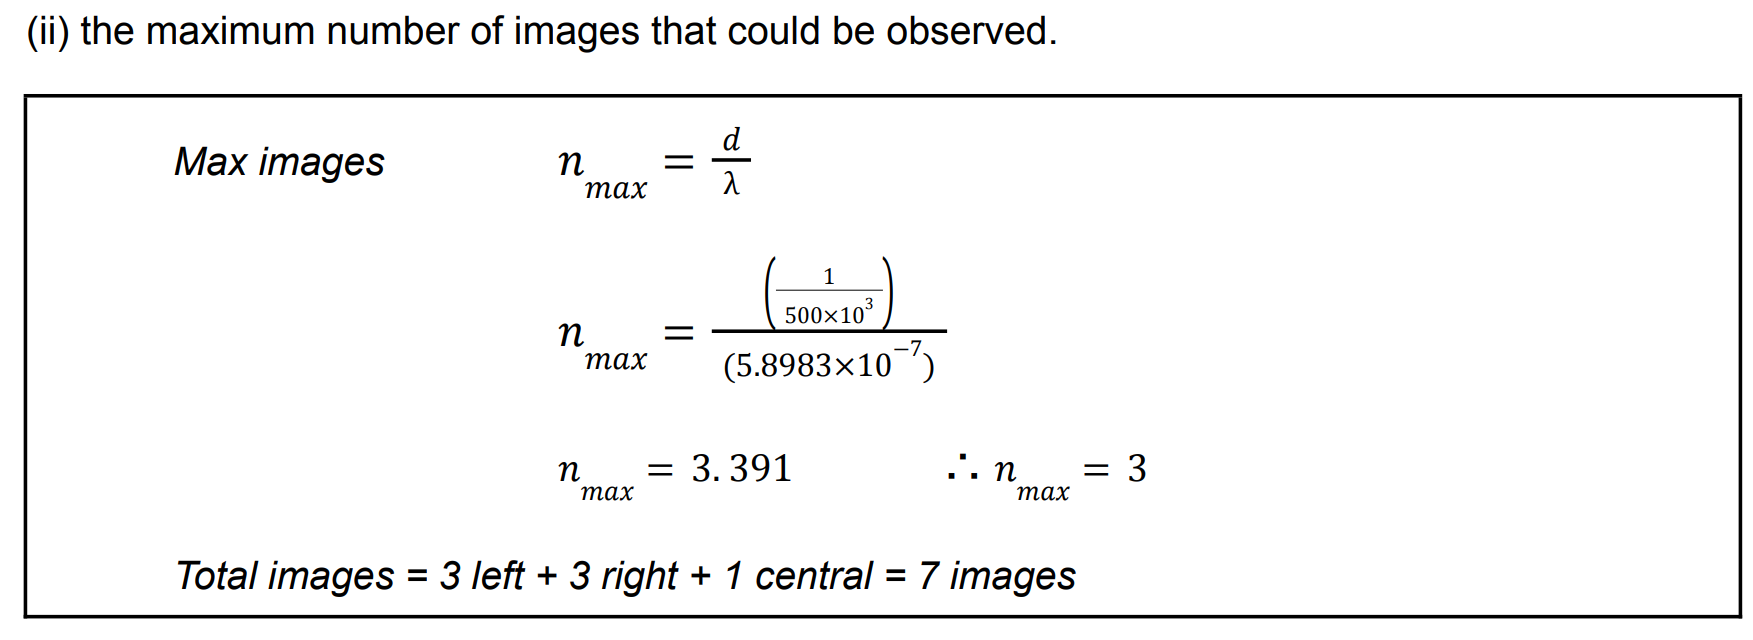
Maximum number of images that can be observed is calculated by allowing θ = 90 . 𝑜 Don’t forget to include the images left, right and the central bright image (equation only calculates images on one side).
How to find the Maximum number of images that can be observed? (nmax)
Maximum number of images that can be observed is calculated by allowing θ = 90 . 𝑜 Don’t forget to include the images left, right and the central bright image (equation only calculates images on one side).
Explain what would happen to the positions of the images if the wavelength of the light was decreased
Decreasing wavelength will decrease the angle between the order images.
Explain what would happen to the positions of the images if the diffraction grating was replaced with a diffraction grating of 300 lines per mm.
Decreasing number of lines per mm will decrease the angle between the order images. As there is less lines per mm in the diffraction grating the light hits less of the lines and so spreads less further so the angle is deceased between the order images and so the order image’s distance also decreases.
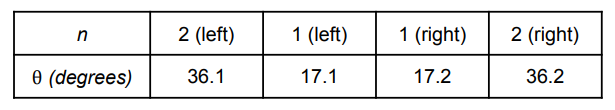
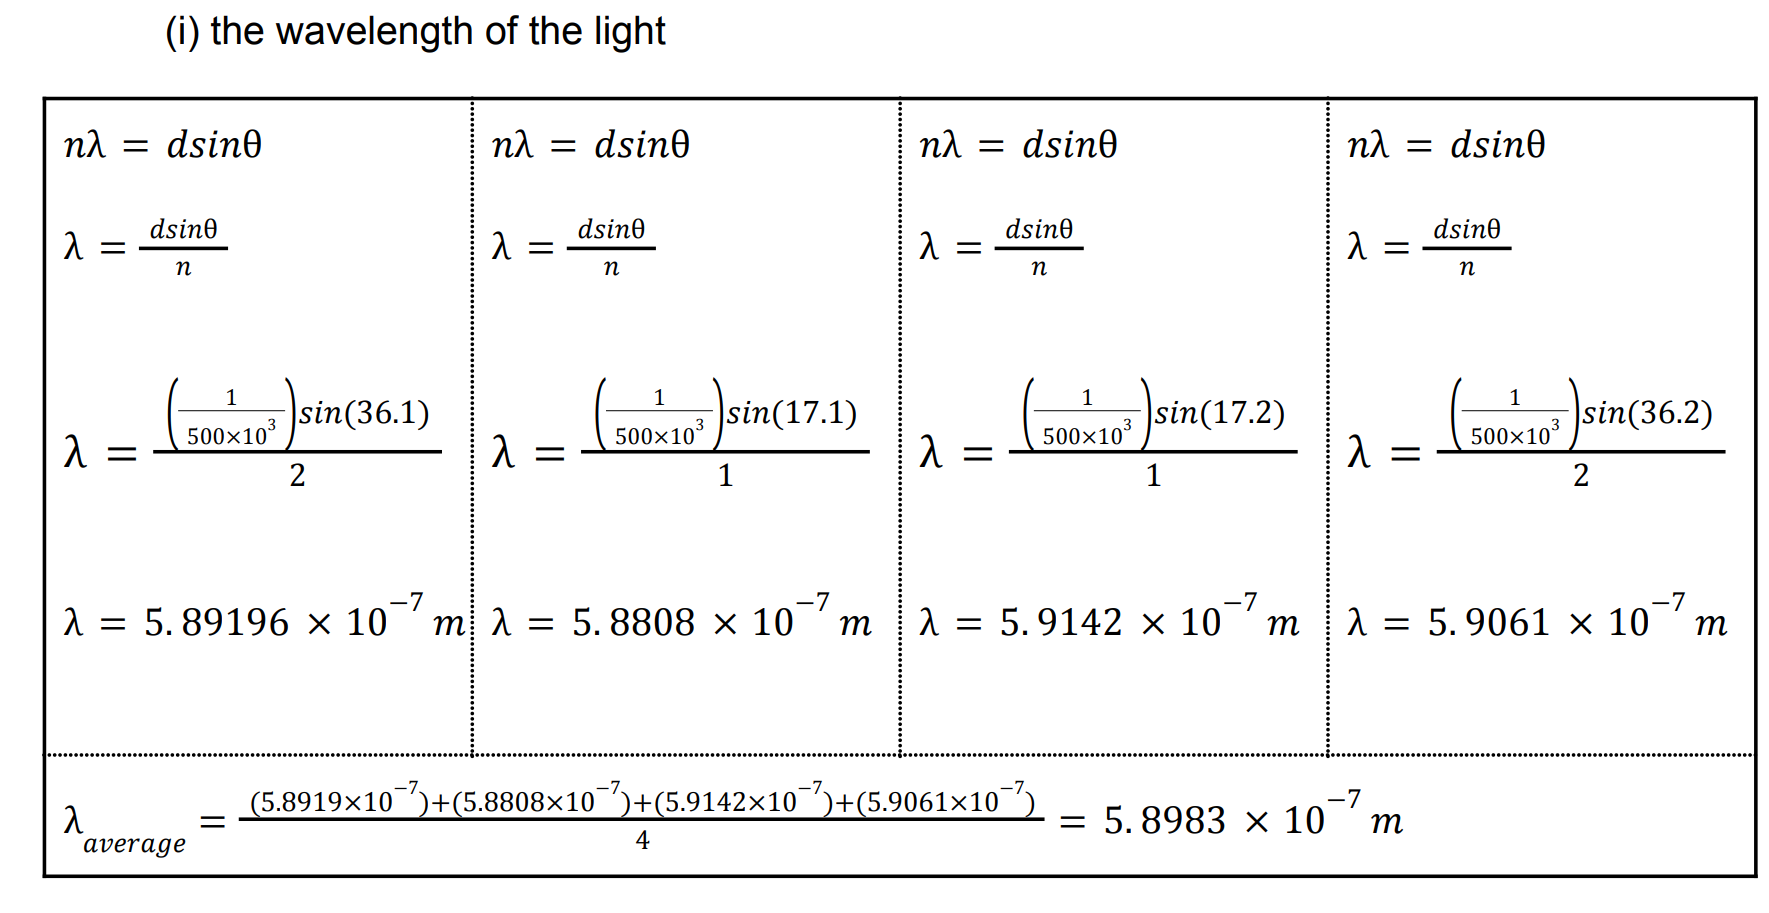
In an experiment to measure the wavelength of monochromatic light, the angles between a central bright image (n = 0) and the first and second order images to the left and right were measured. A source of monochromatic light and a diffraction grating of 500 lines per mm were used. The following data were recorded.
Example Q . (2-3)
Use the data to calculate
(i) the wavelength of the light
(ii) the maximum number of images that could be observed.
(i) The wavelength of the light
(ii) The maximum number of images that could be observed.
2023 - HL - Q3 - λ of Monochromatic Light - 40 marks
In an experiment to determine the wavelength of monochromatic red light, a collimated beam of light was incident perpendicular to a diffraction grating. The diffraction grating had 300 lines per mm. A series of images was observed on a screen placed 75 cm from the grating.
The distance between the third order images on the screen was measured. They were 1.04 m apart.
(i) Draw a labelled diagram of how the apparatus was arranged in this experiment.
(ii) How were the third order images identified? (15)
(i)
source of light [3]
screen/spectrometer [3]
diffraction grating [3]
arrangement [3]
[–1 if no label present on diagram]
![<p>(i) </p><p>source of light [3]</p><p>screen/spectrometer [3] </p><p>diffraction grating [3] </p><p>arrangement [3] </p><p> [–1 if no label present on diagram]</p>](https://knowt-user-attachments.s3.amazonaws.com/aba7b825-adcc-409c-8dc1-337b4a04df29.png)
(ii) How were the third order images identified?
Third image on both sides of central image [3]
(iii) Calculate the grating constant d.
(iv) Calculate the wavelength of the red light. (15)
(iii)
1/300000 ≈ 3.33 × 10⁻⁶ m [3]
REMEMBER: Diffraction grating (d) = 1/number of lines PER mm
(iv) Calculate the wavelength of the red light.
nλ = d sinθ [3]
1.04/2 = 0.52 (m) [3]
θ = 34.74° [3]
λ = 6.33 × 10⁻⁷ m [3]
(v) Describe how the pattern observed on the screen changes when:
(a) the diffraction grating is replaced with a diffraction grating of fewer lines per mm, (b) the red light is replaced with green light, (c) the screen is moved further away from the grating. (10)
(a)
Images are closer together [4]
(v) Describe how the pattern observed on the screen changes when:
(b) the red light is replaced with green light
Images are closer together [4]
(v) Describe how the pattern observed on the screen changes when:
(c) the screen is moved further away from the grating.
Images are further apart [2]