3.4 Market structures
1/61
There's no tags or description
Looks like no tags are added yet.
Name | Mastery | Learn | Test | Matching | Spaced | Call with Kai |
|---|
No analytics yet
Send a link to your students to track their progress
62 Terms
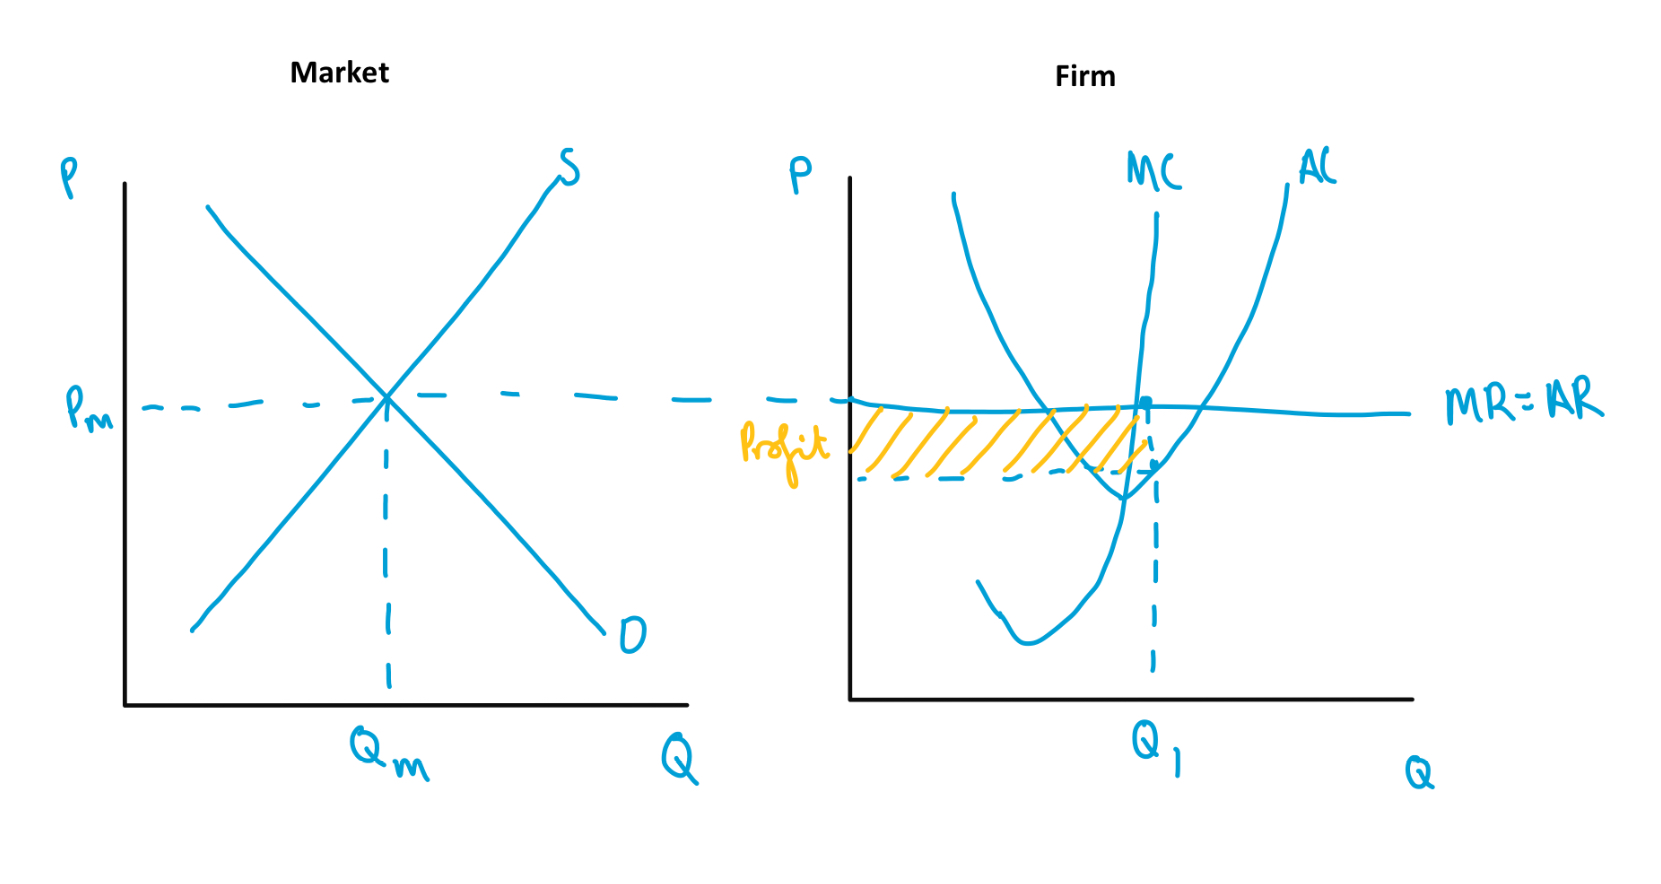
Perfect competition diagram in the short run
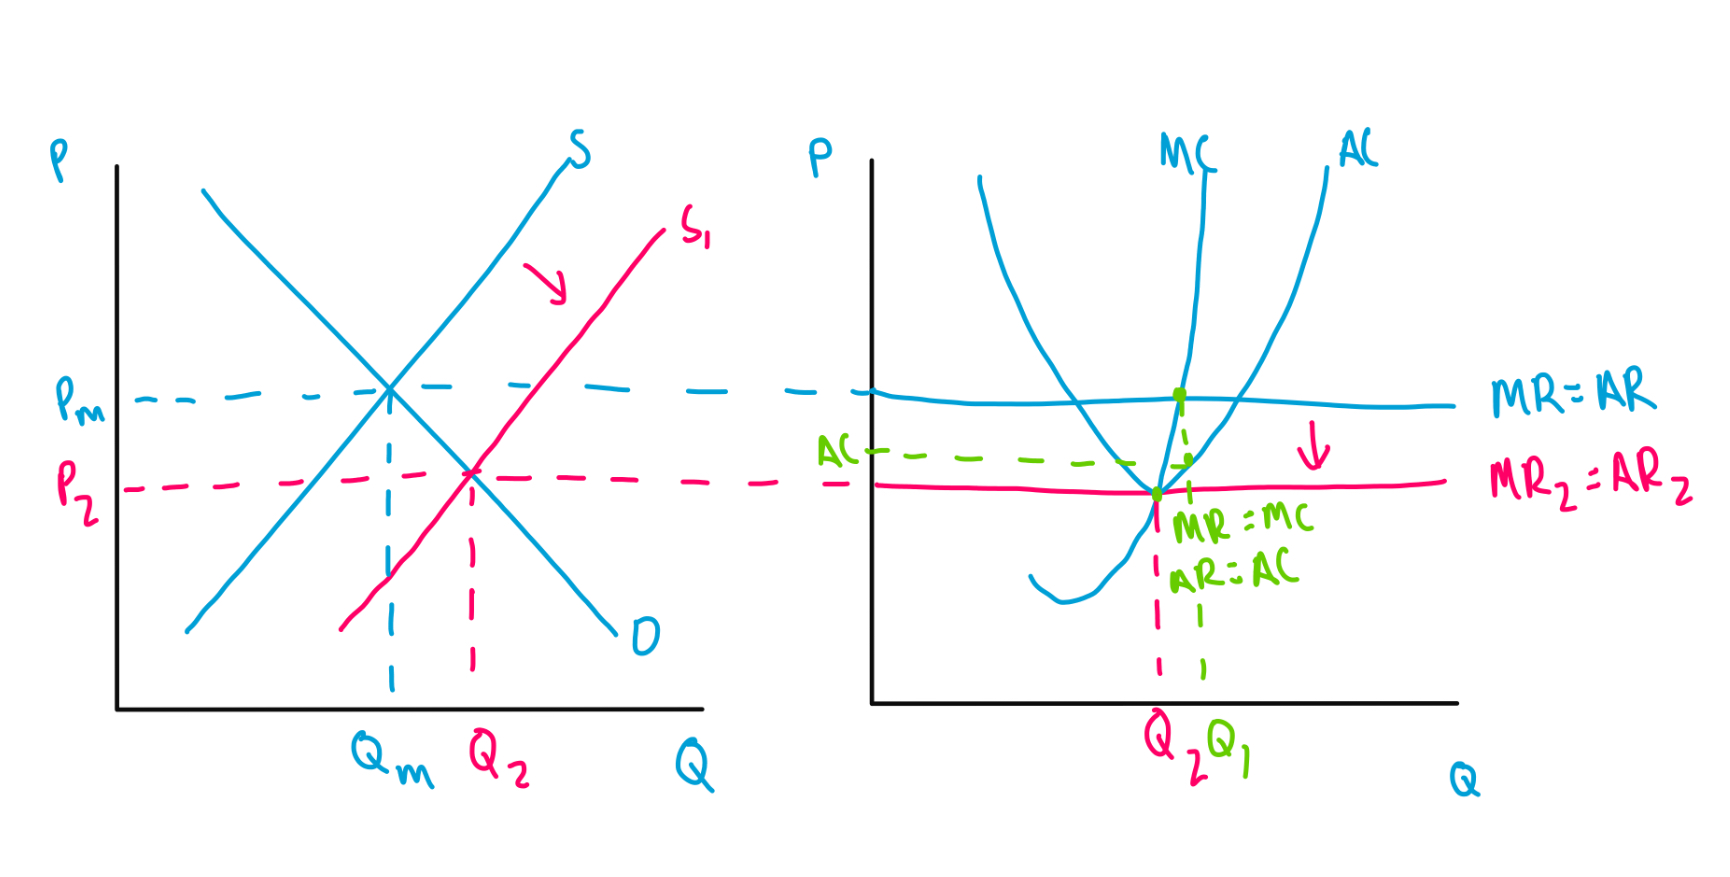
Perfect competition diagram in the long run
Perfect competition productive efficiency in short run
unlikely as not operating at bottom of AC curve
Perfect competition productive efficiency in long run
yes- firms cannot make a profit or loss in the long run, therefore must be operating at the bottom of the AC curve
Perfect competition allocative efficiency in short run
yes- as P=AR, AR=MR and MR=MC, P=MC, which is the condition for allocative efficiency
Perfect competition allocative efficiency in long run
yes- as P=AR, AR=MR and MR=MC, P=MC, which is the condition for allocative efficiency
Perfect competition dynamic efficiency in short run
no- profits are unlikely to be high enough to invest
and as firms have perfect information firms are not incentivised to innovate as other firms will copy them
Perfect competition dynamic efficiency in long run
no- firms can only make normal profit, so do not have enough to invest
and as firms have perfect information firms are not incentivised to innovate as other firms will copy them
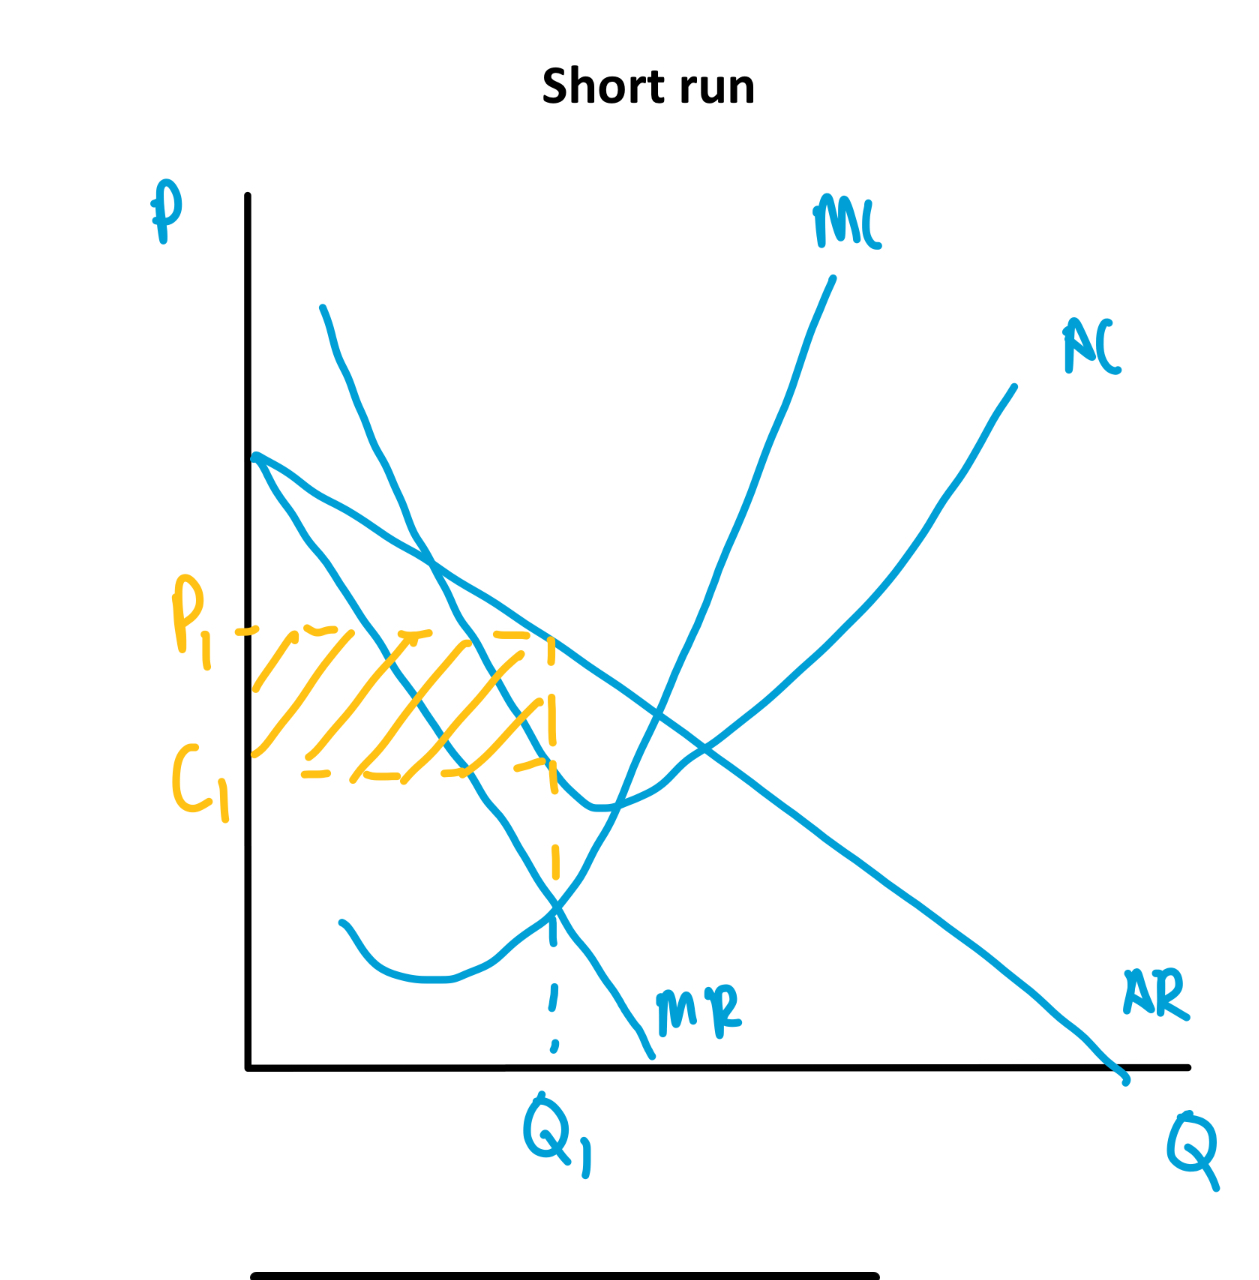
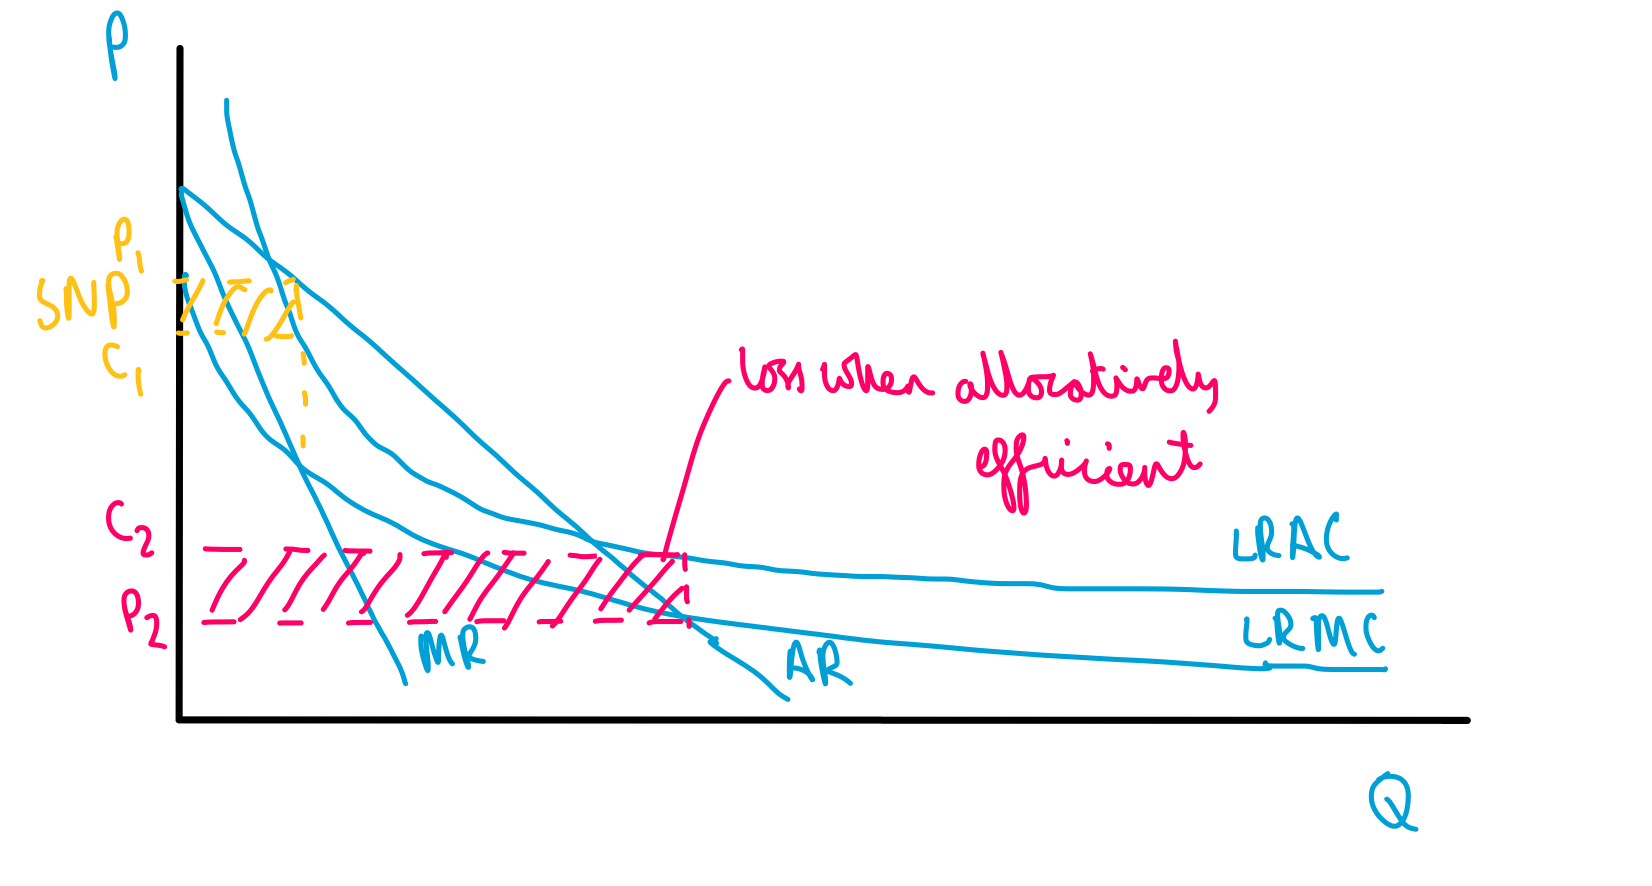
Short run Monopolistic competition
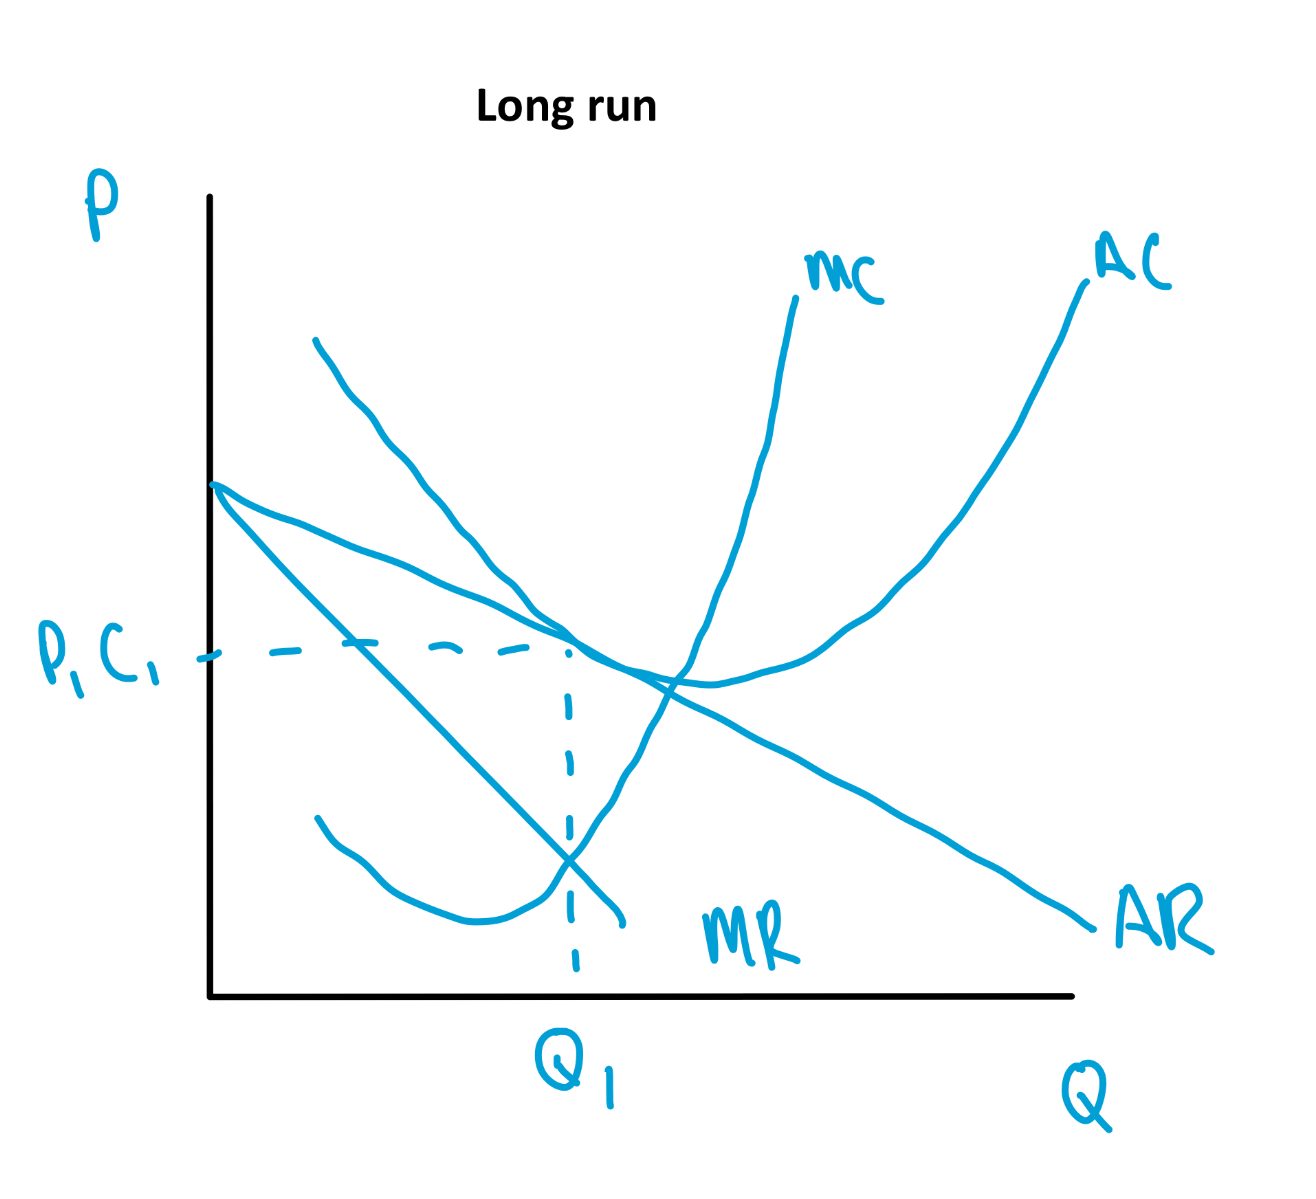
Long run Monopolistic competition
Example industries
restaurants
clothing stores
hairdresssers
nail salons
parcel delivery
Chain of analysis from short run to long run in monopolistic competition
AR and MR are steep in the short run as demand is more price inelastic for products
the existence of SNP incentivises more firms to enter the market, which is possible due to low barriers to entry
as firms enter the market, individual firms’ market share decreases
revenue curves/ demand curves shift in and left
there are more substitutes in the market, so demand becomes more price elastic
revenue curves become more shallow
revenue curves shift in until profits are normal, at which point firms stop entering the market
here AR=AC and this is the point at which firms are making normal profit
monopolistic competition productive efficiency in the short run
no as there is some differentiation between products
monopolistic competition productive efficiency in the long run
no- not perfect competition so firms are not forces to be productively efficient
monopolistic competition allocative efficiency in the short run
no as firms will set prices above MC
monopolistic competition allocative efficiency in the long run
no
monopolistic competition dynamic efficiency in the short run
small amount to differentiate products
monopolistic competition dynamic efficiency in the long run
no as there are no SNP
oligopoly kinked demand curve
concentration ratio defention
a measure of how concentrated a market is
monopoly productive efficiency
unlikely to produce at the bottom of the AC curve as they can charge higher prices which consumers are forced to pay
monopoly allocative effiiciency
no as the point at which AR=MC is below the profit maximising point, so the good will be underconsumed
monopoly dyanmic efficiency
potentially due to presence of SNP, however unlikely due to lack of pressure from competition, depends on level of contestability
Natural Monopoly diagram
Why is LRAC downward sloping for a monopoly
economics of scale due to very high fixed costs and low marginal costs, as natural monopolies are often utilities
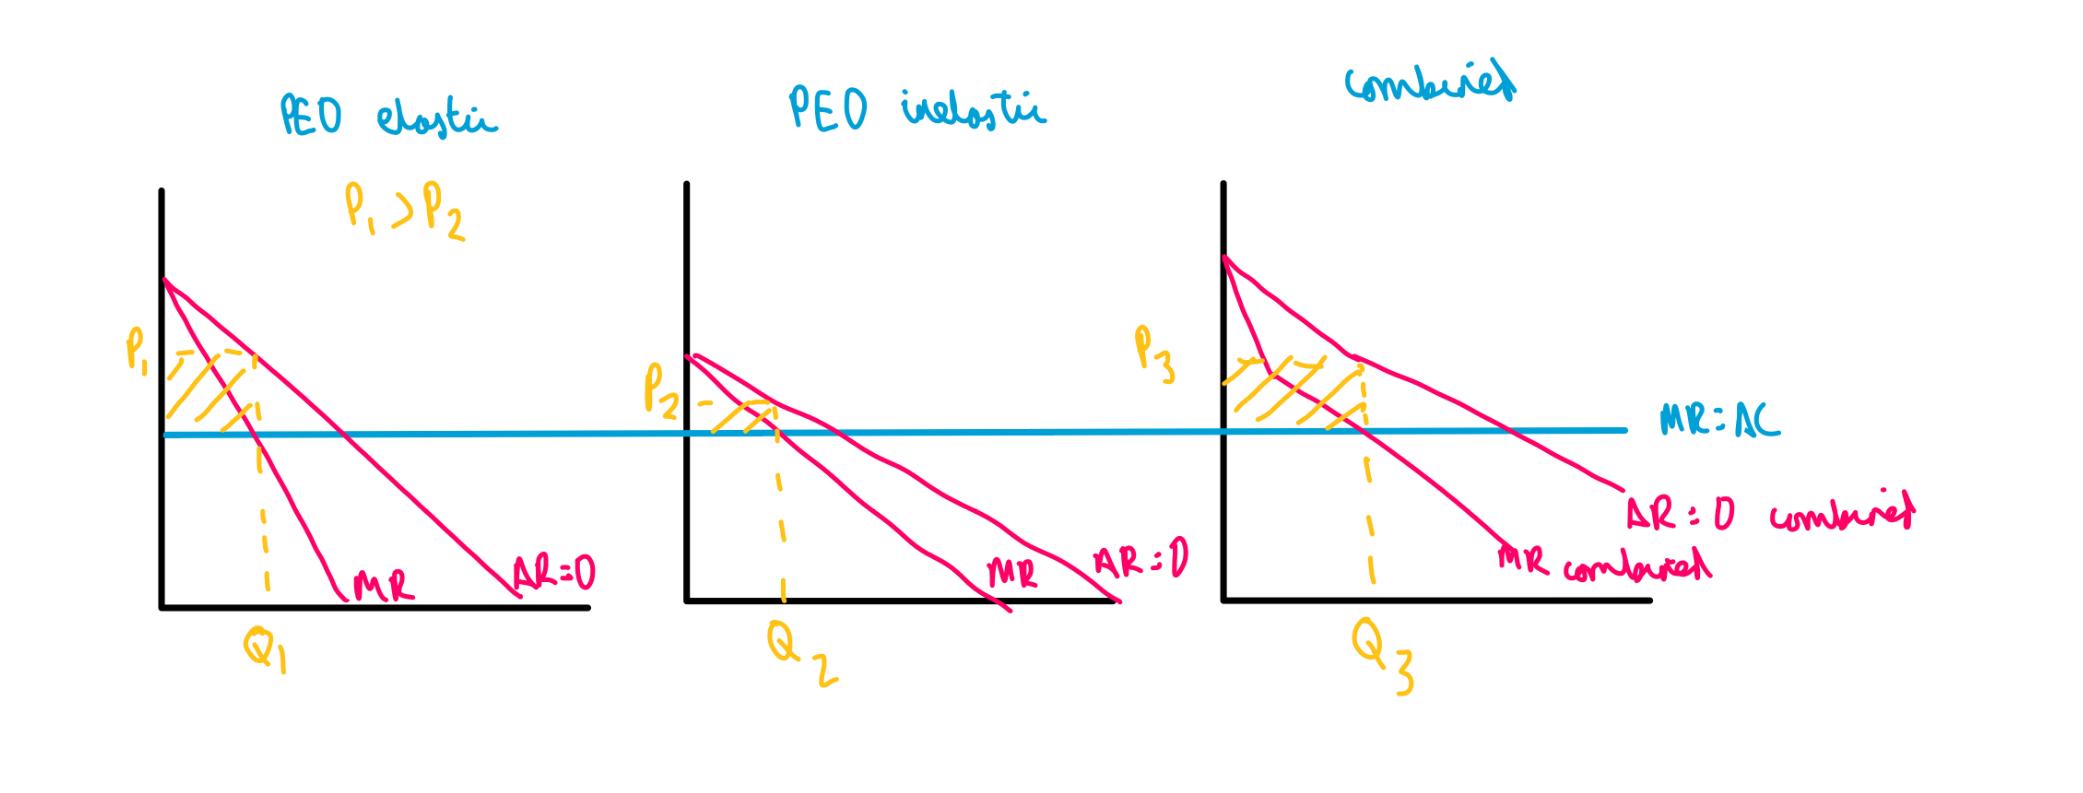
What is third degree price discrimination
when a seller charges different prices to different segments of customers for the same product
3 diagrams to show how third degree price discrimination is used in a market segment with price inelastic demand, price elastic demand and the overall marke
benefits to firms of price discrimination
increase revenue, might allow some firms to stay in business when they otherwise would have made a loss
benefits to consumers of price discrimination
spreads out demand eg for trains, reducing congestion
increases revenue for firms leading to SNP potential for dynamic efficiency and innovations
higher earners essentially subsidise lower earners
drawback to firms of price discrimination
administrative costs in separating the markets
drawback to consumers of price discrimination
some consumers will end up paying higher prices, which is likely to be allocatively inefficient
decline in consumer surplus
those paying lower prices may not be the poorest
profits could be used to finance predatory pricing
define efficiency
making optimal use of scarce resources
Productive efficiency
occurs at the level of output at which a firm operates at its lowest possible average cost
so minimum point of AC curve, which is where MC=AC
Allocative efficieny
occurs at the level of output where price=marginal cost, or where AR=MC
goods and services are produced in the quantities that best satisfy consumer preferences and maximise social welfare
X-efficiency
occurs when a firm minimises AC at a given level of output (so not necessarily the minimum point on the AC curve)
static efficiency
includes productive, allocative and x-efficiency
how well resources are being used at one point in time
dynamic efficiency
when potential gains to efficiency are maximised over time through R&D leading to invention and innovation
If an economy is productively efficient, where would it be on a PPF
on the PPF curve
DWL from allocative efficiency
what can x-inefficiency be caused by
wasteful and inefficient spending, eg. company retreats or excessive benefits
how are productive and x-efficiency different
productive efficiency only occurs at one output level, whereas x-efficiency can occur at any level of output
types of innovation
product innovation: improvements to products like adding face ID
process innovation: improvements to the way products are made/sold eg. online shoppig
what effect will dynamic efficiency have on the LRAC curve
shift LRAC in in the long term, as higher output per worker will be enabled
what is nessecary for dynamic efficiency
high profits
does dynamic efficiency lead to more or less competition in markets
depends upon whether it builds monopoly power
condition for monopoly
25% or greater market share
oligopoly defenition
a market in which a few large firms dominate
oligopoly concentration ratio
5 firm concentration ratio must be greater than 60%
characteristics of an oligopoly
5 firm concentration ratio is greater than 60%
compete through non-price competition
high barriers to entry and exit, especially through advertising, heavy spending on product development and R&D
ease of entry to the market is harder for smaller firms
interdependence
possibility for collusion
3 ways firms can choose prices in an oligopoly
price leadership
price agreement
price wars
pricing game payoff matrix
assumptions of matrix
only two firms
perfect information
simple 2 choice stratergy
what is both firms dominant stratergy
high output
what is the nash equilibrium
both high output
nash equilibrium meaning
both players play dominant strategy
dominant strategy meaning
best choice regardless of what other firm does
do the firms have an incentive to deviate from the nash equilibrium
no, as it would lower their profits
what would collusion lead to
both produce at a low output. however this may be unsustainable, as there is an incentive for each firm to switch to high output to increase their profits
types of collusion
horizontal collusion
vertical collusion
overt collusion
tacit collusion
why do firms collude
to maximise profits, eg. by reducing wasteful spending on marketing
collaboration that isnt legally collusion
sharing information that improves consumer safety
working to improve information that customers have access to
improving production or distribution of goods
overt collusion
when firms actively make an agreement to collude