Week 9: correlational analysis
1/14
There's no tags or description
Looks like no tags are added yet.
Name | Mastery | Learn | Test | Matching | Spaced |
|---|
No study sessions yet.
15 Terms
What does bivariate mean?
two variable/participant
What is a positive correlational relationship?
When a goes up, b goes up
What is a negative correlational relationship?
When a goes up, b goes down
What has happened if i have a perfect relationship?
I’ve measured the same thing two different ways OR I’ve cheated
What is the purpose of a correlation analysis?
To determine:
whether there is a linear relationship between two variables
The direction of the relationship
The strength of the relationship
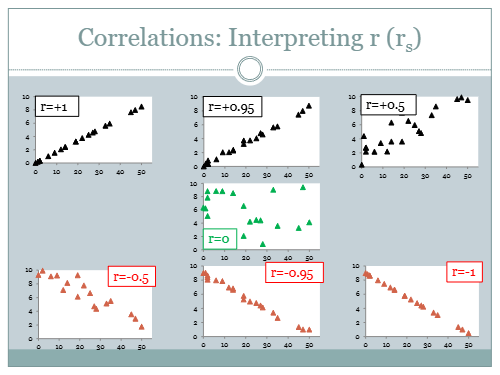
What is the pearson correlation coefficient
r
Value between -1 and 1
Positive value = positive correlation
Negative value = negative correlation
The stronger the relationship, the closer the r is to ± 1
measures how close the data is to the line of best fit
What is the spearman correlation coefficient
rs (s is subscript)
What makes correlational analysis distinct from other analyses?
Correlation makes no distinction between the dependent and independent variable
Correlation coefficients DO NOT change if we change the units of measurement
No manipulation occurring
How do we approach linear and non-linear relationships?
Linear: measuring correlations ok
Non-linear: measuring correlation does not make sense, might need to transform data
r value of 0 = no linear relationship between 2 variables, not necessarily no relationship at all
Outline the pearson r value and its pros and cons
Calculated directly from raw scores
Suitable for data on an interval or ratio scale
Highly affected by outliers
Not suitable for skewed data
More powerful than the spearman r
Outline the Spearman rs value and its pros and cons
Calculated from the ranking of the raw scores
Suitable for data on an ordinal scale
Marginally affected by outliers
Suitable for skewed data
If it looks a bit weird, go for Spearman

Outline the chi-square test for goodness of fit
x²
Use on unrelated data- every participant yields data for only one category
Used to answer questions about the proportions of a population distribution
Used to compare different levels of ONE variable
Compares the sample proportions to population proportions as specified by the null hypothesis
Non-parametric, can use with data of lower levels but not ratio or interval
Outline parametric tests
Both types of tests are available to test for significant differences between data sets
Make assumptions about population parameters (are distribution dependent)
Require interval or ratio scale data
Violation of test assumptions lead to erroneous interpretations of the data
Outline non-parametric tests
Make no assumptions about population parameters (are distribution free)
Use data at nominal level
Not as powerful, can fail to detect differences
More robust, can utilise a greater range of data
outline the chi squared test of independence
are two separate variables independent or associated?
still mutually exclusive
H0 = the two variables are completely independent from each other
H1 = there is a relationship between x and y, or, the proportion of x to y is different in these categories