displaying data- measures of dispersion
1/37
There's no tags or description
Looks like no tags are added yet.
Name | Mastery | Learn | Test | Matching | Spaced | Call with Kai |
|---|
No analytics yet
Send a link to your students to track their progress
38 Terms
measures of dispersion definition
a measure that shows the spread of data, whether it is tightly clustered or has a broader spread
2 ways of calculating measures of dispersion
range, standard deviation
what is the range
a value that shows the spread of data, representing the difference between the lowest and highest scores
how to calculate the range
take the lowest score from the highest score and add 1
standard deviation definition
a value that represents the amount of variation of the results from the mean score
what is a small standard deviation
scores are clustered near the mean
what is a large standard deviation
scores are spread widely from the mean

what is this
the formula for standard deviation
how to calculate the standard deviation
calculate the mean for the data. subtract the mean from each score in the sample. square the result of these calculations. add the squared numbers together to find the sum of the squares. divide the sum of squares by n-1. square root

what is the x in the equation
each score in the data set

what is the x with a line above it
the mean of the data set

what is the sigma
the sum of

what is the n
number of scores in the data set
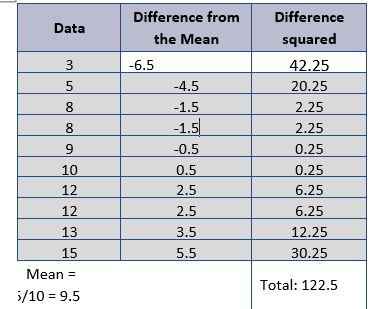
what is this an example of
table to calculate standard deviation
3 strengths of the range
easier to calculate than the standard deviation. gives an indication about the consistency/reliability of the data. appropriate for frequency data or ordinal data
2 weaknesses of the range
influenced by anomalous results- a problem because only the highest and lowest scores are considered in the calculation. doesnt consider distribution of scores around the mean, therefore we are unsure if the results are similar or spread out
4 strengths of standard deviation
more sophisticated/representative measure of dispersion than range- reflects every score in data set. gives indication of how close scores are to the mean (in a normal distribution). less sensitive to anomalies than range. appropriate for interval or ratio data
2 weaknesses of standard deviation
more time consuming to calculate compared to the range. not all scores will be within one standard deviation so it can be misleading when it comes to anomalies
what is a normal distribution
a type of distribution where the mean, median and mode are equal. can be referred to as a bell curve
examples of normal distributions in real life
height, weight, shoe size
5 features of a normal distribution
bell shaped. has mean, median and mode together at midpoint. symmetrical at midpoint. 50% of scores are to the left and 50% to the right. curve end points meet at y axis
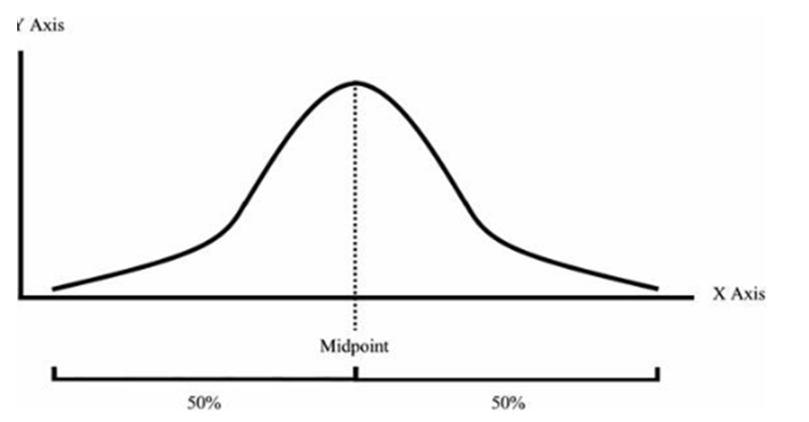
what is this an example of
normal distribution curve
what is a positive skewed distribution
the most common score (mode) is lower than the median, and is also lower than the mean. bunched to the left and tail to thr right.
in cases of positively skewed distribution, what happens to the central tendency? (mean,median and mode)
decrease in value
what is a negative skewed distribution?
the most common score (mode) is greater than the median, and is also greater than the mean. bunched to the right and tail to the left
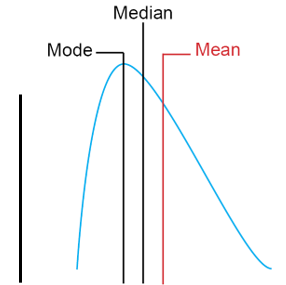
is this positive or negatively skewed
positive skewed
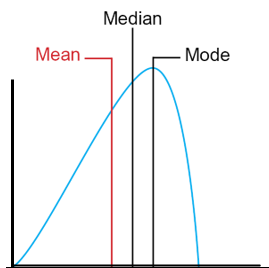
is this positively or negatively skewed
negative skewed
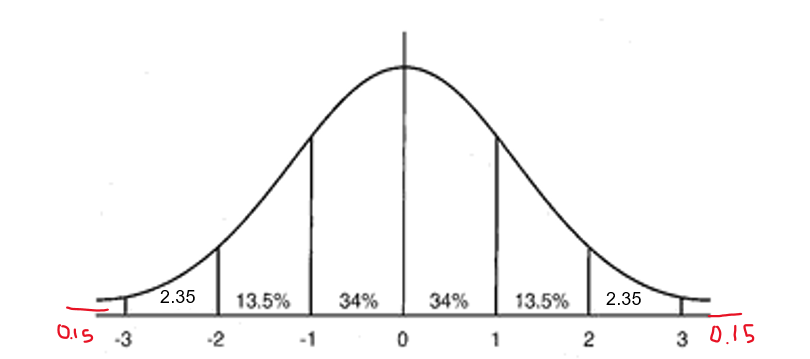
what isthis
standard deviation curve
what percent of data falls within ONE standard deviation, either side of the mean?
68%
what percent of data falls within TWO standard deviations, either side of the mean?
95%
what percent of data falls within THREE standard deviations, either side of the mean?
99.7%
what numbers are probabilities written from and to
0-1
what is a probability value and what is it usually?
a numerical value that gives an indication of the likelihood that results are due to a real difference/correlation and not due to chance. usually 95%
what is a significance level and what is it usually?
a numerical value that is usually expressed to two decimal places. tells you the margin of error than could occur in your results. usually 0.05
what does a significance level of 0.05 tell you
there is a 5% probability that the results are due to chance and not the correlation between variables
what is a strict significance level
0.01
what is a lenient significance level
1