ERTH2404-L11: Permafrost, Groundwater and Earth Resources
 Call Kai
 Learn
Learn Practice Test
 Spaced Repetition
 Match
Match Flashcards
 Knowt Play
1/144

There's no tags or description
Looks like no tags are added yet.
Name | Mastery | Learn | Test | Matching | Spaced | Call with Kai | Chat |
|---|
No analytics yet
Send a link to your students to track their progress
145 Terms
Permafrost
Permafrost: Permafrost is ground (soil or rock, incl. underwater sediments) that remains at a temperature of 0°C or lower for at least two consecutive years. In other words: permanently frozen ground (soils + rock)
NOTES:
• Definition based exclusively on temperature, regardless of composition, texture or water content
• Refers to the ground that remains below 0°C for at least two consecutive years.
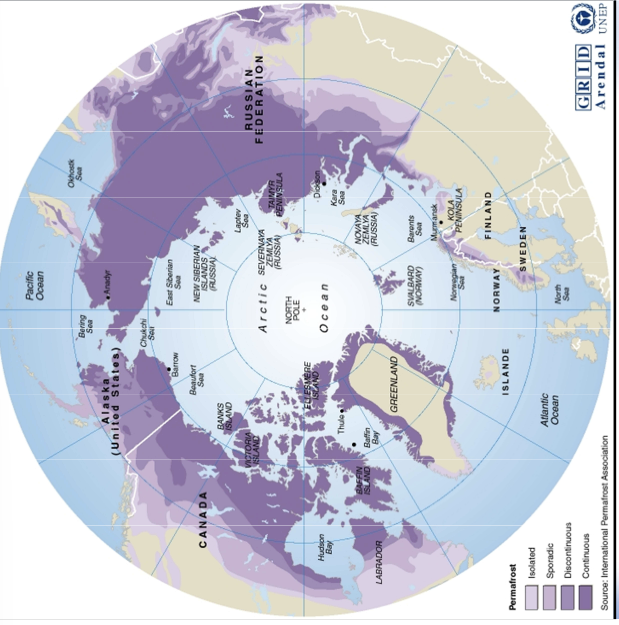
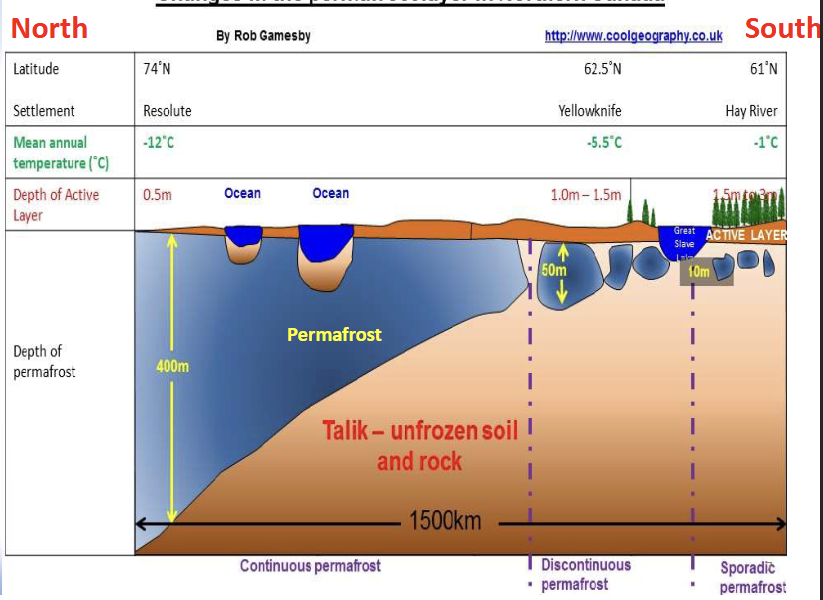
• Permafrost grades from deep (1000 m) and continuous in the North to thin (30 cm) and discontinuous further South
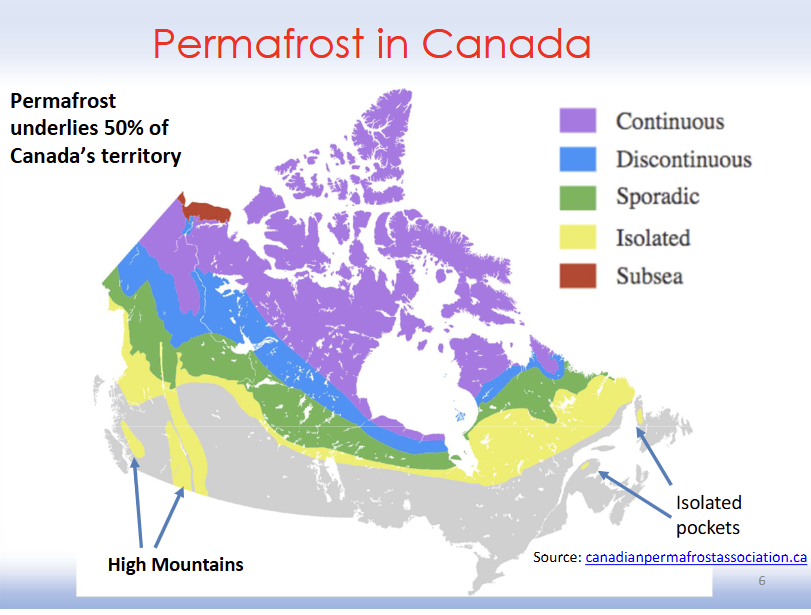
Permafrost in Canada
Permafrost underlies 20% of the Earth’s land surface and 50% of Canada’s
← look at the patterns of permafrost throughout Canada
Changes in the permafrost layer in Northern Canada
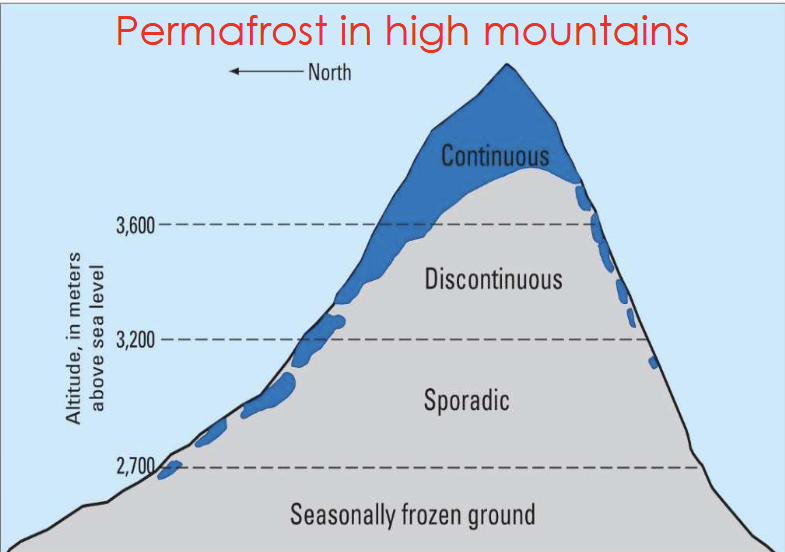
Permafrost in high mountains
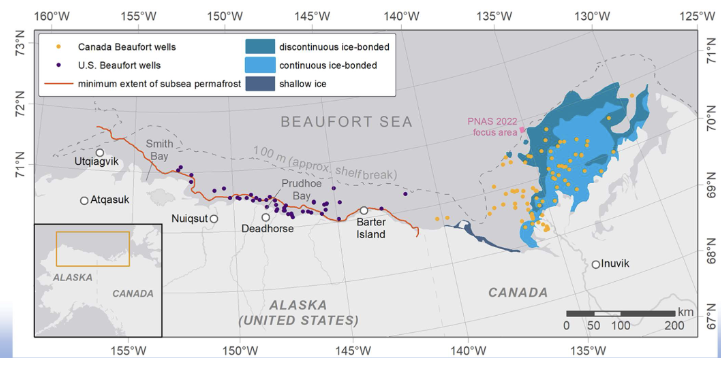
Subsea Permafrost
It exists! Since the end of the Last Glacial Maximum (~21,000 years ago), rising sea levels have inundated terrestrial permafrost surrounding the Arctic Ocean, resulting in subsea permafrost...
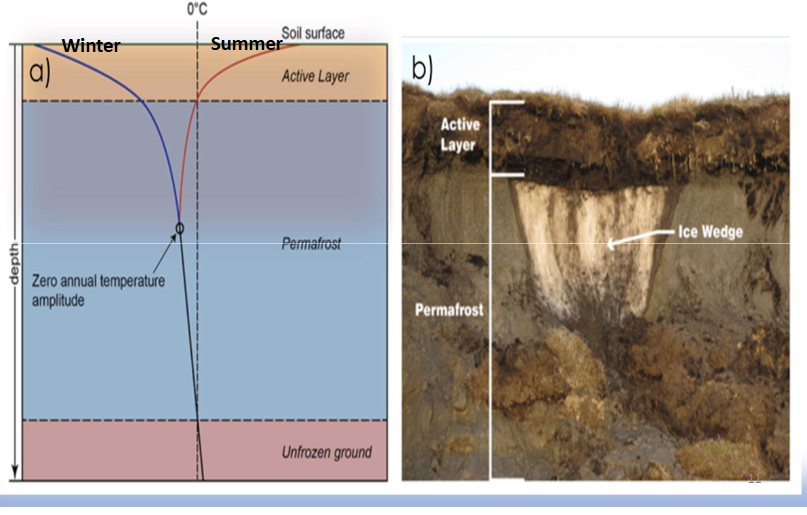
Active layer
Permafrost
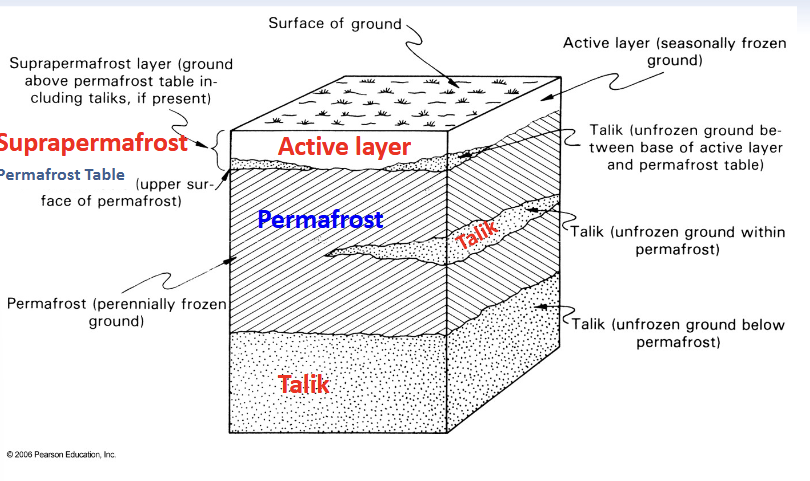
Active layer: near-surface layer that thaws in the summer and freezes in the winter. The active layer in Canada is generally 0.5 m to 2 m thick.
Suprapermafrost
Permafrost
Suprapermafrost: active layer and taliks (pockets of material that never freezes)
Permafrost table
Permafrost
Permafrost table: boundary between the suprapermafrost layer and permafrost
Thermal profile
look closely at diagrams
Layers of permafrost
← look closely at diagram
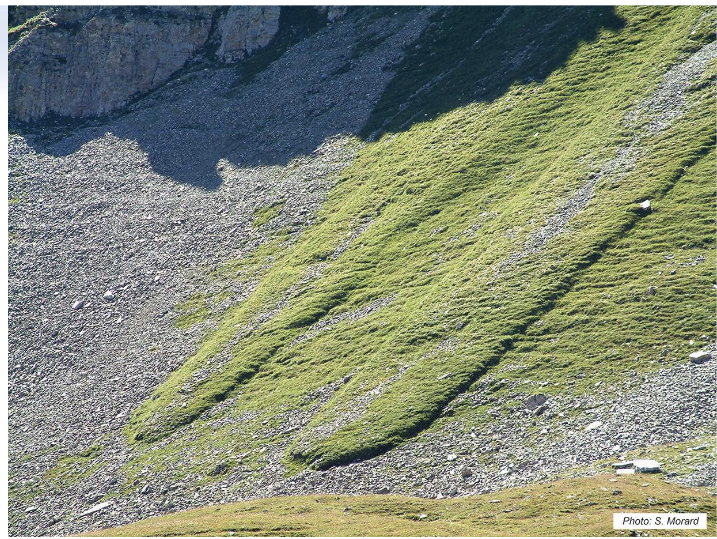
Gelifluction
Permafrost
Gelifluction: mass movement linked to the thawing of the active layer
• Similar to creep but with a permafrost base
• Water cannot drain through the permanently frozen, impermeable layer below
• Soil becomes saturated and weak, and flows down gentle slopes as a lobate mass
Solifluction
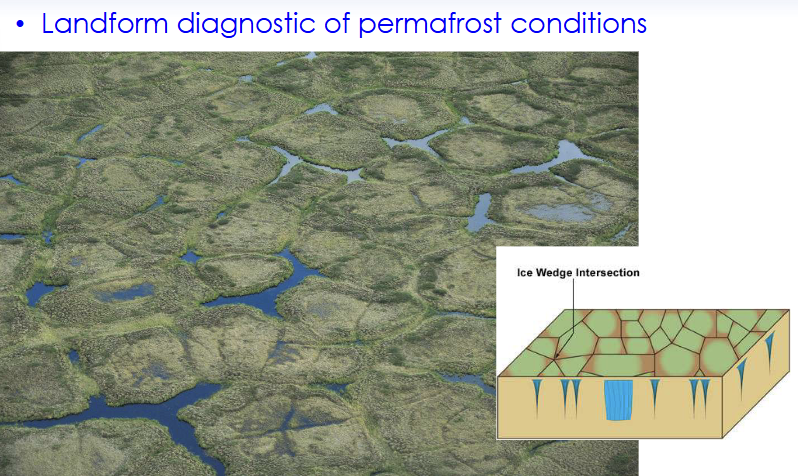
Permafrost: Ice-wedge polygons
Why is permafrost changing?
Permafrost is controlled by the energy balance at the ground surface (energy received versus energy dissipated and lost). If that changes, so will ground temperatures and the characteristics of the permafrost.
Changes can come from:
• a warming climate
• deeper snow cover
• surface disturbance (possibly due to human activities).
All of these increase the thickness of the active layer, resulting in thaw of the top layers of the permafrost and if this continues for decades, potentially the loss of the entire permafrost body.
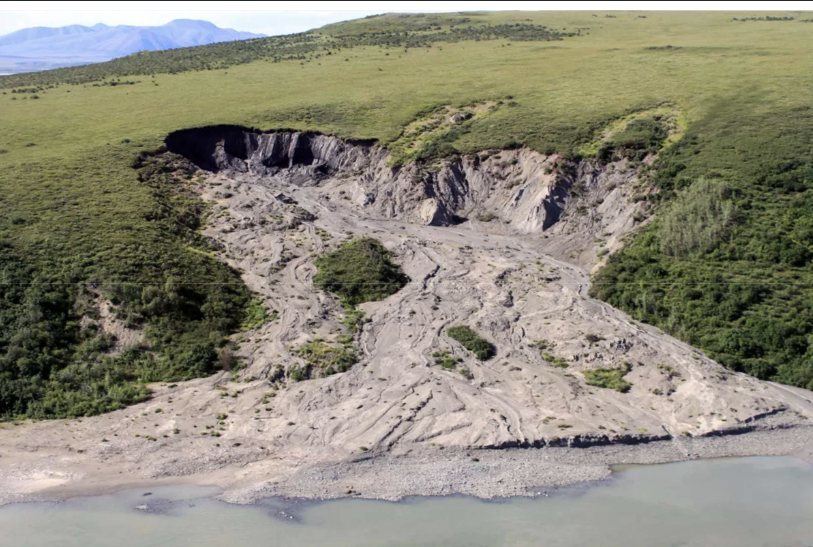
Where permafrost contains a lot of ground ice, its thaw results in thermokarst processes, which include subsidence and landsliding.
Relation between Climate Change and Permafrost
• Future greenhouse gas additions to the atmosphere as organic material (mostly plant matter) currently stored in the frozen ground defrosts and is broken down by bacteria into two greenhouse gases: carbon dioxide (CO2) or methane (CH4).
• This is termed the permafrost carbon feedback.
Engineering considerations for permafrost
Engineering problems linked to permafrost:
Unwanted thawing of the active layer under either unheated (e.g. roads) or heated (e.g. buildings) structures
Result of unwanted thawing :
• Soil loses strength
—• Subsidence
—• Liquefaction and slope instability
Frost heave: uplift of the surface as the active layer freezes in the winter
Noatak National Preserve, Alaska, 300 m long slump
Engineering consideration: Frost heave (1)
Related to permafrost
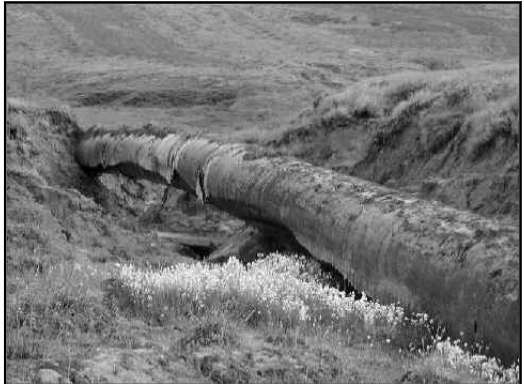
ex. Pipeline raised above ground as a consequence of buckling in association with frost heave.
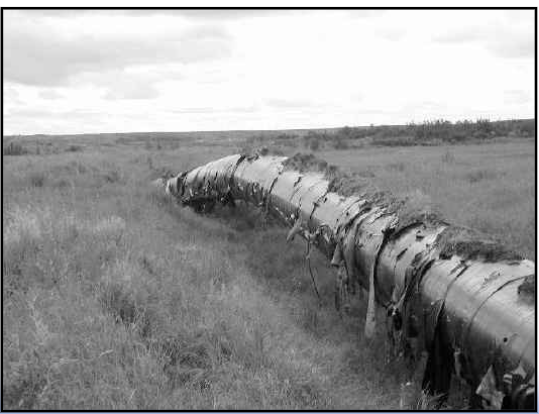
Engineering consideration: Frost heave (2)
Related to permafrost
ex. Pipeline exposed as a consequence of erosion of soil and backfill, following loosening of these materials by repeated frost heave and subsequent thaw
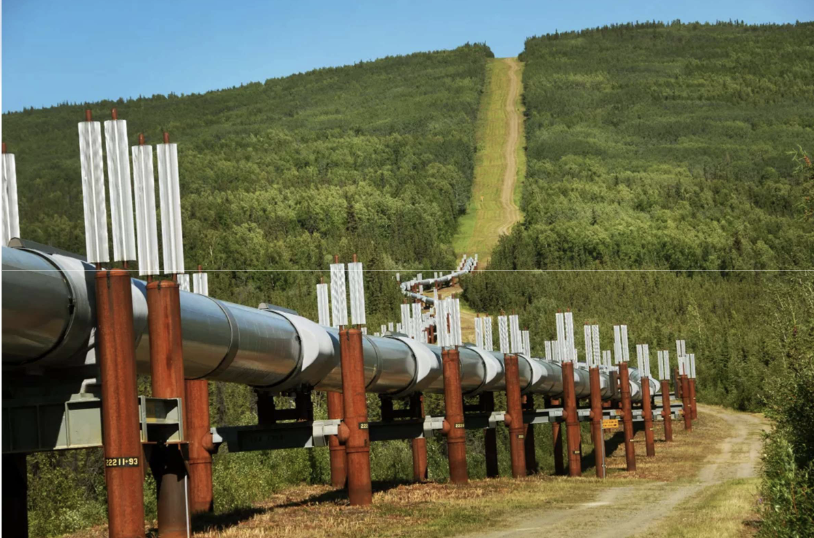
Engineering solution to frost heave in pipelines
Engineers elevated sections of the Alaskan Pipeline so the warm oil would not thaw the permafrost.
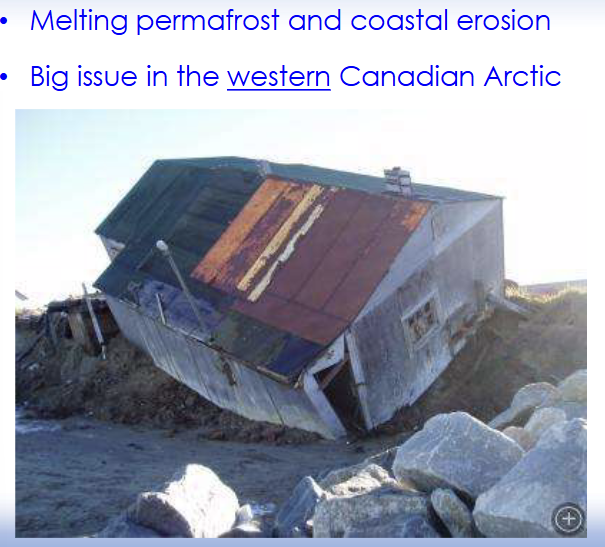
Melting permafrost and coastal erosion in the Western Canadian Arctic
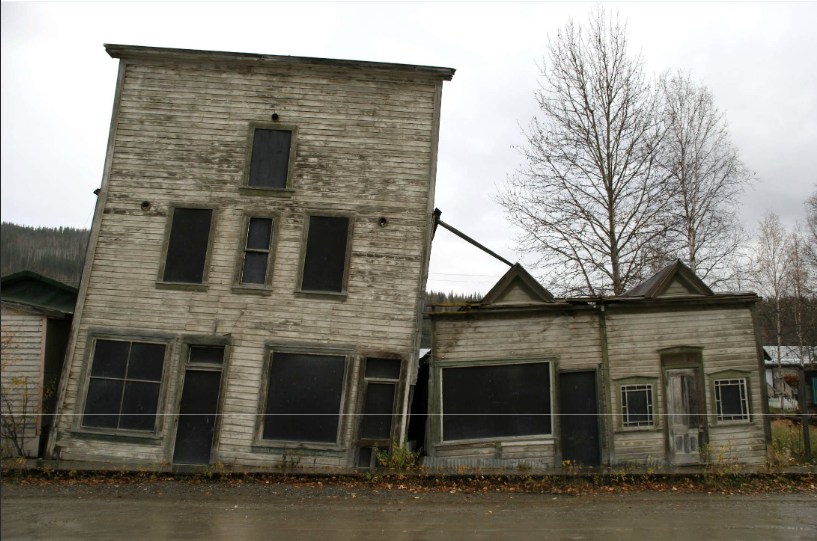
Dawson City, Yukon
Example that did not consider permafrost
Engineering consideration: Mitigating unwanted thawing of active layer
Mitigation of unwanted thawing of the active layer:
• Where active layer is thin, the ground is allowed to thaw and spread footings are used
• Roads and railroads built on an insulating pad of non-frost-susceptible soil
• Buildings can be constructed on piles
• Artificial ground freezing can be used to increase the strength of the ground temporarily to build tunnels, caverns, or shafts
Strategies for construction on permafrost
• Minimum disturbance of soils and vegetation cover. Keep shading from trees
• Elevate and properly insulate the bottom of houses to prevent heat losses through the floor system from reaching the ground underneath, which can lead to thawing.
• If wood or steel piles or helical piers are used, they must be installed to a depth that will both support the structure and resist frost jacking from seasonal ground movement.
• Keep water away from house; engineered septic systems that does not thaw permafrost
GROUND WATER
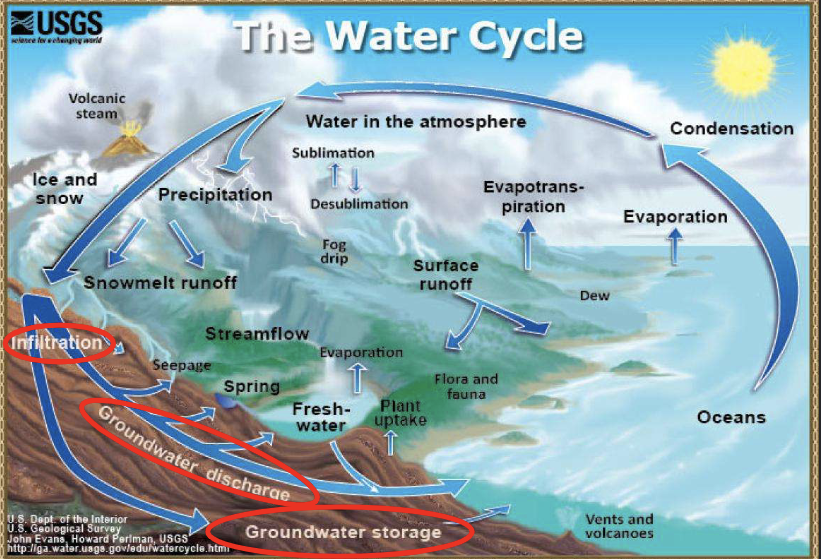
Hydrologic Cycle (or Water cycle)
The hydrologic cycle (or Water cycle) describes the constant exchange of water between oceans, atmosphere and continents
• It has been operating on Earth for over 4 billion years
Hydrosphere
Hydrosphere: the global waters of the Earth
• Liquid and solid
• Fresh and salty
Total volume of water on Earth and distribution
Total volume of water on Earth = 1.36 billion km3
• 97.20 % seawater
• 2.15 % glacier ice
• 0.62 % groundwater (20 times the volume of lakes, rivers, etc)
• 0.03 % inland seas, lakes, rivers, moisture in soil, atmosphere
Global freshwater: 8.84 X 10⁶ km3
• If we divide by the surface of Canada: 10 X 106 km2
• It corresponds to 1 km deep layer over the surface of Canada
Why do people rely on groundwater?
Groundwater is the largest reservoir of fresh water readily available to humans
• 94% of Earth’s available fresh water is groundwater (excluding glaciers)
Surface water is often limited in quantity
NOTE: Surface water may need to be extensively treated before drinking (but groundwater does not always imply drinking water)
Statistics on groundwater use in Canada
26% of Canadians rely of groundwater for crop, livestock and domestic use
2/3 of users in rural areas
• Many areas of the Atlantic Provinces are heavily
dependent on groundwater
—• 100% in Prince Edward Island
—• 90% of Ontario farms
1/3 of users in small communities
• Many small communities in the Prairies use groundwater wells for municipal supply (rain can be scarce in some areas)
Zones of subsurface water
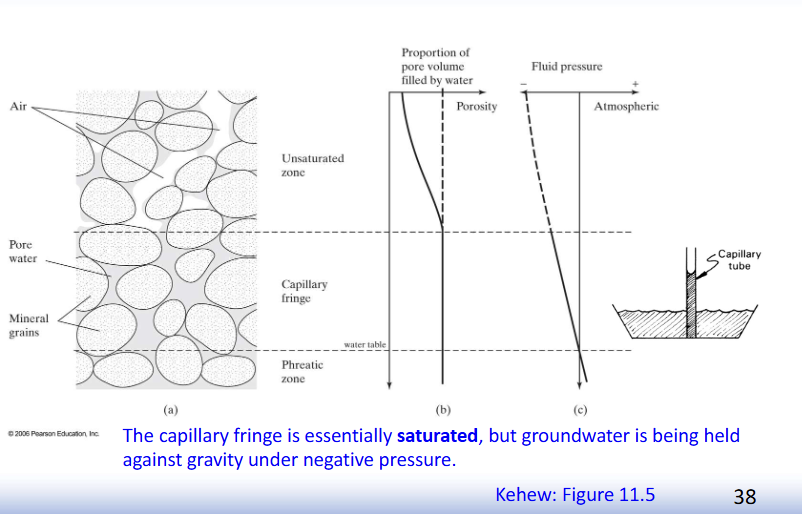
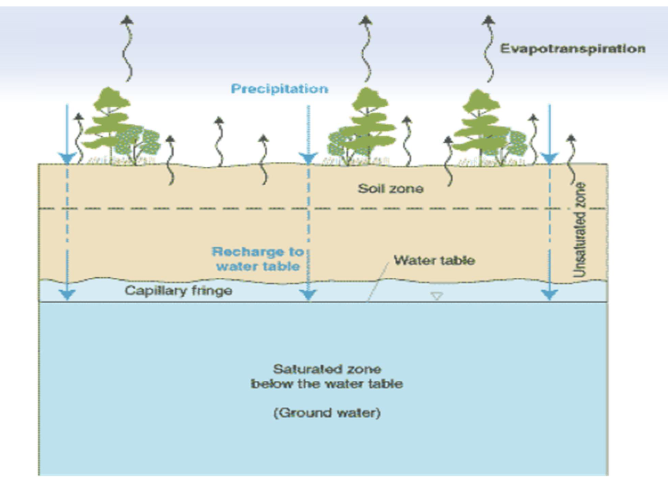
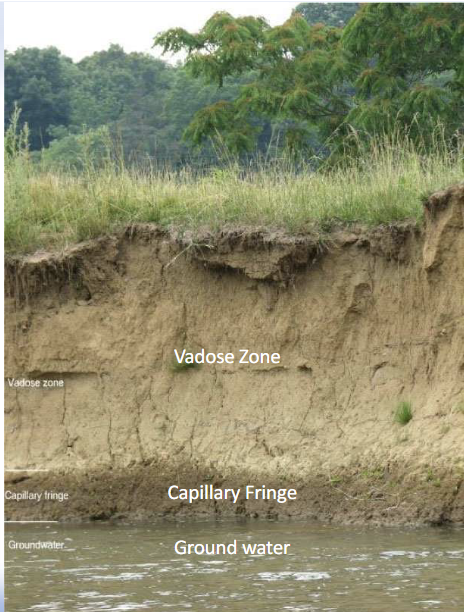
Unsaturated zone: near-surface zone of soil moisture, voids contain air and water. Also called the vadose zone.
• Capillary fringe: zone where groundwater is held by surface tension between grains (as in in tiny conduits)
• fluid pressure is less than atmospheric
• Extending upward from the water table
----Boundary where P = Atmospheric pressure = water table---
• Saturated zone: zone where all the open spaces in rock
(pores, fractures) are completely filled with water
Zones of subsurface water; Capillary action or Capillarity
Zone of aeration, capillary fringe, zone of saturation
The capillary fringe is essentially saturated, but groundwater is being held against gravity under negative pressure.
Capillary Action or (Capillarity)
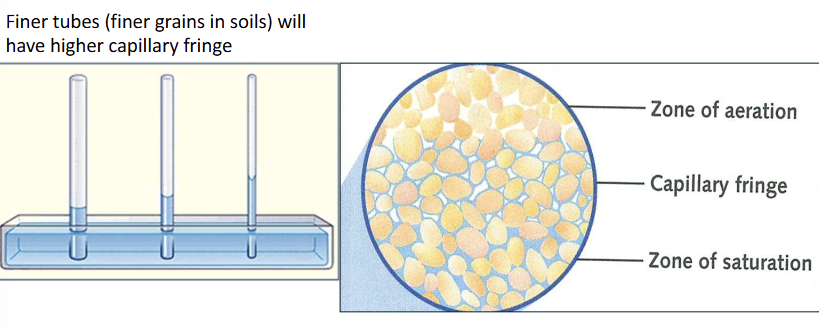
Capillary Action or (Capillarity):
The process by which water is drawn upwards into pore spaces.
The capillary fringe is essentially saturated, but groundwater is being held against gravity under negative pressure.
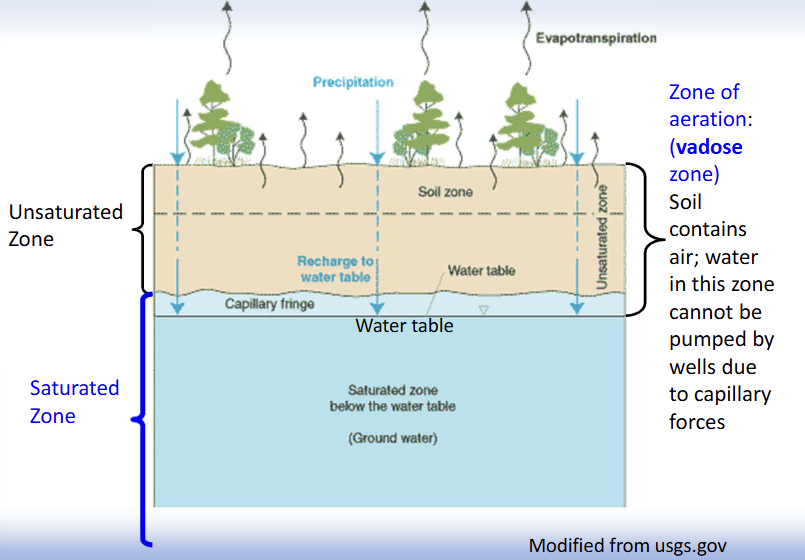
Zones of subsurface water: unsaturated zone, zone of aeration, saturated zone
Zone of aeration (vadose zone)
Zone of aeration: (vadose zone)
Soil contains air; water in this zone cannot be pumped by wells due to capillary forces
Percolate
Rain water that is not held as soil moisture percolates down to form the saturated zone
Groundwater
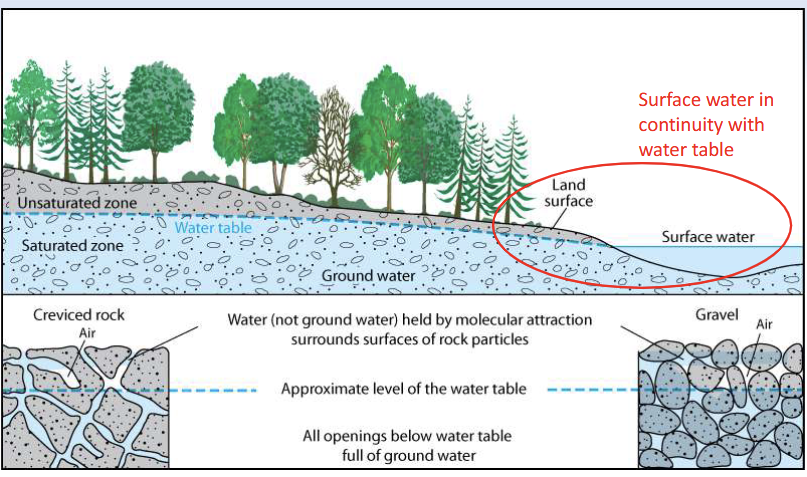
Groundwater: water filling the open spaces in soils or rocks in the saturated zone
Water table
Water table: upper limit of the saturated zone; the surface where the water pressure head is equal to the atmospheric pressure (where gauge pressure = 0).
Wetland
Wetland: area where the water table is at the surface
Recharge and discharge
Water flows from areas where water table topography is highest (recharge areas) to topography where water head is lowest (discharge areas)
Variations of the water table depth
Variations of the water table depth
• Shape often follows the surface topography
• There could be seasonal and annual depth variations
Schematic diagram from land surface through vadose zone, capillary fringe and into unconfined aquifer
Surface water is in continuity with water table
Shore of a river
Base flow
Groundwater serves as an equalizer of stream flow
Much of the water in a stream is often not direct runoff of rain and snow melt, but comes from groundwater discharge (base flow)
• Example: 65% of Lake Ontario comes from base flow
Groundwater acts as “storage” to sustain streams when rain is not falling
Springs
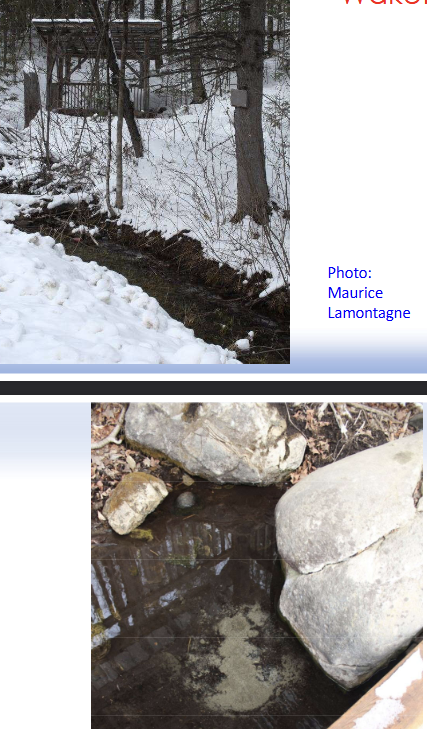
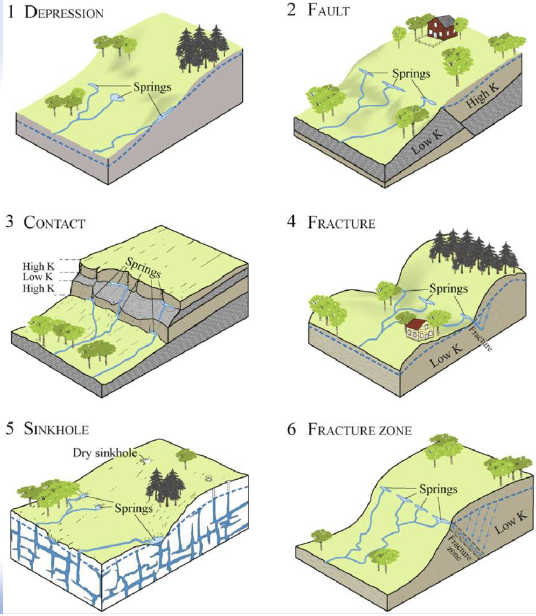
Spring: localized discharge point occurring where the water table intersects the Earth’s surface
Springs: Types of streams
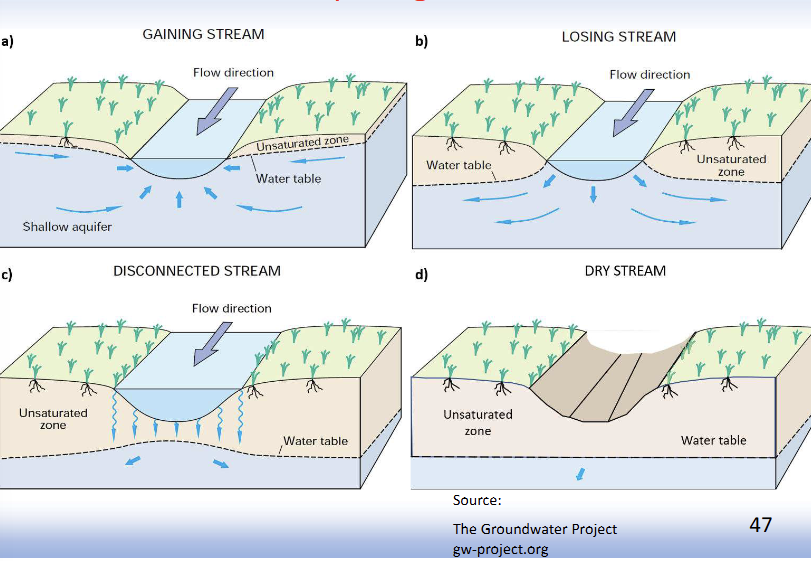
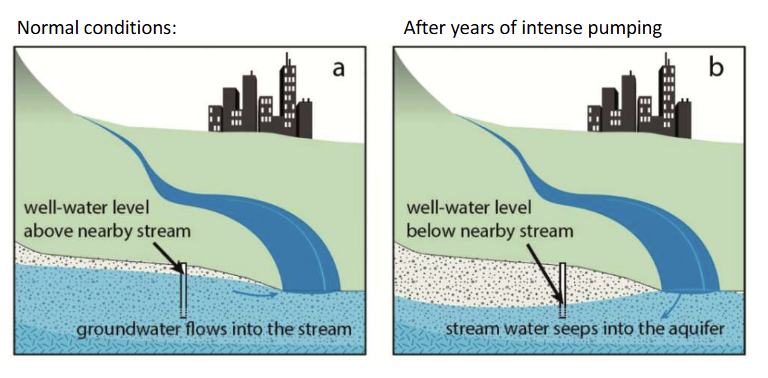
Losing stream
Losing stream: water table can be lower than rivers in Western US due to intense pumping (ie the inverse of natural situation)
Spring near Wakefield, QC
Hydraulic conductivity
K: Hydraulic conductivity
High K: Permeable
Low K: Impermeable
Karstic environments
“A karst environment is a landscape formed by the dissolution of soluble bedrock—primarily limestone, dolomite, or gypsum—characterized by sinkholes, caves, sinking streams, and springs. These terrains feature complex underground drainage systems rather than surface streams and are highly susceptible to contamination due to rapid water flow through fissures.”
Darcy’s Law: general info
Henri Darcy: 19th century French engineer
• Founder of modern groundwater
• Experiments of water flow through column of sand
Established volumetric flow rate of water through saturated sand is proportional to the energy gradient
• Loss of energy per unit length of flow path
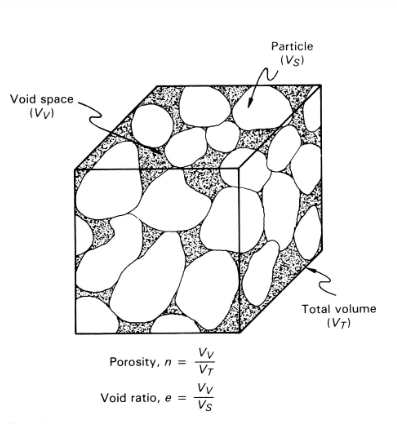
Void Space
Void Space
Two quantitative measures of the relative amount of void space in a material
• Porosity
• Void ratio
Both difficult to estimate in practice
Darcy’s Law Diagram
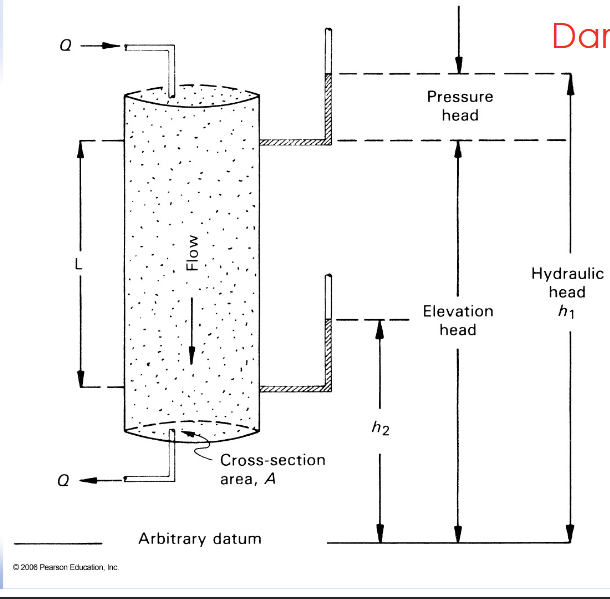
Darcy’s Law: actual law
Darcy’s Law: equation describing flow through a porous medium
v = Q / A
v : flow velocity [m/s]
Q : volumetric flow rate [m3/s]
A : cross-sectional area of flow tube [m2]
Hydraulic head
In relation to Darcy’s Law
Hydraulic head h [m]: level to which water rises above a datum
Hydraulic gradient
Hydraulic gradient i [ ]: difference in hydraulic head between two points separated by a distance L [m]
i = (h2 – h1) / L
Measures in the ability to transmit fluids
One qualitative and two quantitative measures of the ability of a material to transmit fluids
Qualitative:
• Permeability
Quantitative:
• Intrinsic permeability
• Hydraulic conductivity
Permeability
Permeability: general qualitative term describing the ability of a material to let fluids flow through it.
(a measure of how easily a fluid can travel through soil or bedrock.)
Permeability is a composite property of:
• Material properties: size, shape, and interconnectivity of the voids
• Fluid properties: temperature, density, viscosity
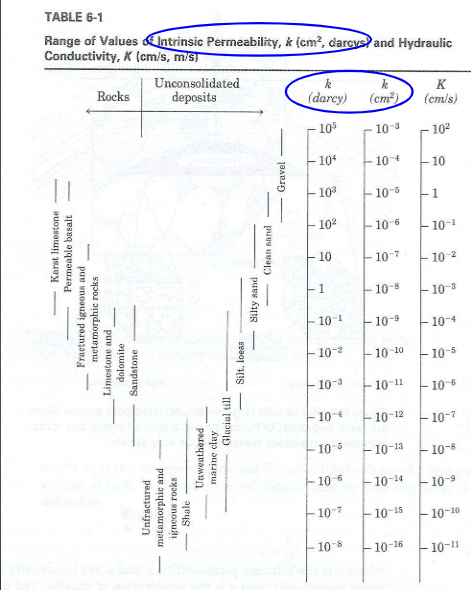
Intrinsic Permeability
Intrinsic permeability k [m^2]: portion of “permeability" which is representative of the properties of the material alone
Intrinsic permeability is a function of the characteristics of the voids through which the fluid moves
• Interconnectivity of voids
• Size, shape and packing of grains
• Cementation
• Fracturing
Hydraulic conductivity
Hydraulic conductivity K [m/s]: composite property that describes the ease with which a fluid (usually water) can move through pore spaces or fractures.
K = k ρ g / μ
k : intrinsic permeability [m^2]
ρ : density of water [kg/m^3]
g : acceleration due to gravity [m/s^2]
μ : viscosity of water [Ns/m^2]
Important property in hydrogeology
What do high and low hydraulic conductivity values mean?
High values indicate permeable material through which water can pass easily;
Low values indicate that the material is less permeable.
• Because density and viscosity of water does not vary much, K reflects mostly the intrinsic permeability of the reservoir
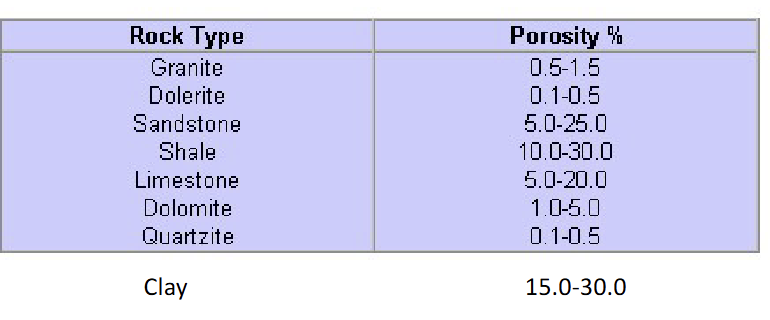
Porosity vs Permeabbility
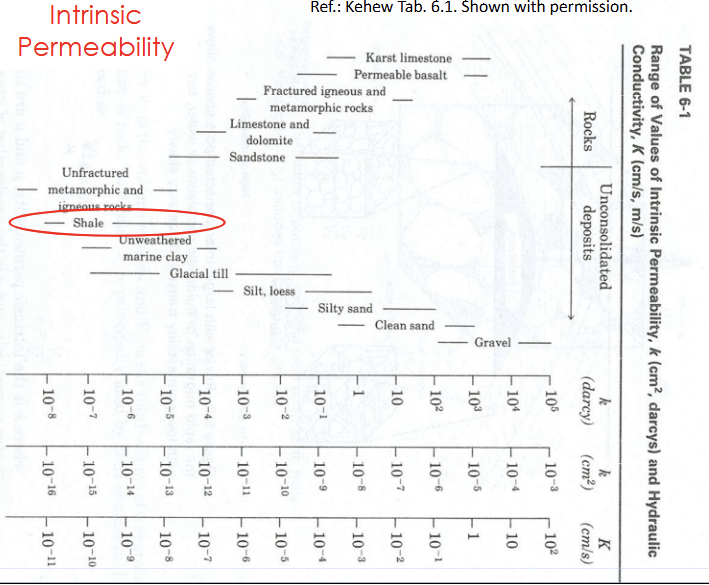
A porous rock is not necessarily permeable
– Example: shale and clay: very porous, but almost impermeable
Scale of intrinsic permeability
Notice log scale
Intrinsic permeability of shale compared to others on graph
Darcy’s Law: Expanded equation
v = Q / A = - K (h2 - h1) / L
Negative sign indicates a loss of energy along flow path due to:
• Friction between water and rock/soil
• Friction between water molecules
v : flow velocity [m/s]
Q : volumetric flow rate [m3/s]
A : cross-sectional area of flow tube [m2 ]
K : Hydraulic conductivity [m/s]
Darcy’s Law: in practice
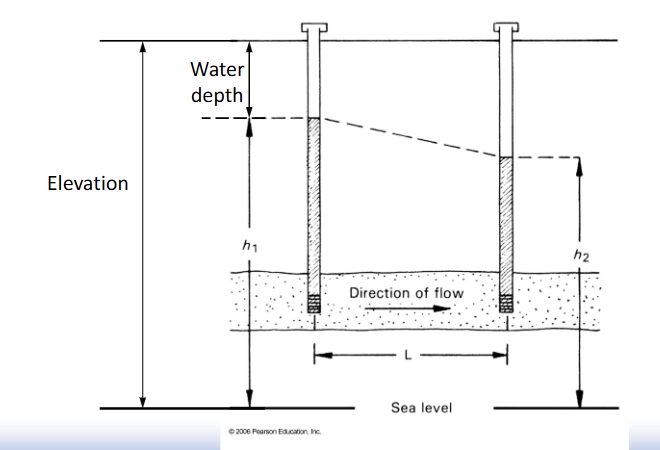
Darcy’s Law: Application
Datum for measuring hydraulic head is sea level
• Difference between elevation and depth to water in well
Direction of ground-water flow is from high to low hydraulic head
Flow velocity (v)
• Typically ≈ cm/day... i.e. generally very slow
Aquifer
Aquifer: saturated body of rock or soil that transmits significant quantities of groundwater
Aquitard
Aquitard: body of rock or soil that does not transmit significant quantities of groundwater
Geological materials that form good aquifers
Sand and gravel
• Moraine, alluvial fans, etc.
Fractured rocks
• Jointed rock masses, fault zones, deeply weathered zones, etc.
Soluble rocks
• Caves and channels in karst geology
Reef carbonates
Types of aquifers
Two types of aquifers depending on the presence or not of an overlying aquitard
Unconfined aquifer:
• Aquifer that lacks an overlying aquitard
—• The water table is the upper boundary
• Hydraulic head ≈ elevation of the water table
—• Contour lines of the well water levels drawn on a map indicate the direction of flow
Confined aquifer (syn. artesian aquifer):
• Aquifer bounded between overlying and underlying
aquitards
• No relation between the hydraulic head and the
water table
—• In some cases, the fluid pressure in the aquifer is so high that the head is above the land surface
——• Flowing artesian well: well flowing without a pump
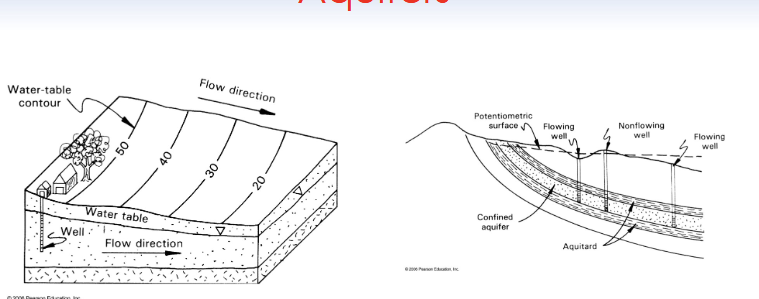
Diagram of the two types of aquifers
make sure to look at
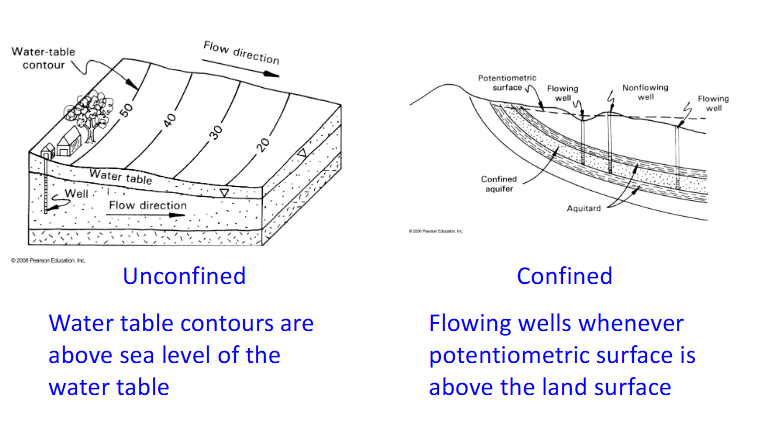
Water wells
• A typical water well drilled in the Ottawa area
• To ensure a continuous supply of water, well must penetrate into aquifer which is the bedrock
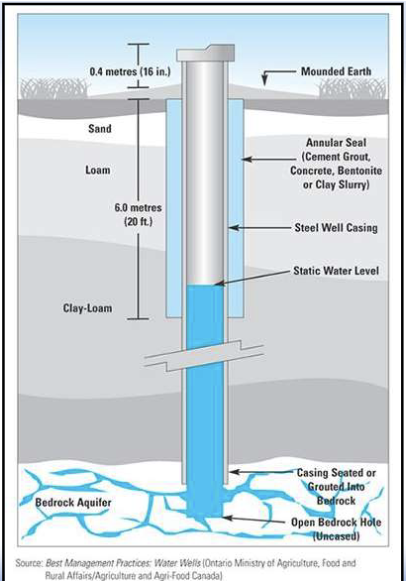
Ontario government regulations for water wells
Each new well:
• Is tagged with an identification number
• Its GPS location is entered in a provincial database
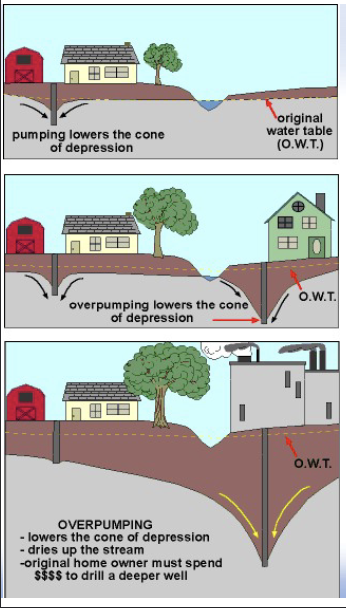
Production of water; CONE OF DEPRESSION in UNCONFINED aquifers
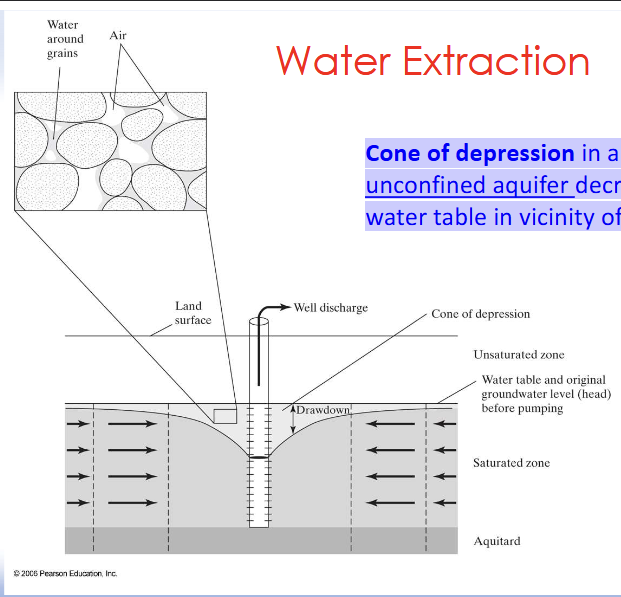
Cone of depression in unconfined aquifers
• Decline in water table in vicinity of well
• Cone-shaped area extending radially from the well
• Material within the cone changes from saturated to unsaturated state
• Reaches a state of equilibrium
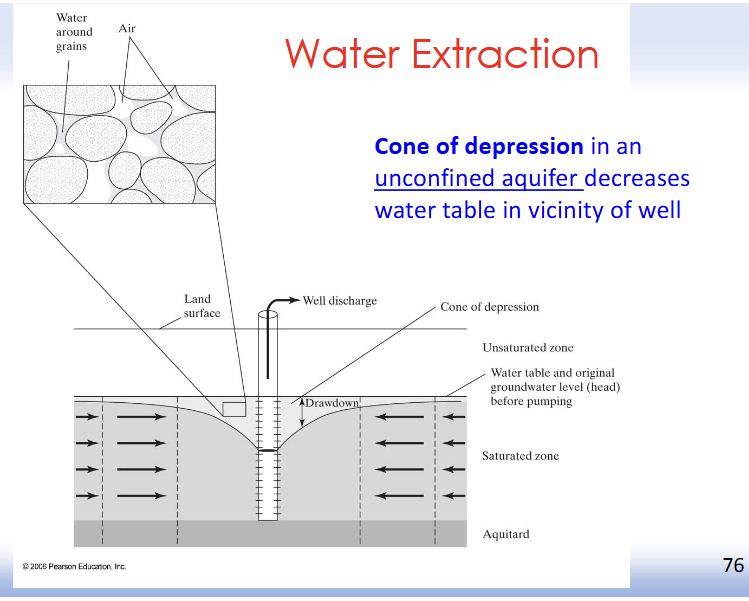
Water extraction in unconfined aquifer
Cone of depression in an unconfined aquifer decreases water table in vicinity of well
Production of water; CONE OF DEPRESSION in CONFINED aquifers
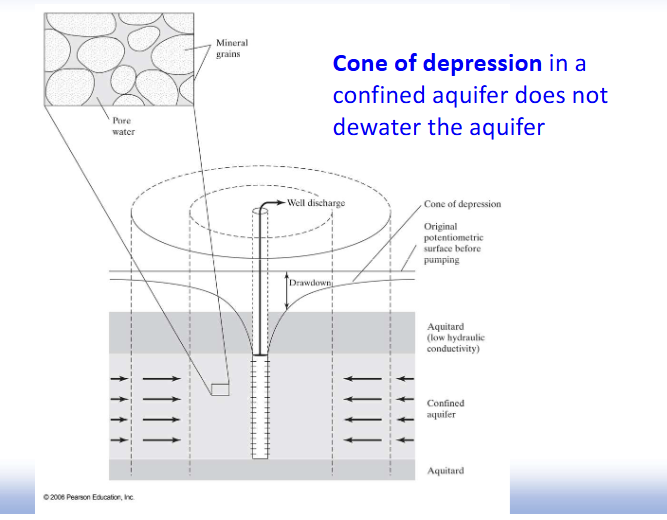
Cone of depression in confined aquifers
• Cone of depression develops in the potentiometric surface without dewatering of aquifer
• Decrease in fluid pressure / pressure head
• Reduction in ability to expels water
• Remains saturated
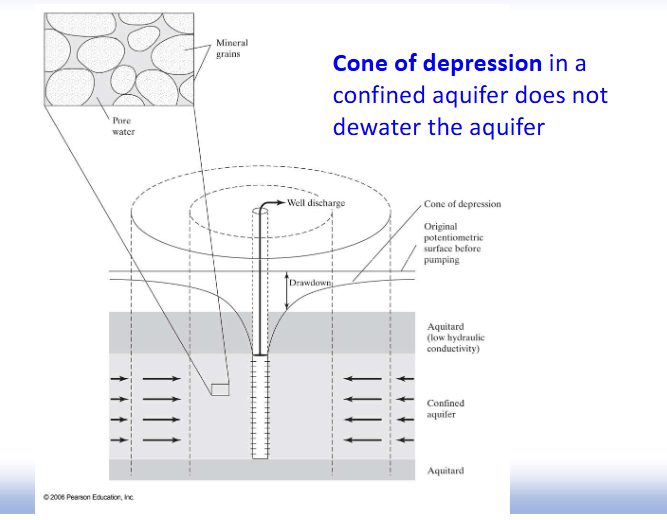
Water extraction in confined aquifer
Cone of depression in a confined aquifer does not dewater the aquifer
Overpumping in relation to the production of water
In this example, overpumping by industry lowers the water table, making it necessary for farmers to drill a deeper well
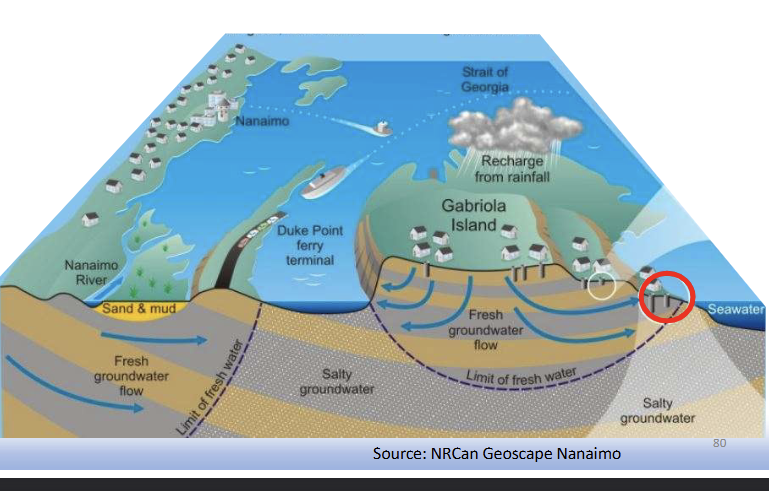
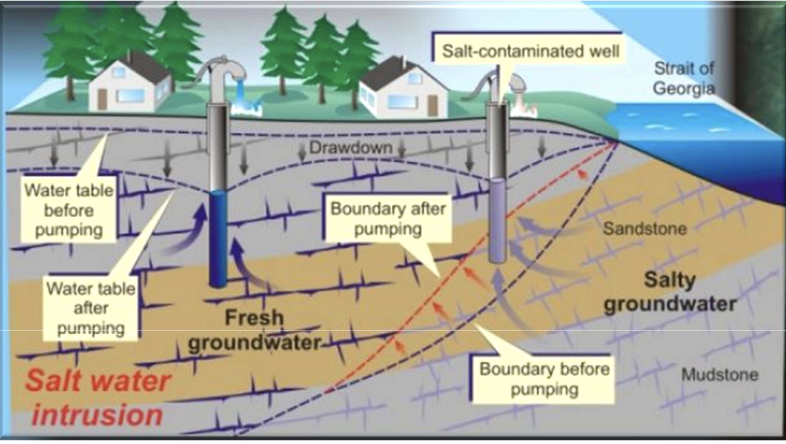
Contamination by saltwater near salt water bodies
Nanaimo, BC
Issues near Salt water Bodies
Statistics on water as a precious resources
City of Ottawa draws about 340 million litres of water daily at the Britannia and Lemieux Purification Plants.
Numerous other communities and individual homes also rely on the river as their water source.
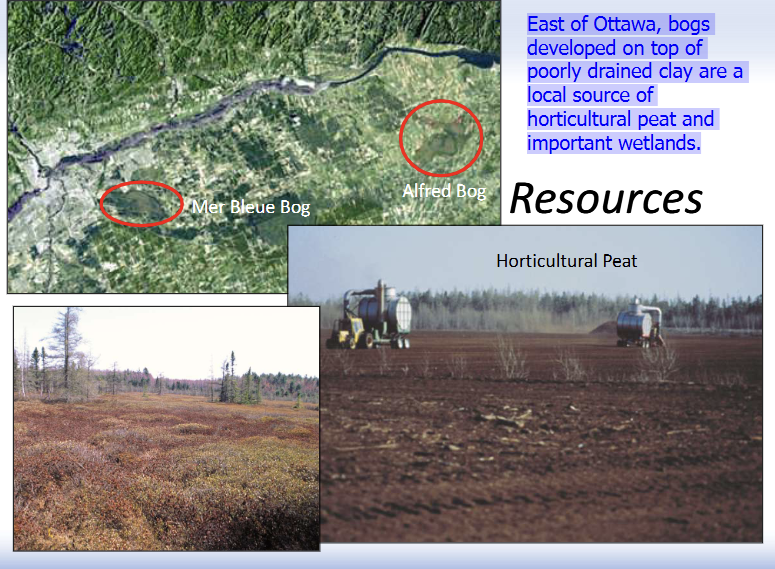
Bogs developed on top of poorly drained in the East of Ottawa
East of Ottawa, bogs developed on top of poorly drained clay are a local source of horticultural peat and important wetlands.
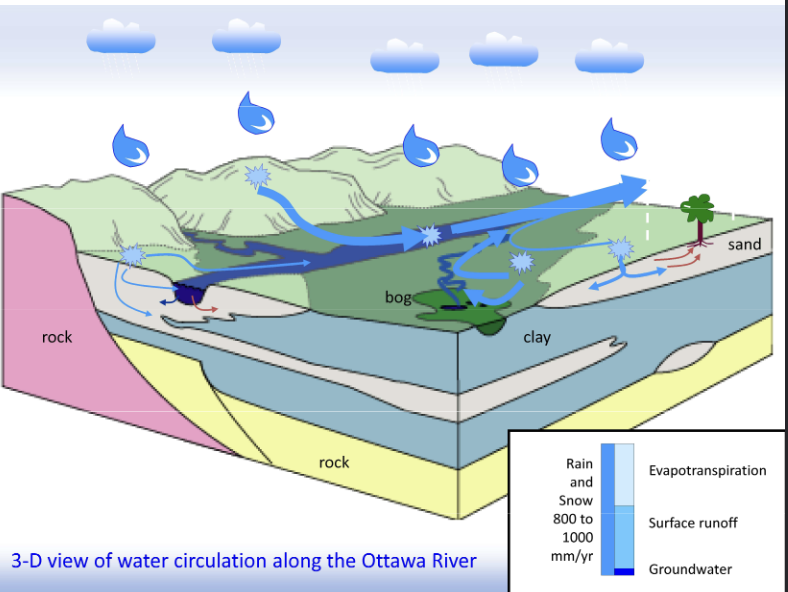
3D Diagram of water circulation along the Ottawa River
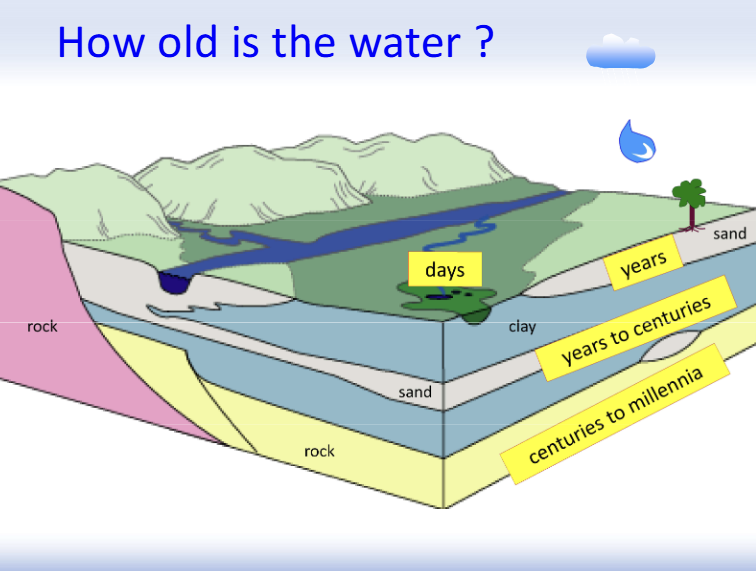
How old the water is depending on where it is in the water circulation
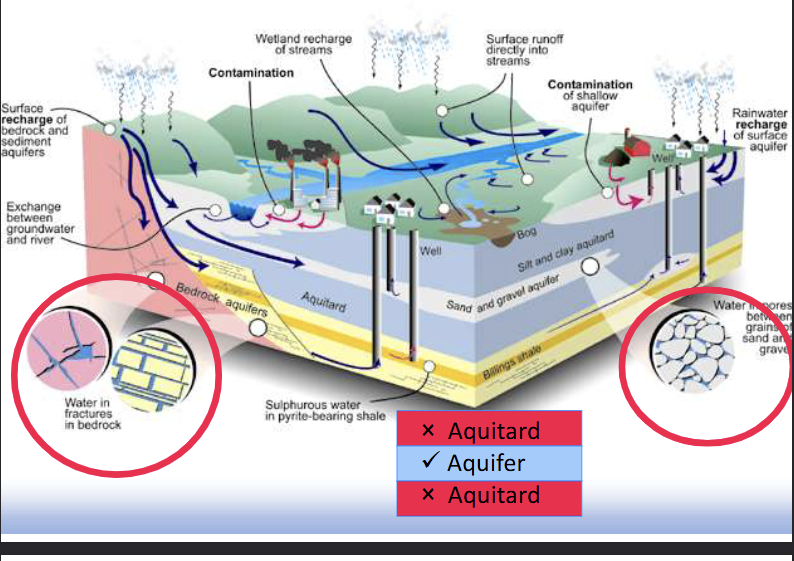
How does water get into the ground?
****
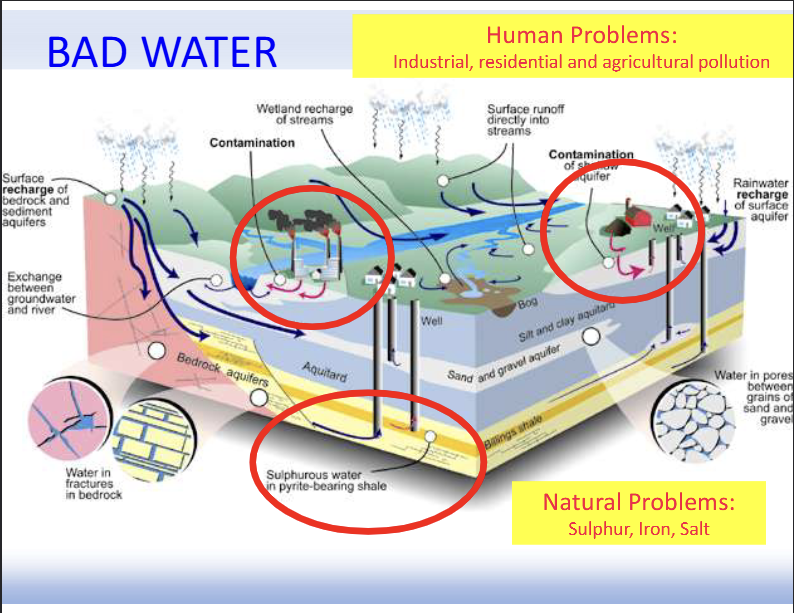
Bad water sources
Human problems: Industrial, residential and agricultural pollution
Natural problems: Sulphur, iron and salt
EARTH RESOURCES
General categories of Earth resources
Non-metallic
Metallic
Energy resources (Fossil Fuels+ uranium)
Mineral Resource Use
USA 2014:
~3400 L consumption of refined petroleum products per capita:
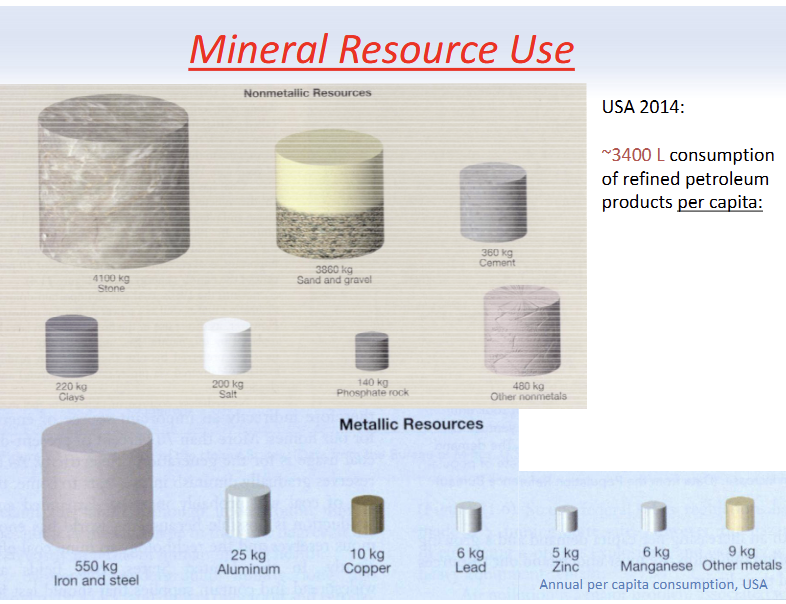
Non-metallic resources
Rock quarries: building stone
Limestone, crushed rock aggregate: cement
Sand and gravel: road materials, concrete
Gypsum: plaster and wallboard
Clay minerals (kaolinite, montmorillonite): medicine, paint, glassy paper, ceramics, tennis shoes, chocolate!
Potash – fertilizers
Salt (halite): Winter road maintenance
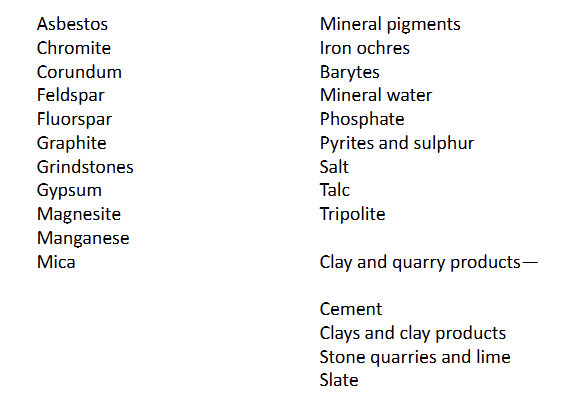
Non-metallic minerals mined in Canada
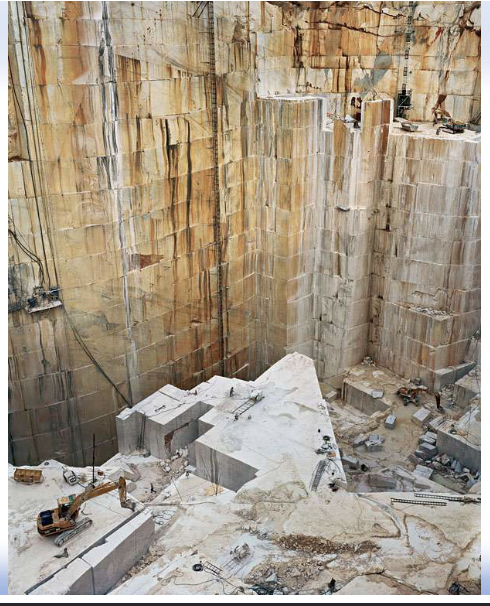
Marble Quarry, PortugalL
Active and inactive quarries in the Ottawa-Gatineau region
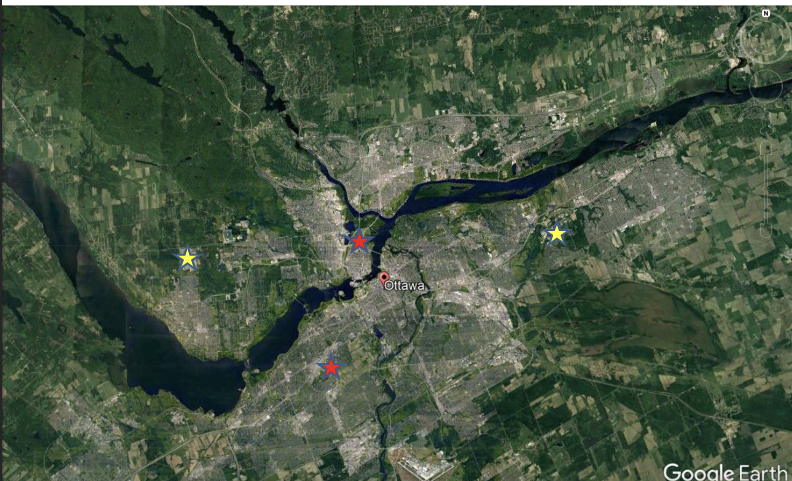
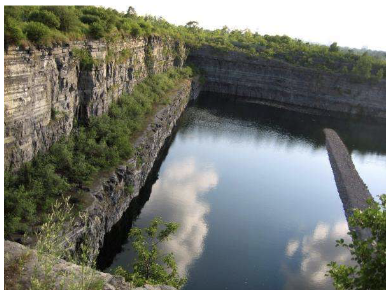
Carlington Quarry (Ottawa West)
• Former quarry with stones used to build the Parliament and other Ottawa buildings.
• It can be a challenge to rehabilitate inactive quarries within cities
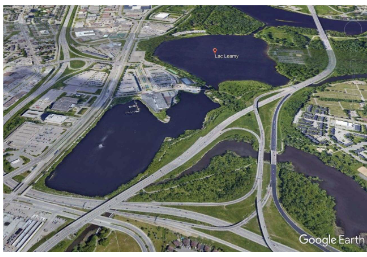
Casino Lac Leamy (Hull)
• Former quarry
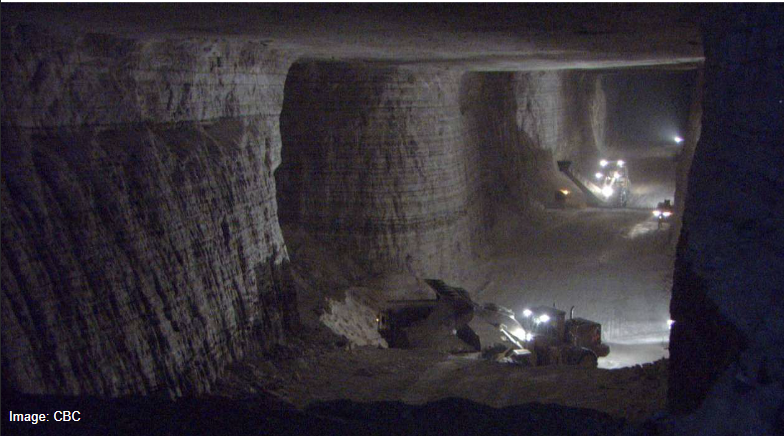
Goderich Salt Mine, Goderich, ON
• World’s largest underground salt mine
• 7 km2, extending under Lake Huron
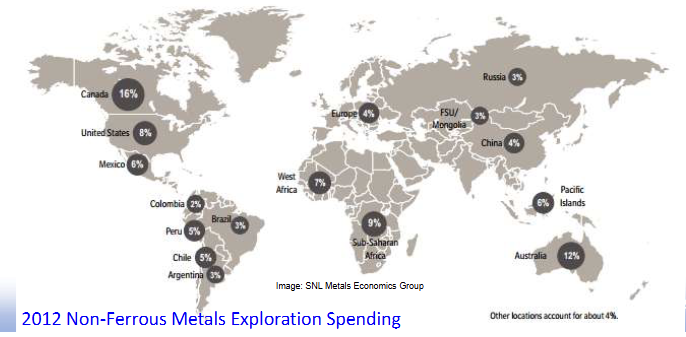
Canada’s mineral and metals; statistics on Canada’s rankings among the top 5 producers of 14 mineral commodities and how mineral exploration undertaken across the world is from Canadian companies
• Canada ranks among the world’s top five producers of 14 mineral commodities
– World's leader in production of Potash and third in Uranium
• Canadian-based companies conduct about 40% of all mineral exploration undertaken in the world
Resources versus. Reserves
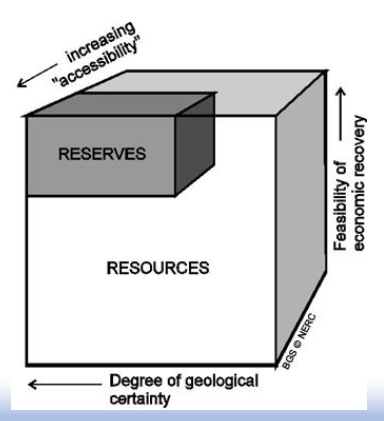
In short – mineral reserves are the portion of mineral resources that are economically feasible to produce and sell.