ECO7: Market Power
1/9
There's no tags or description
Looks like no tags are added yet.
Name | Mastery | Learn | Test | Matching | Spaced |
|---|
No study sessions yet.
10 Terms
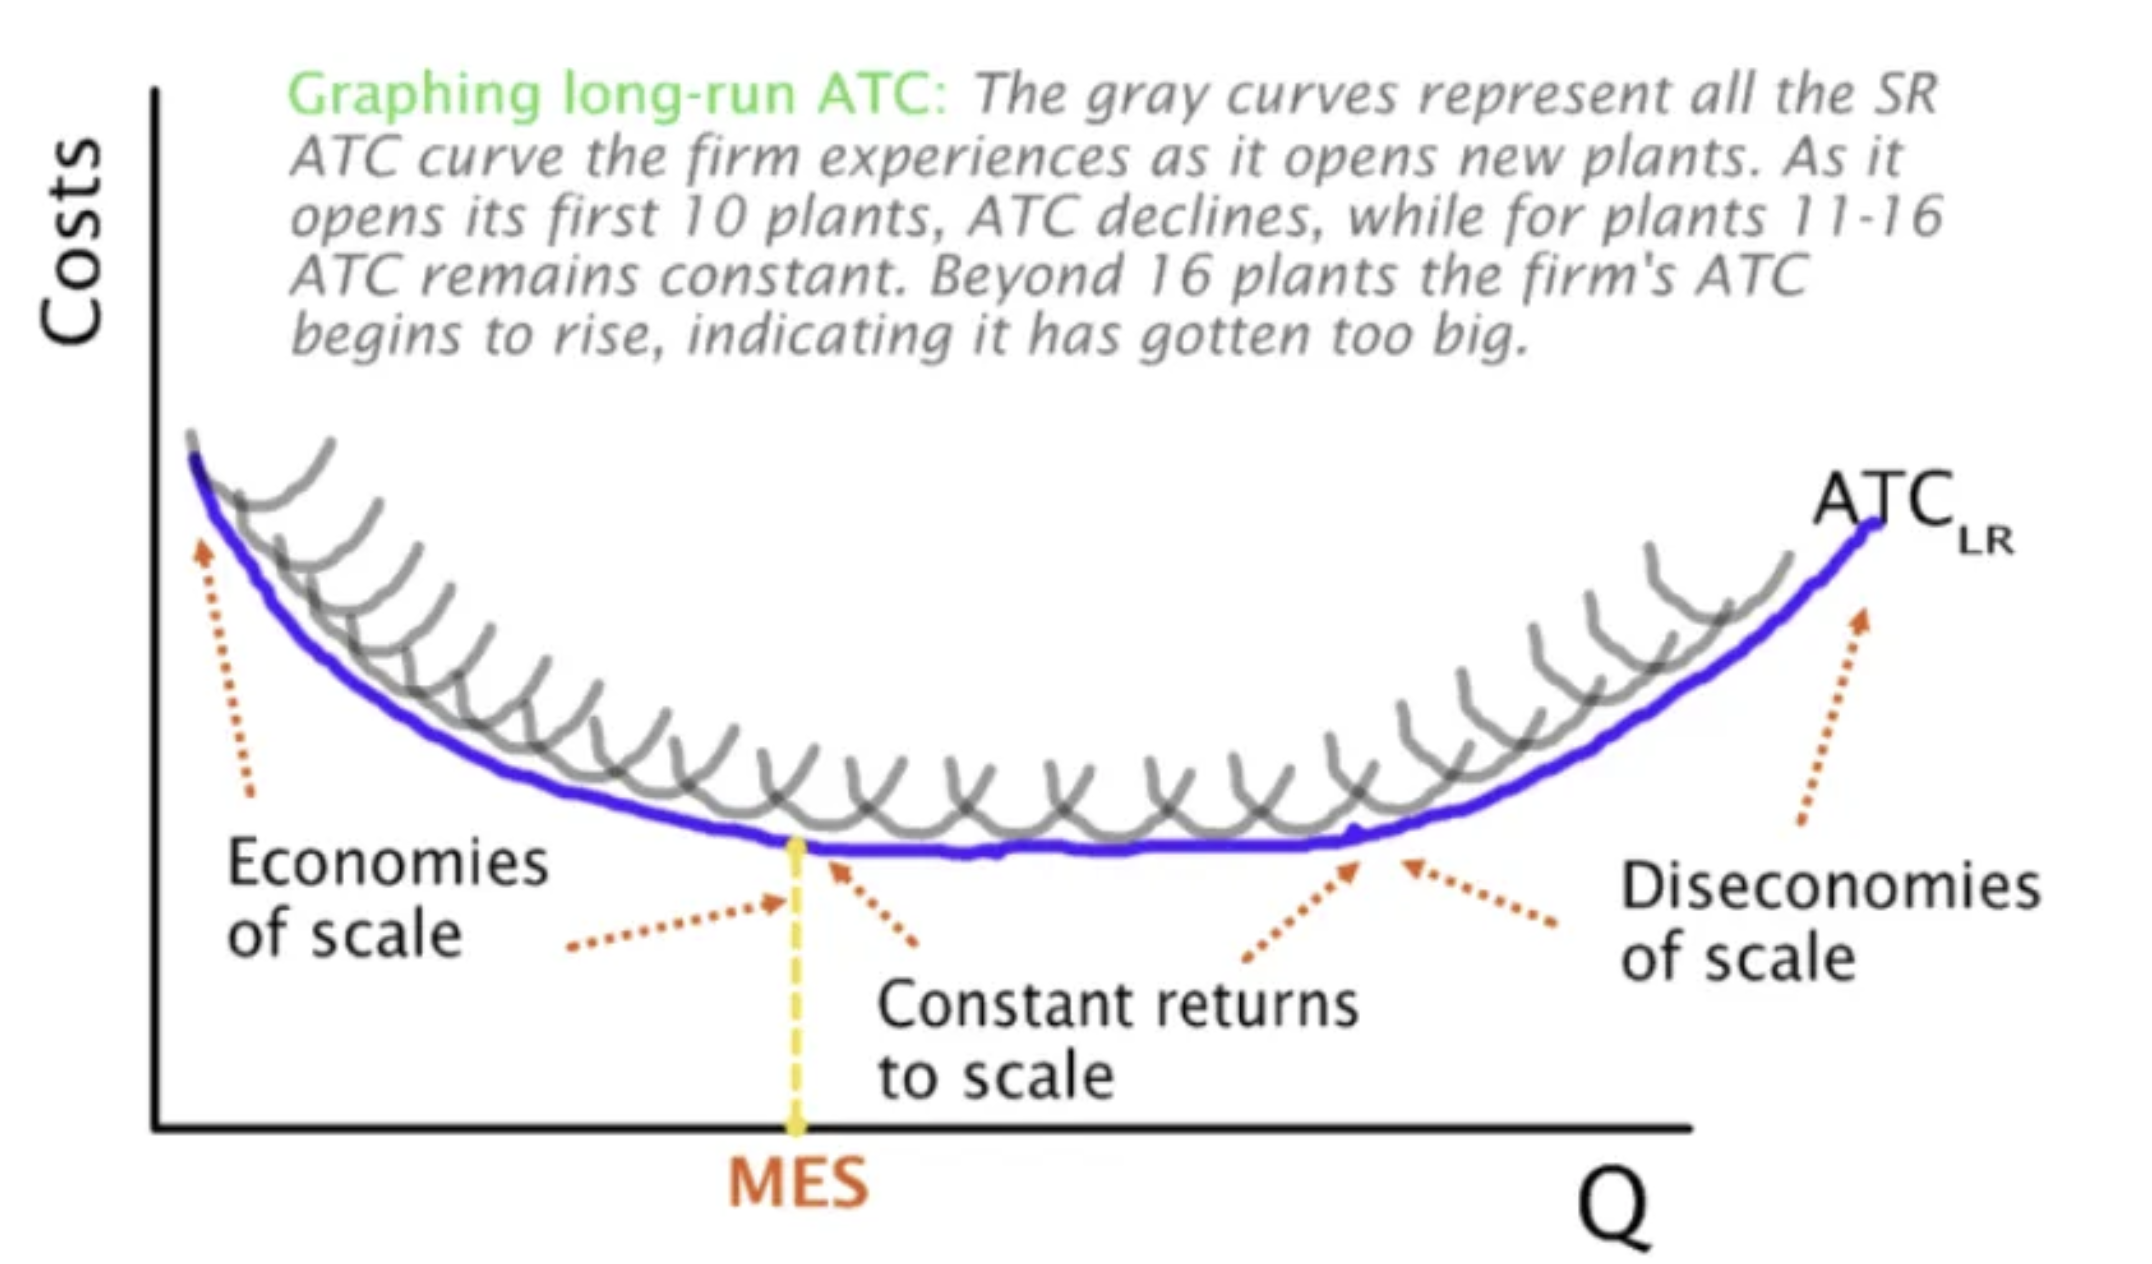
Name and Explain the three parts of the LRAC curve, and what causes each point.
Part 1: Economies of Scale: Decreasing Short Run Average Cost Curves.
As the firm increases its quantity from zero to the Minimum Efficient Scale (MES)
It takes advantage of Economies of Scale and experiences DECREASING AVERAGE TOTAL COSTS, as they streamline production, make more productive use of the capital/land/investment goods.
Types of Economies of Scale are explored later
Part 2: Constant Returns to Scale
Where a rise in the variable input (the resources the business channels into itself to make money) leads to a DIRECTLY PROPORTIONAL increase in output, thus ATC has no change.
Part 3: Diseconomies of Scale or Decreasing Returns to Scale
Increase in the Long Run Average Costs —> which imply an increasing short run ATC curve.
Caused by mismanagement or communication problems associated with large firms as well as principal agent problem, etc.
Explain why/how firms experience economies of scale. (5 types)
Technical IEOS
The cost savings a firm makes when it grows larger and makes use of large scale mechanical process and machinery.
Technical processing becoming more cost efficient
Purchasing IEOS
When larger firms buy in bulk and get bulk discounts. (somehow related to marketing according to Hong)
Managerial IEOS
When large firms spread their administrative and management costs across plants, dividing more labour.
Eg. an MNC can hire one body of accountants to account for ALL their plants globally.
Financial IEOS
Larger firms borrow money easier becuase of the presence of greater collaterals and lower risks.
The fact that a firm is big implies that they have good management of cashflow and have been around for a while.
Risk Bearing IEOS
Larger firms can afford to bear more risks, they can handle more “flops” or “Fails” becuase of their strong financial base.
Explain reasons for DISeconomies of scale. (3)
IDEOS refers to a rise in the long run average costs as firm get too big and hard to manage.
Poor Communication: exactly what it sounds like
Poor Coordination: exactly what it sounds like
Poor Worker Motivation: exactly what is sounds like. textobook didnt really elab too much on this.
Name and explain the four types of market structures in terms of its characteristics, Advantages, and Disadvantages.
Perfect Comp (the only perfect ones)
Number of Firms: Infintetly many small firms
Market Power: no market power (price taker)
Products: Homogenous
Allocative Efficiency: Yes, P = MC
Long Run Profits: Normal (Price taker)
Information Level: Perfect info
Barriers to Entry: Very Low
Advantages
Allocative efficiency: Price equals marginal cost (P = MC), so resources flow to their most valued uses and consumer surplus is maximized.
Productive efficiency: Firms produce at the lowest point of average cost (AC min), minimizing waste.
Zero long‑run DWL: No output distortion ⇒ no dead‑weight loss.
Consumer sovereignty: Homogeneous products and many sellers mean consumers pay the lowest sustainable price.
Ease of entry/exit: Free entry erodes supernormal profits but encourages new firms when profitable.
Disadvantages
No dynamic efficiency: Normal profits in the long run limit funding for R&D and innovation.
Limited economies of scale: Firms remain small—can’t exploit lower per‑unit costs from large‑scale production.
Lack of product variety: Homogeneous goods reduce consumer choice.
Over‑emphasis on short‑run cost minimization: May lead to underinvestment in quality, branding, or sustainability.Diagram:
2. MPC
Number of Firms: Many small firms
Market Power: very low market power (price taker)
Products: Firms sell differentiated products and have a relatively elastic demand.
Allocative Efficiency: No
Long Run Profits: Normal
Information Level: IMperfect info
Barriers to Entry: Very Low
Advantages (know can already)
Product differentiation: Variety of close substitutes gives consumers more choices in taste, quality, and branding.
Some dynamic efficiency: Short‑run supernormal profits can finance innovation in design, marketing, or niche R&D.
Ease of entry/exit: Low barriers allow new entrants to serve niche markets.
Closer price‑cost relationship: Price still constrained by competitive pressures, so mark‑ups are limited.
Disadvantages (Know can already)
Allocative inefficiency: P > MC ⇒ welfare loss on each unit not produced at the allocative optimum.
Excess capacity: Firms operate with AC above its minimum (under‑utilized capacity) in the long run.
Non‑price competition costs: High spending on advertising and branding raises industry costs without improving productive efficiency.
Short‑lived supernormals: Easy entry erodes profits, discouraging large‑scale investment.
Diagram:
3. Oligopolies
Number of Firms: Few large firms, high market share.
Market Power: high market power.
Products: Firms sell differentiated products and have a relatively elastic demand.
Allocative Efficiency: No
Long Run Profits: Supernormal
Information Level: IMperfect info
Barriers to Entry: Very High
Advantages
Economies of scale: Large firms can lower average costs through bulk production, benefiting consumers if cost savings are passed on.
Potential for innovation: Supernormal profits can fund significant R&D (e.g., technology, pharmaceuticals).
Price stability: Mutual interdependence often leads to stable prices and reduced uncertainty.
Strategic behaviour: Product and service improvements (quality, features) emerge from competitive rivalry.
Disadvantages
Collusion risk: Tacit or explicit collusion can sustain high prices and restrict output, harming consumers.
X‑inefficiency: With limited competitive pressure, firms may operate above minimum cost, reducing productive efficiency.
Barriers to entry: High setup costs, brand loyalty, or network effects protect incumbents and limit competition.
Price wars: Fierce rivalry can lead to destructive price‑cutting, eroding profits and possibly stability.
Collusion/Price Competition
Diagram: FYI ONLY: KINKED DEMAND CURVE
4. Monopoly
Number of Firms: 1-2 Very large firms, almost absolute market share.
Market Power: high/absolute market power.
Products: The firm sells a unique and differentiated product that others firms are not capable of selling.
Allocative Efficiency: No
Long Run Profits: Supernormal
Information Level: IMperfect info
Barriers to Entry: Very High, Natural (high overhead costs), and Artificial (policies, patents)
Advantages
Strong dynamic efficiency: Persistent supernormal profits can finance large‑scale R&D and innovation (e.g., utilities, pharmaceuticals).
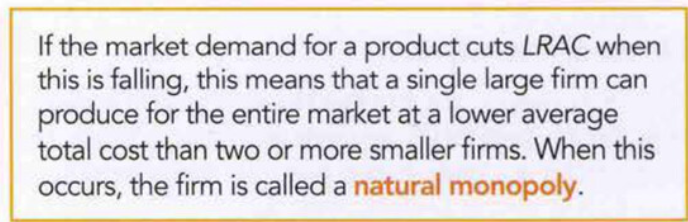
Economies of scale: “Natural monopolies” (high fixed costs) can supply at lower average cost than multiple firms.
Stable output and investment: Long‑term planning is possible without threat of entry.
Uniform standards: Single provider can ensure network compatibility (e.g., railways, sewage systems).
Disadvantages
Allocative inefficiency: P > MC ⇒ restricted output, consumer surplus reduced, and dead‑weight loss occurs.
Productive inefficiency: No pressure to minimize costs—AC may lie above its minimum (X‑inefficiency).
Lack of consumer choice: One product ⇒ no alternatives on price, quality, or features.
Rent‑seeking and regulation costs: Monopolists may lobby for entry barriers, generating social waste.
Equity concerns: Higher prices transfer surplus from consumers to the monopolist.
Lack of competition: Leading to slow progress and innovation.
Diagram: Steep Demand Curve
Name and explain the policies to limit market power. 7
1. Competition (Antitrust) Legislation
Most countries enact a body of competition—or “antitrust”—laws that prohibit firms from abusing market power. Under these rules it is illegal for dominant firms to collude on prices, divide markets or impose exclusivity arrangements on suppliers or retailers. Enforcement authorities may investigate firms suspected of anti‑competitive conduct, issue cease‑and‑desist orders and require behavioural remedies (e.g. forcing firms to offer non‑discriminatory terms) in order to restore competitive pressures.
2. Merger Control
To prevent excessive concentration, governments often require large mergers to undergo pre‑approval by a competition authority. If a proposed merger would give the combined firm an outsized market share or foreclose rivals, regulators can block the deal outright or approve it subject to divestitures—forcing the newly formed firm to sell off certain assets or business units so that no single firm wields undue market power.
3. Fines and Financial Penalties
When firms are found guilty of anti‑competitive behaviour—whether price‑fixing in an oligopoly or abusing monopoly power—competition authorities can impose substantial fines. These are typically calibrated to the offending firm’s turnover so as to deter repeat violations. In practice, however, firms sometimes treat fines as a cost of doing business if the expected profit from anti‑competitive conduct outweighs the penalty.
4. Structural Remedies (Break‑Ups)
In the most extreme cases, regulators may order a dominant firm to divest part or all of its operations so that multiple, smaller firms compete in the same market. Breaking up a single large firm into separate entities restores competitive rivalry directly, though it is rarely used except where long‑term harm to consumers outweighs any short‑run disruption to the industry.
5. Nationalisation of Natural Monopolies
Where one firm exhibits a natural monopoly—owing to very high fixed costs and steadily declining average costs—governments may opt to bring the firm into public ownership (nationalisation). Under state control, output and pricing can be set with social welfare in mind rather than profit maximisation, thereby eliminating allocative inefficiency and welfare loss that unregulated private monopolies generate.
6. Marginal‑Cost Pricing Regulation
Even under private ownership, a regulated natural monopoly can be forced to price at marginal cost (P = MC). This achieves allocative efficiency—output is raised and price falls to the competitive level—but because P < AC the firm incurs losses. To keep it solvent, the government must provide subsidies or a government grant equal to the monopoly’s losses.
7. Average‑Cost Pricing Regulation
As an alternative, regulators can require the monopoly to set price equal to average cost (P = AC). This allows the firm to earn a normal profit and avoids the need for subsidies. Although output is lower and price higher than under marginal‑cost pricing (so true allocative efficiency is not fully restored), it still improves on the unregulated monopoly outcome—and preserves the firm’s incentive to control costs, since excess inefficiency would raise AC and thus the regulated price.
Define Natural Monopoly.
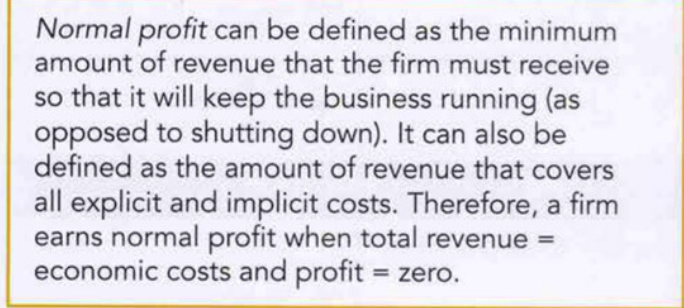
Define Normal Profits.
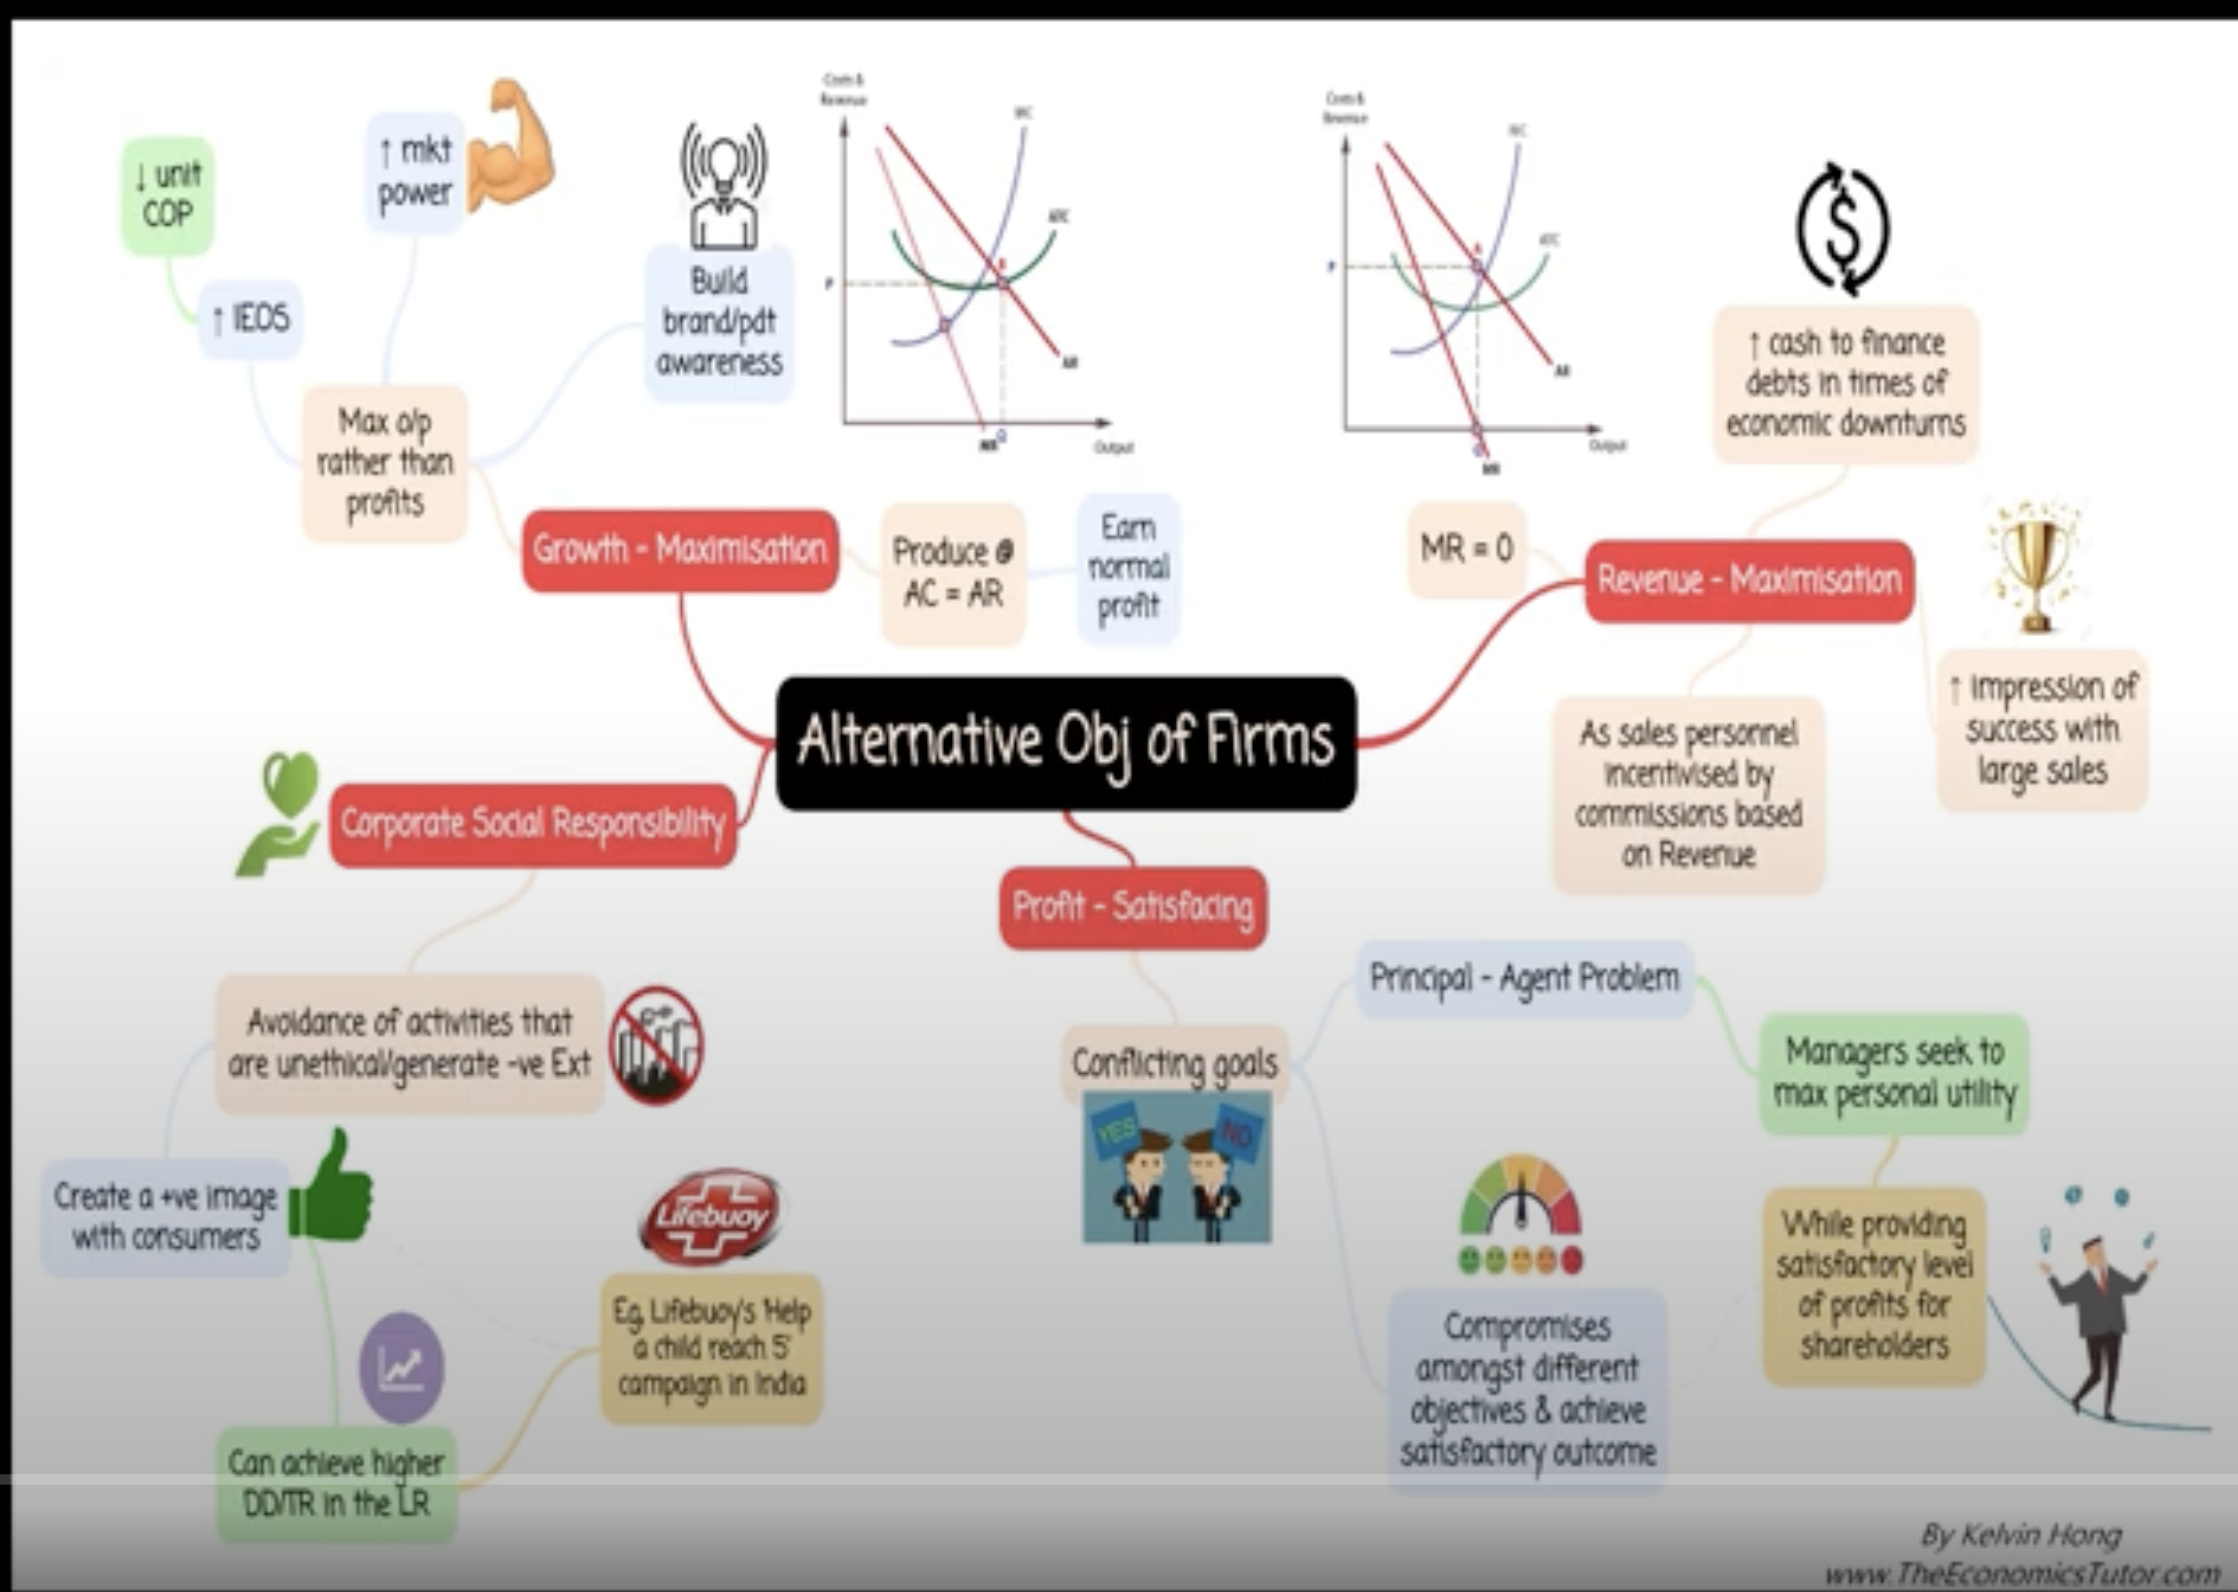
Name and explain the various objectives of firms
Name and explain a few non-price competition tactics.
Marketing
Product differentiation
Customisation
Loyalty programs
Distribution programs
Customer service/after-sales support.
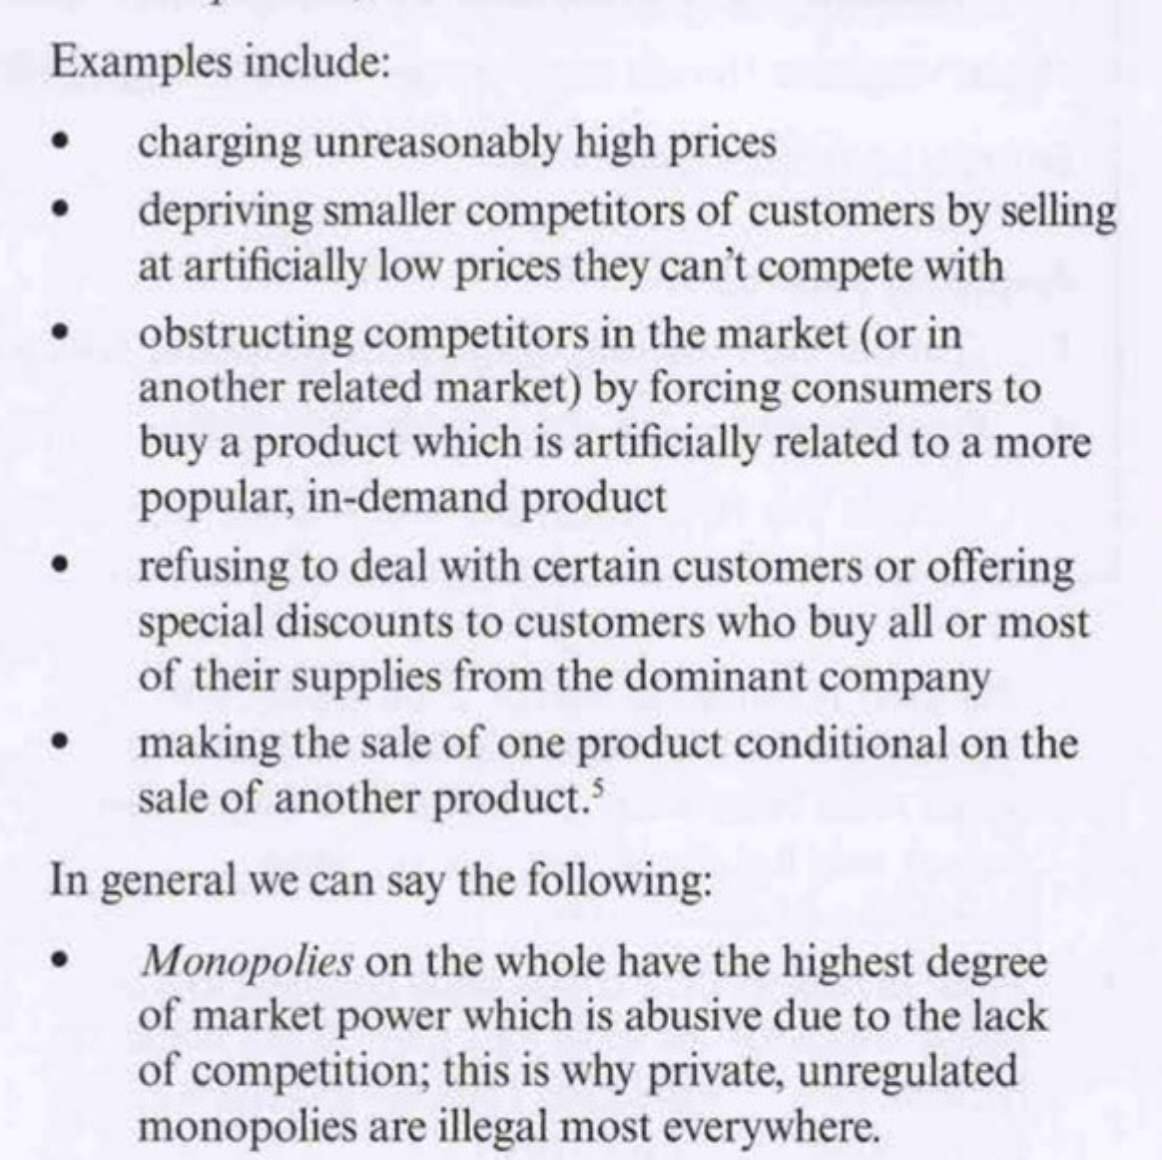
Explain what is an abuse of market power and include some examples of abuse.
abuse of market
power, also known as anti-competitive practices, refers
to situations where firms engage in activities that result
in reduced competition.