Kin 483-Ch.11: Factorial Analysis of Variance
1/10
There's no tags or description
Looks like no tags are added yet.
Name | Mastery | Learn | Test | Matching | Spaced | Call with Kai |
|---|
No analytics yet
Send a link to your students to track their progress
11 Terms
Review
Chapter 9 (ANOVA): the effect of different exercise programs
IV
Levels:
Chapter 10 (ANOVA RM): the effects of riding a stationary bike on fatigue at various time intervals over a 60-minute period
Each of these has one independent variable!
Identify the Independent and Dependent Variable(s) in the following scenario:
What is the effect of 3 different protein amounts, consumed post workout, on body composition in both men and women?
Dependent: body composition
Independent:
Amount of protein (3 levels)
Gender (2 levels; female/male)
Factorial Analysis of Variance: 3 × 2 ANOVA
Scenario: What is the effect of differing protein amounts, consumed post workout, on body composition in both men and women?
Analyzes differences of the dependent variable (body composition) on 2 factors - protein (different amounts) & gender (male and female)
This is called a 3 x 2 ANOVA
(protein x gender)
3 levels of protein, 2 levels of gender
Factorial Analysis of Variance: 3 × 2 × 3 ANOVA
Scenario: What is the effect of differing protein amounts, consumed post workout, on body composition in both men and women?
What would it be if we added 3 age groups?
3x2x3 ANOVA
(protein x gender x age group)
How can we make this a repeated measures design?
-not gender
-longitudinal study
F-Values and P-Values
Just like the previous ANOVA’s we studied, Factorial ANOVA’s also produce F-values and p-values.
We get an F-value for each factor (using our previous example)
We get an F-value for: Protein, Gender, Age
We also get an F-value for the interaction of factors
Interaction
the combined effect of the factors on the dependent variable
Example: give both men and women protein
Protein strongly affects men but not women
significant interaction
Example: give both men and women protein
protein affects both men and women in the same way
nonsignificant interaction
Analysis
When you get your results you will look for 3 things in the following order:
Main Effects
Interaction
If you have no main effects or interaction the analysis stops here
Simple Effects for each factor
Post Hoc comparisons (if 3 or more IVs)
SPSS: 2×2 Factorial Example
Import Data (specify you only want to put in 2×2 data)
Variable View (make sure variables are classified correctly)
Analyze —> General Linear Model —> Univariate
Dependent Variable (ROM) ; Independent Variables (Stretching, Sex)
Options —> Descriptive Statistics—> Continue
EM Means* —> Display Means for : (Independent variables : stretching, sex) —> Compare Main Effects —> Adjustment: LSD —> Continue
*For 2×2, you need to do EM means instead of Post Hoc because SPSS won’t do post Hocs
SPSS: 2×2 Factorial Analysis
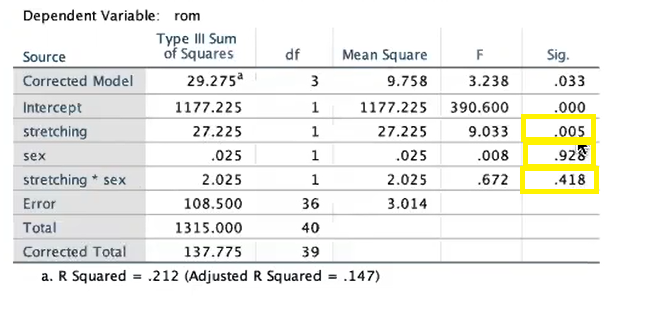
Tests of Between-Subjects Effects
Check significance of independent variables
stretching (0.05)
sex (0.928)
stretching * sex (0.418)
If none are significant—> accept null hypothesis
Pairwise Comparisons
Sex: no significance
Stretching: Significance between stretching 1 and stretching 2
find out where differences are
Estimates
Check mean value; which has greater ROM ?
stretching 2 (6.250 vs. 4.600)
Make conclusionary statements
SPSS: 3×3 Factorial ANOVA Example
Import Data (specify you only want to put in 3×3 data)
Variable View (make sure variables are classified correctly)
Analyze —> General Linear Model —> Univariate
Dependent Variable ; Independent Variables
Options —> Descriptive Statistics—> Continue
Post Hoc —>Factors (stretching, age group); Post Hoc Tests for (stretching, age group) —> Tukey —> Continue
SPSS: 3×3 Factorial ANOVA Analysis
Tests of Between-Subjects Effects
Check significance of independent variables
If none are significant—> accept null hypothesis
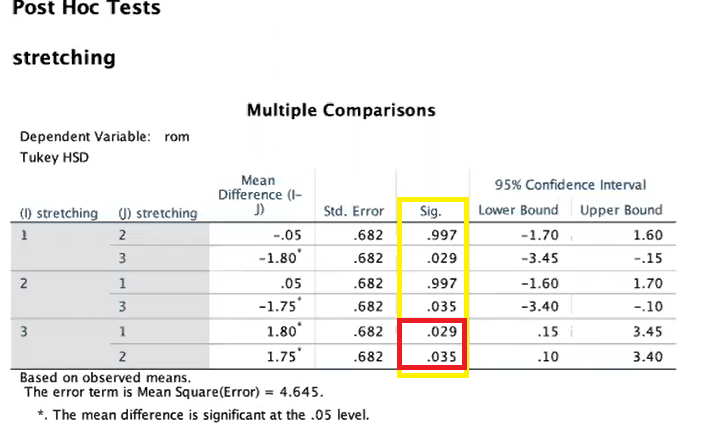
Post Hoc Tests: Multiple Comparisons
Only look if one of IV is significant OR if the interaction between them is significant
do NOT look at post hocs if IVs are significant AND the interactions
Difference between 3 and 1 and 3 and 2
Estimates
Check mean value; which has greater ROM ?
Make conclusionary statements