Populations, planning and current global health challenges
1/21
There's no tags or description
Looks like no tags are added yet.
Name | Mastery | Learn | Test | Matching | Spaced | Call with Kai |
|---|
No study sessions yet.
22 Terms
Definition and use of demography
• Demography is the study of human population with respect to size, composition, spatial distribution, and changes in the population that occur over time.
• Populations are never static, they grow or decline through the interplay of three demographic processes:
1. Fertility (Number of births that occur to an individual or a population)
2. Mortality (Death of an individual or the number of deaths that occur in a population)
3. Migration (The movement of people into or out of a specific geographic area)
Why do we need demography?
Health service Planners can only successfully implement plans if they can develop programmes that meet the present and future needs of different segments of the population, you need this info, how many beds needed in certain regions?
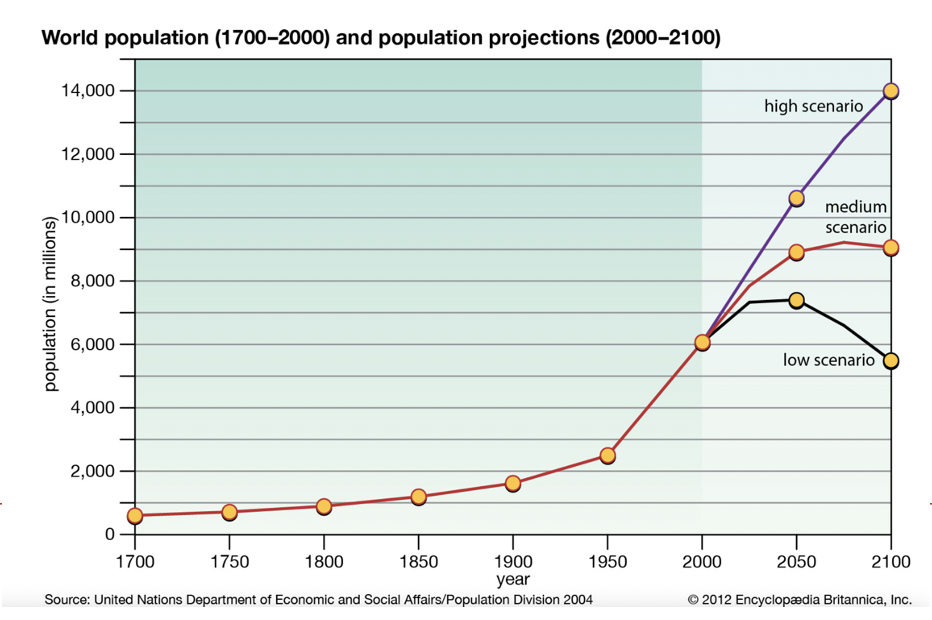
What was behind the significant increase in the world’s population
A) Impact of the industrial revolution yes most
B) Increase in fertility in low income countries yes as well
C) Increased life expectancy yes too
Before industrial revolution was a higher birth rate and more childhood mortality. Brought new ways to eat, farm, hygiene standards all of which impacted health. 1750, gradual increase started along there.
It seems we are going towards a medium scenario.
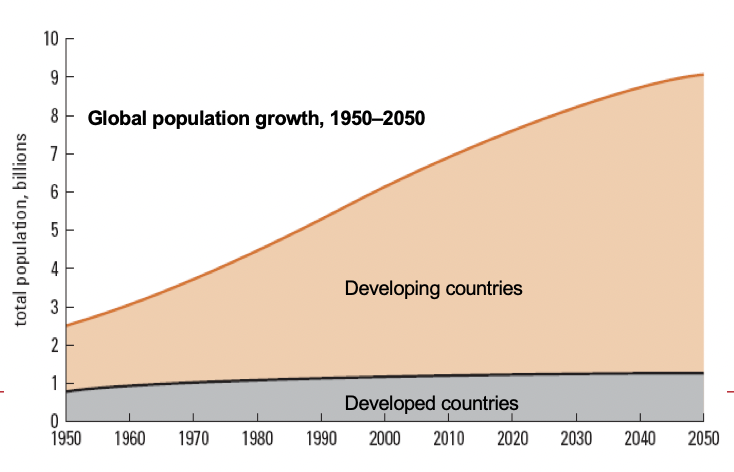
Global difference in population growth
Where is it occurring?
small proportion of current births today taking place in developing countries.
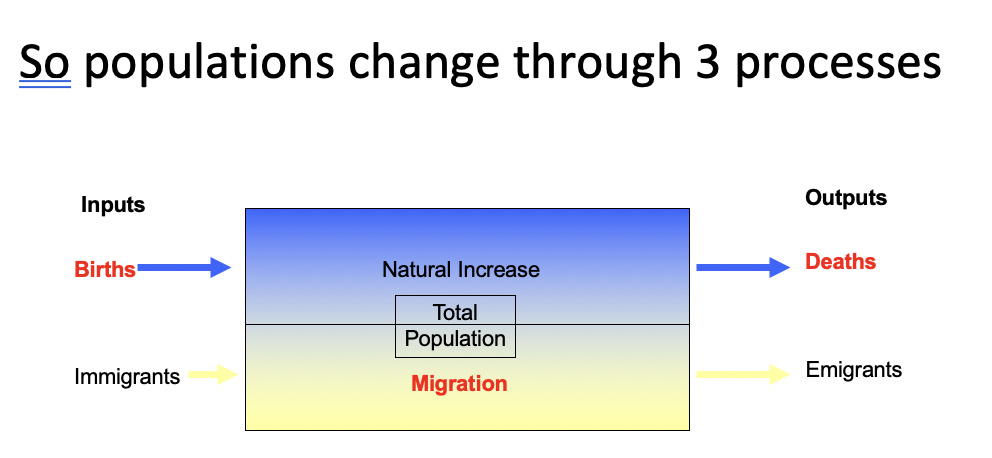
Populations change through 3 processes
1) Births
2) Migrations (in and out)
3) Deaths
Births
in 1800s women were having on average 6 children
since 1960s this figure has dropped dramatically and women are now having on average around 2 children per woman in the developed world
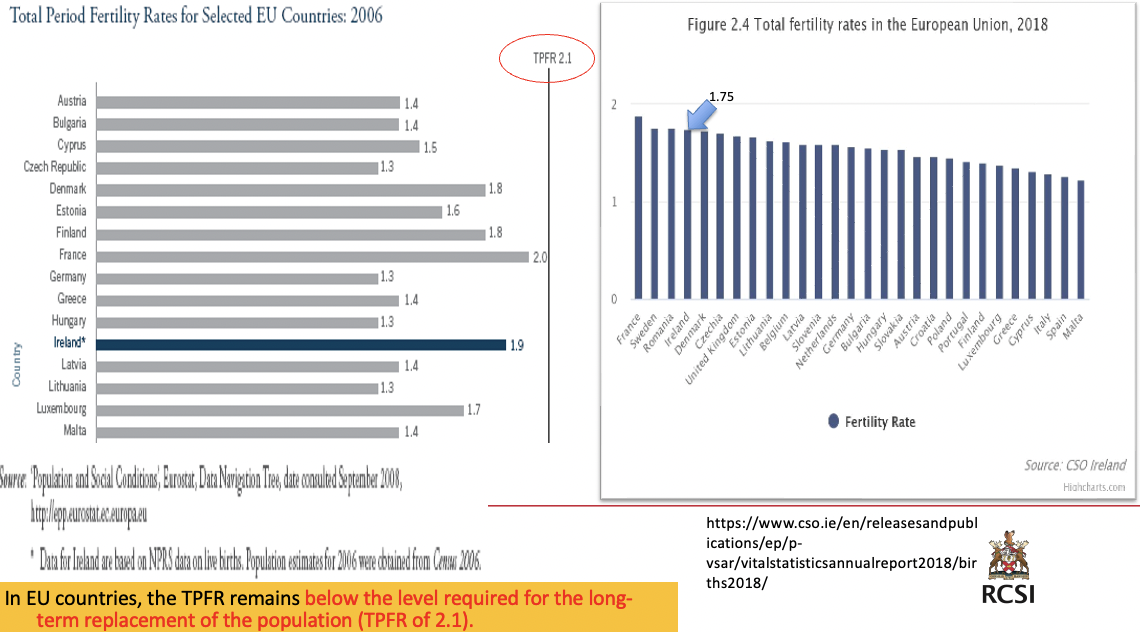
TPFR (total period fertility rates) is a measure of the average number of children that would be born to a woman if she were to experience the exact current age-specific fertility rates (ASFRs) through her lifetime.
replacement rate - total number of births needed per woman to replace current population (2.1 per woman currently)
We are not meeting replacement rate to maintain population
Migration
International migration
abt 281 million (3.6%) of people across the world are international migrants (2020)
most migrants are from developing countries to more industrialized
in 2020, the total number of refugees and asylum seekers in the world was estimated at 30.5 million
migration affects population growth
A refugee is strictly defined in international law as a person who is fleeing persecution or conflict in her or his country of origin.
migration and war
The Syrian war has created the latest population displacement current times. Since 2011, abt 6.8 million Syrians have become refugees outside of their own country and another 14.6 million people in need of aid within Syria. Half of the people affected are children.
migration and urbanization - negative public health impacts
more people than ever before now live in cities
economic development centred in urban areas
better job opportunities, public services
today, 55% of the world’s population lives in urban areas, a proportion that is expected to increase to 68% by 2050
some cities have more slums and sanitation problems, air pollution
• Overcrowding
• Slums that lack proper sanitation
• Unplanned urban housing,
• Inadequate transport, and food systems,
• Air pollution,
• Traffic injury
• Increase in mental health issues
Urban health risks are distributed unequally among social groups

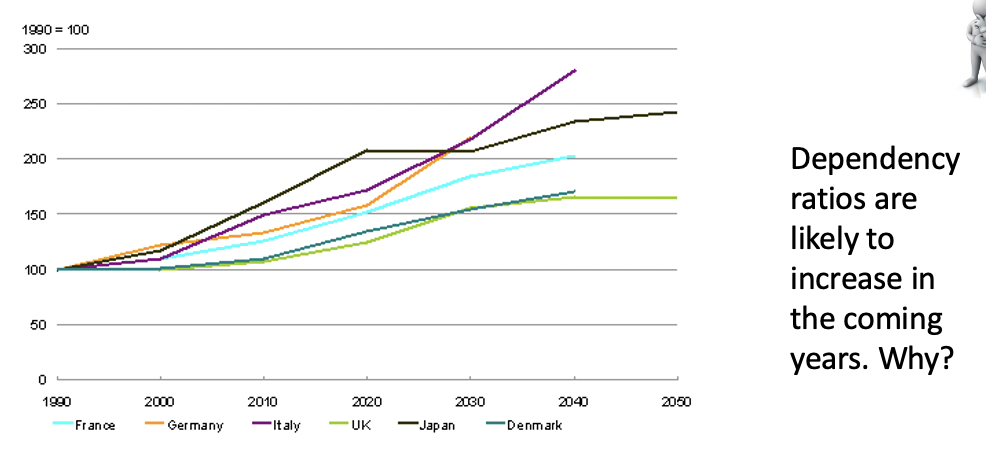
Deaths - people are now living longer
• The pace of population ageing is much faster than in the past. By 2050, the proportion of the world’s population over 60 years will nearly double from 12% to 22%.
• The number of very elderly people
• ( 85+) is a key consideration with an ageing population
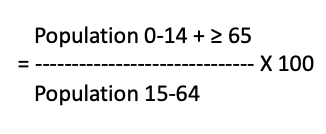
Age dependency ratio (total)
Age dependency ratio (total) is the ratio of dependents - people younger than 15 or older than 64 - to the working-age population - those aged 15-64. Calculated as the proportion of dependents per 100 working-age population
Those under 15 and aged 65 and over have highest need for health services; those in the ages in between potentially work and pay taxes to pay for public services, so the ‘dependency ratio’ is relevant to health planners.
Age dependency rations may be young and old
• Age dependency ratio, young, is the ratio of younger dependents - people younger than 15 - to the working-age population - those ages 15-64. Calculated as the proportion of dependents per 100 working-age population.
Population 0-14
------------------------------ X 100
Population 15-64
• Age dependency ratio, old, is the ratio of older dependents - people older than 64 - to the working-age population--those ages 15-64. Calculated as the proportion of dependents per 100 working-age population.
Population ≥ 65
------------------------------ X 100
Population 15-64
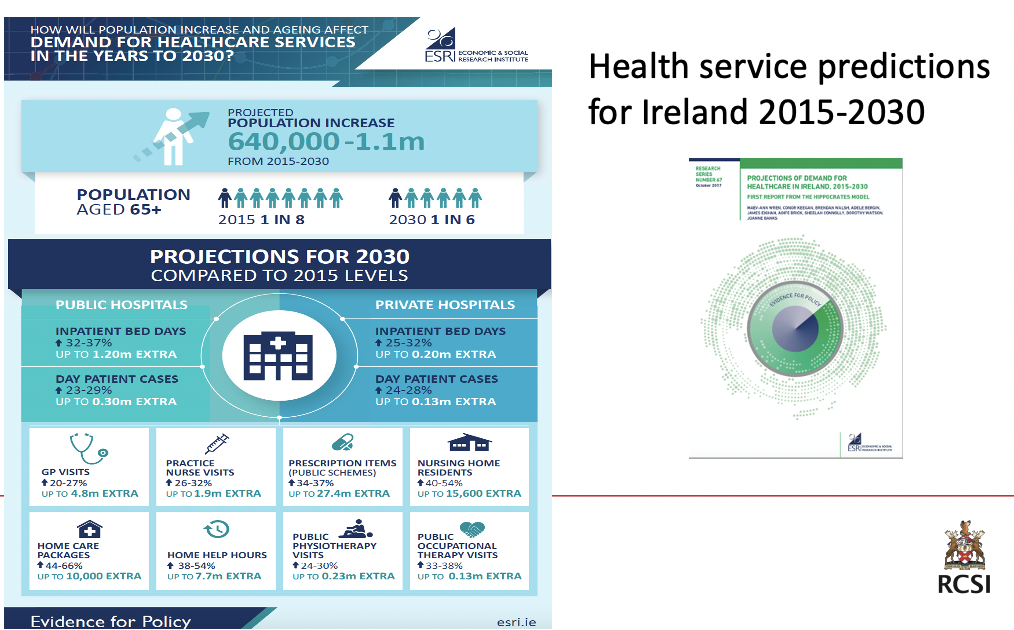
The impact of an ageing population
What issues need to be considered in terms of health service provision? (min 23)
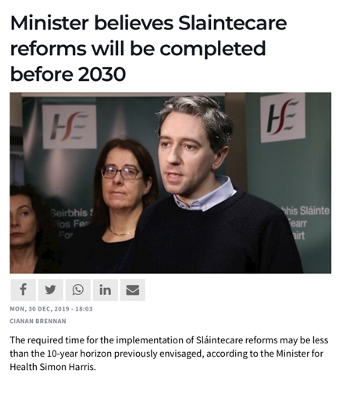
Slaintecare for an ageing population
support a shift to community based care to bring care closer to home
develop integrated care focusing on chronic conditions
continue focus on health and well being initiatives
homecare packages and transitional care to support timely discharge from hospital
Major global health challenges
What were the 10 major global health threats predicted in 2019?
air pollution
NCDs
Influenza pandemic
Fragile and venerable settings
antimicrobial diseases
ebola and other high-threat pathogens
weak primary healthcare
vaccine hesitancy
dengue
HIV
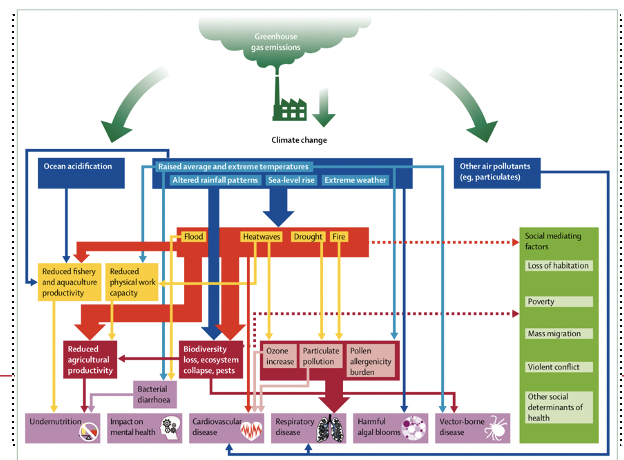
rapidly changing climate has dire implications for every aspect of human life, exposing vulnerable populations to extremes of weather and altering patterns of infectious diseases
You can talk through this slide and then mention that they will re-visit this in environment and health
nutrients in crops drop by huge proportion, a loss of biodiversity,
Impacts include:
reduced agriculture
loss of biodiversity
ecosystem collapse
pest increase
ozone increase
particulate pollution
pollen allergenicity
Direct health effects
NCDs - stress based, transmissible (flooding, waterborne viruses)
increased burden of non-communicable disease
immediate/non-planned migration leads to strain on healthcare systems, strain on food supplies, not enough shelter
food shortages
change in patterns of infectious diseases
mental health issues
violent and antisocial behaviour
exercise
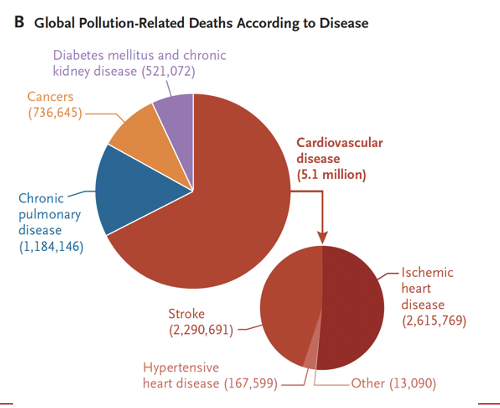
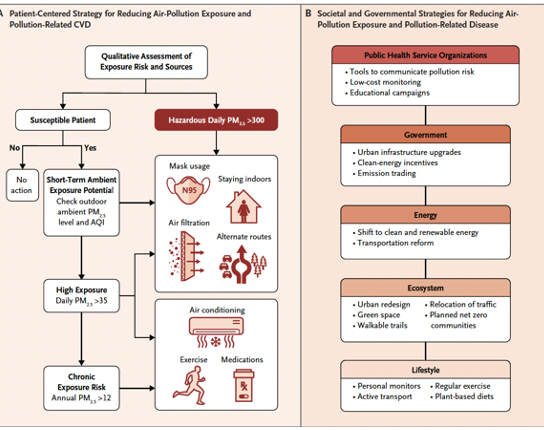
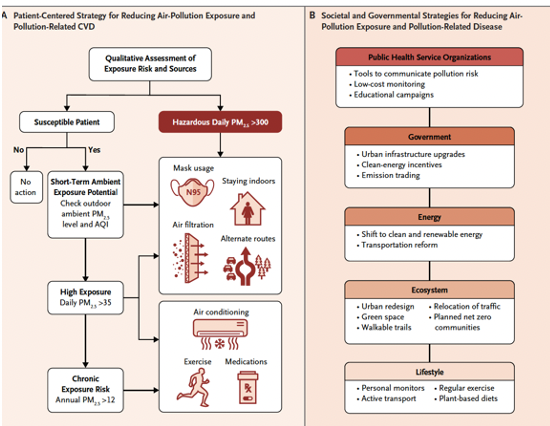
recognition of pollution as a major cardiovascular risk factor that is often overlooked in clinical practice opens up multiple opportunities for prevention and control. How might it be incorporated into clinical practice.
38min
Panel A - a patient-centered strategy for reducing air-pollution exposure and pollution-related CVD.
Assessment of exposure includes evaluation of exposure to HAP on the basis of the patient’s ZIP (EIR) Code and
Susceptible patients - those with atherosclerotic CVD (ASCVD) and coexisting conditions, recent hospitalization for an acute coronary syndrome, heart failure, chronic obstructive pulmonary disease, or asthma. Also diabetes, or stage 3 or 4 chronic kidney disease with one or more risk factors.
Other Patients at risk - pregnant women, the elderly, and transplant recipients.
Panel B shows societal and governmental strategies for reducing air-pollution exposure and pollution-related disease.
role of doctors and other health professionals
• Health professionals must be leaders in responding to the health threat of climate change. A public health perspective has the potential to unite people behind a common cause—the wellbeing of our families, communities, and countries. This is far more tangible than tonnes of atmospheric CO2, and is understood and prioritised across all populations irrespective of culture or status.
• Another key leadership role is to actively promote sustainable healthcare. Responsible for some 4–5% of global greenhouse gas emissions, the health-care sector has a vital role to play in climate change mitigation.
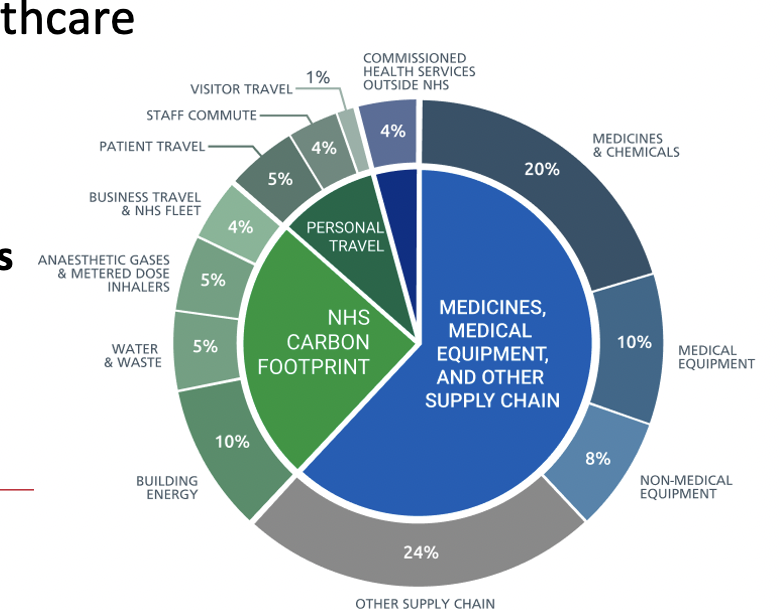
Sustainable healthcare
Source of carbon emissions by proportion of NHS carbon footprint plus
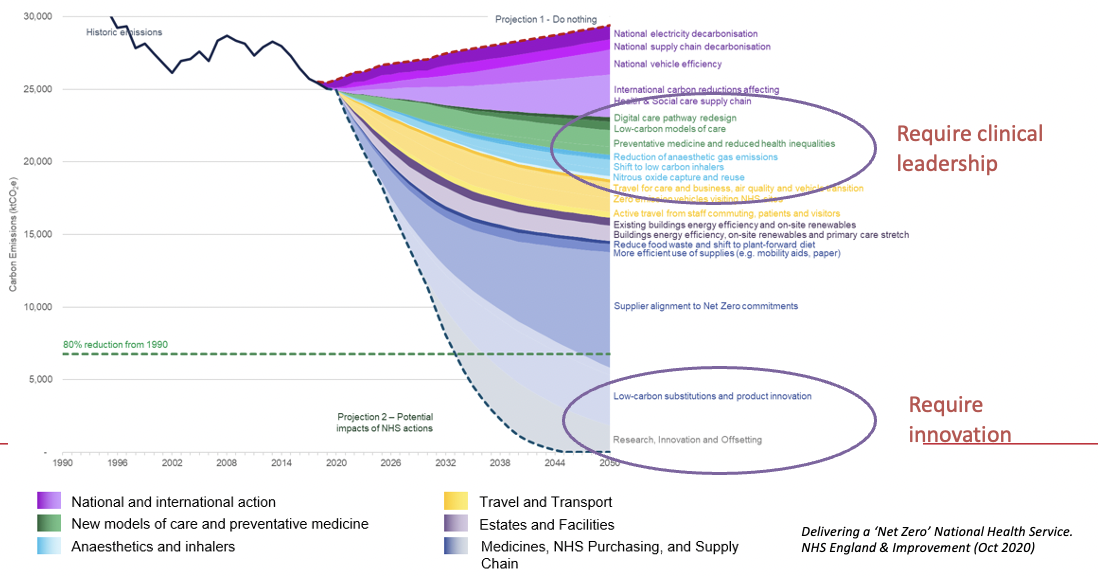
pathway to net zero for the NHS carbon footprint plus scope (43min)
Net Zero report – innovation & research – This diagram is from work undertaken in the NHS looking at the actions needed to deliver a new zero health service
Note the areas that require clinical leadership
Important to embed sustainability into quality improvement practices
digital care pathways, supply chain innovation
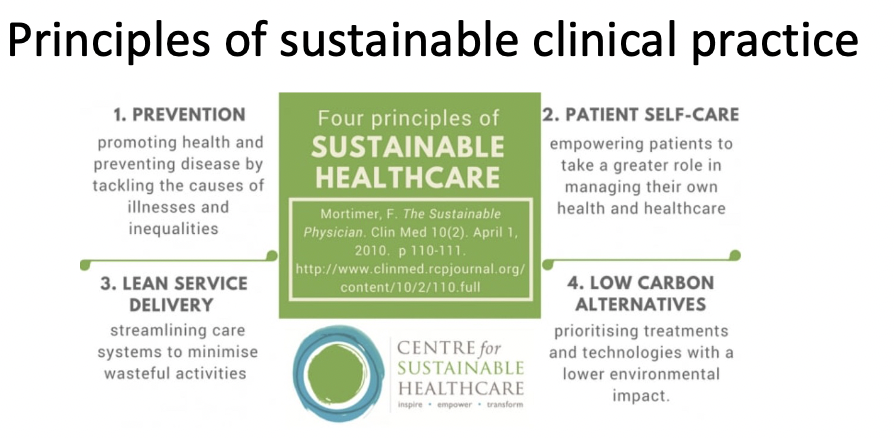
principles of sustainable clinical practice
prevention
patient self-care
lean service delivery
low carbon alternatives