Case 1: Usha L. - Cardiac Cycle
 Call Kai
 Learn
Learn Practice Test
 Spaced Repetition
 Match
Match Flashcards
 Knowt Play
1/61

There's no tags or description
Looks like no tags are added yet.
Name | Mastery | Learn | Test | Matching | Spaced | Call with Kai | Chat |
|---|
No analytics yet
Send a link to your students to track their progress
62 Terms
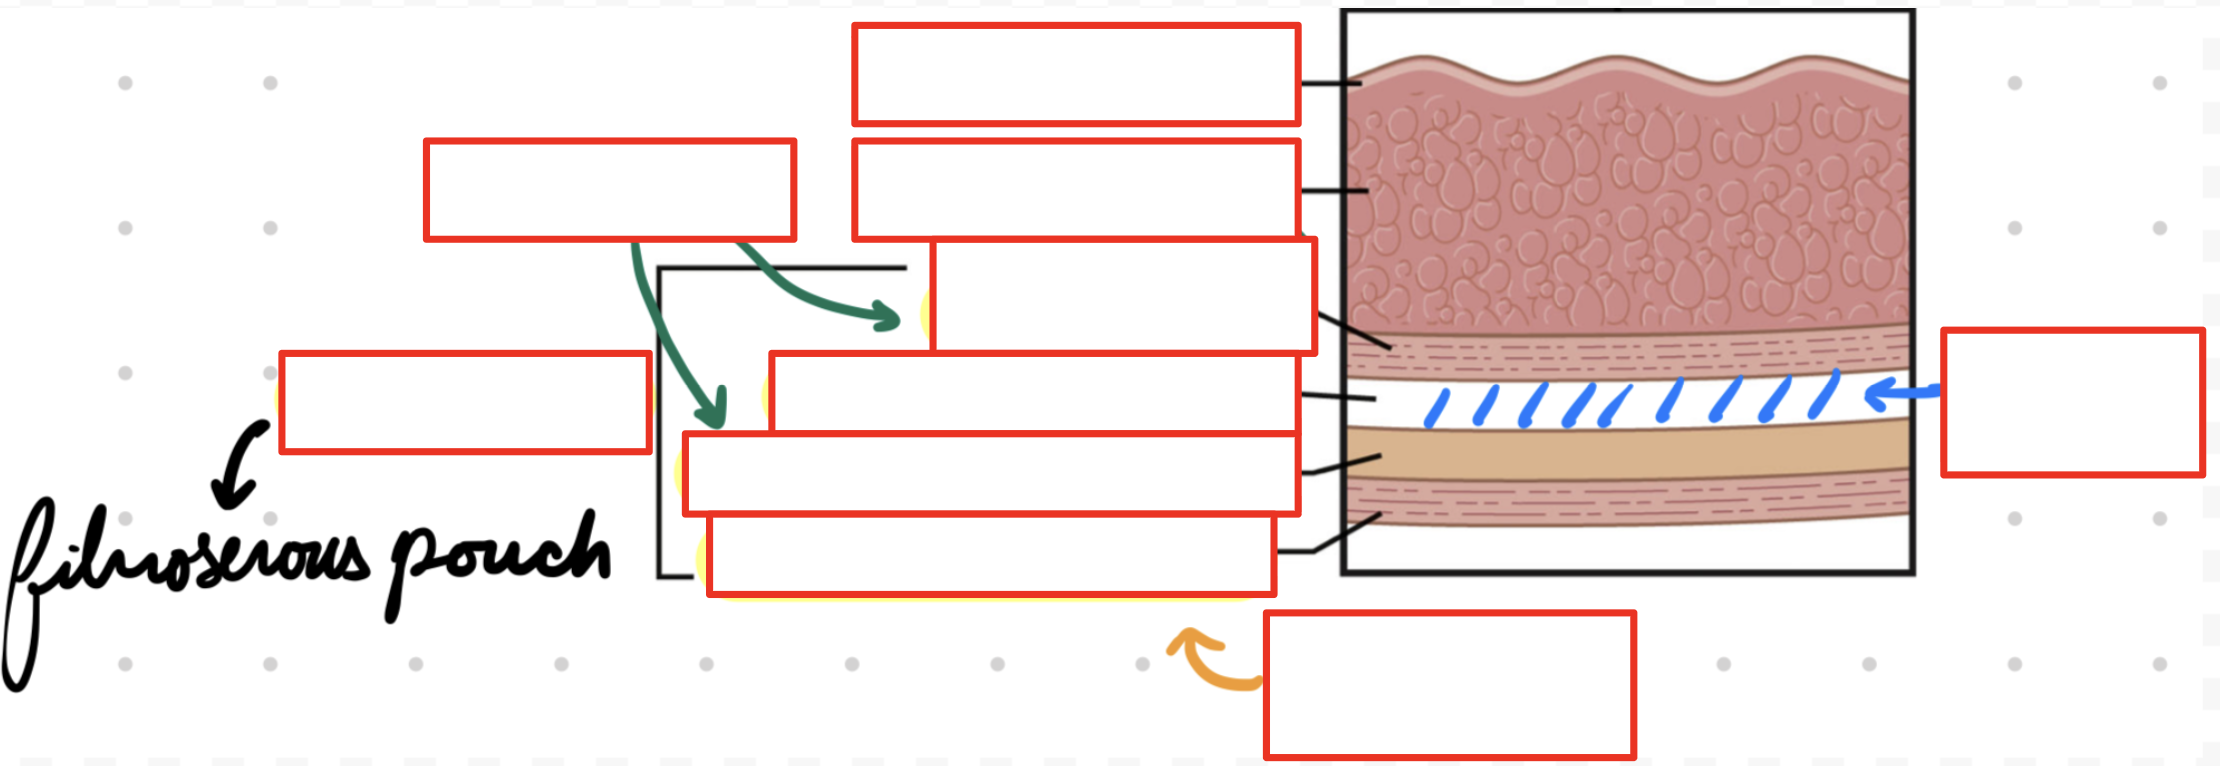
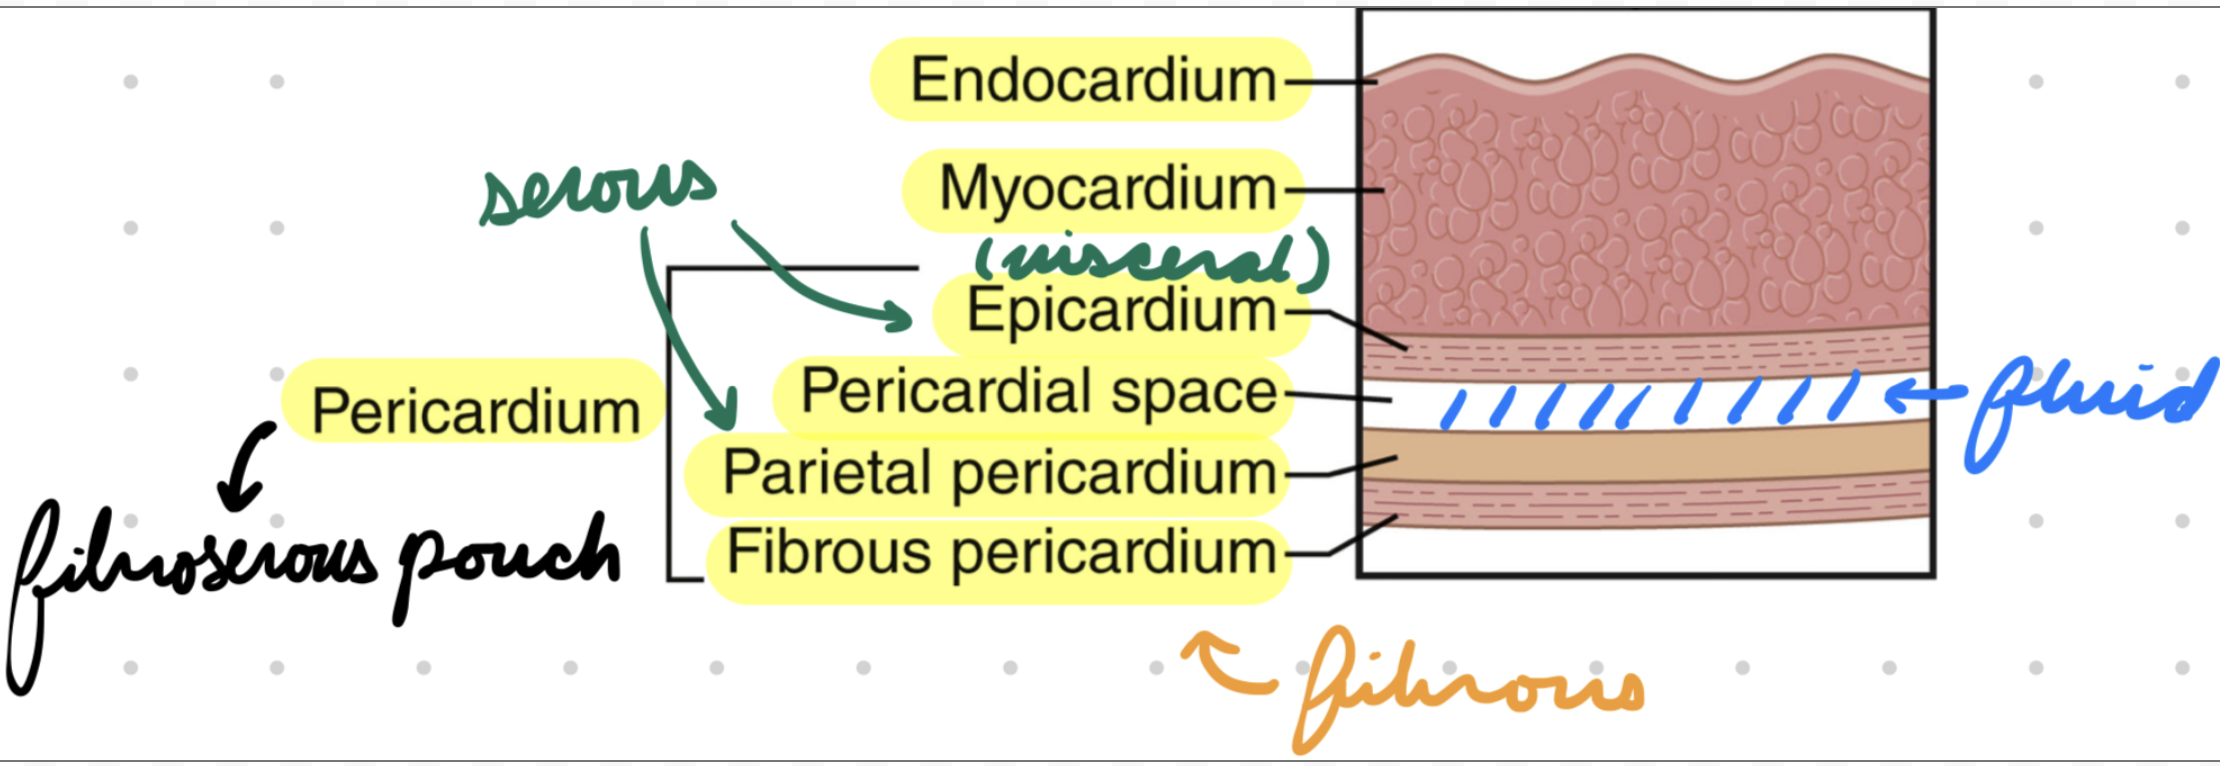
Pericardium
Fibroserous pounch around heart
Layers:
Fibrous layer
Parietal serous layer
Pericardial space
Visceral serous layer (epicardium)
Myocardium
Endocardium
Pericardium: Pericardial Space
Between parietal and visceral layers
Contain fluid
Heart Chambers
4 (2 left, 2 right)
Right:
Right atrium and ventricle
Left:
Left atrium and ventricle
Heart Muscles
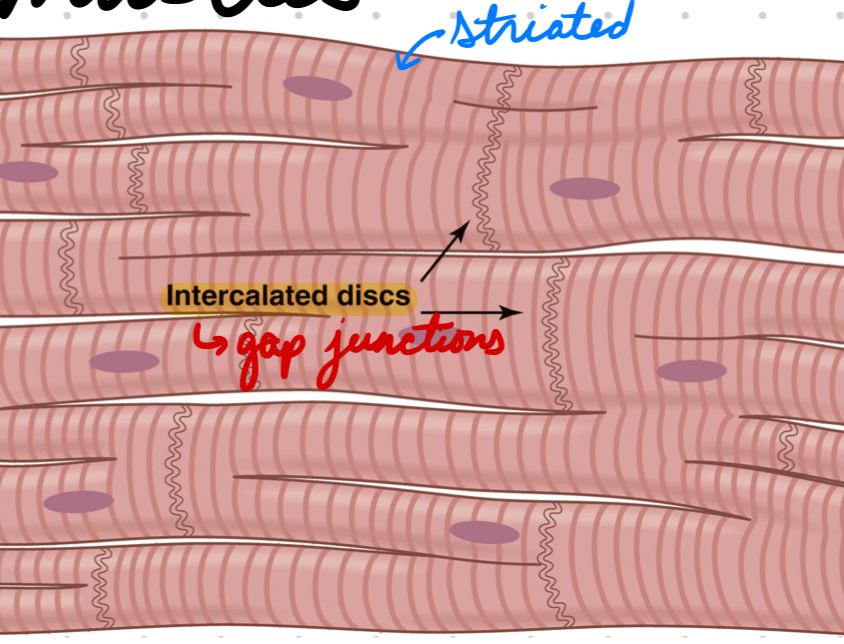
Cardiomyocytes
Papillary muscles
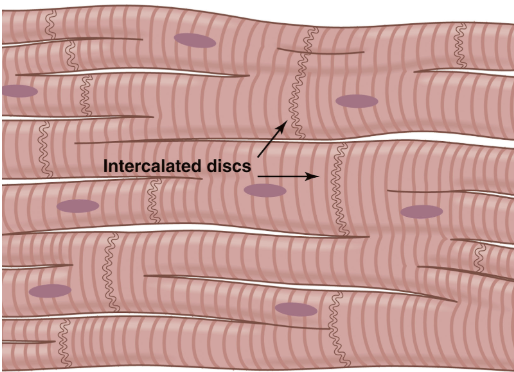
Cardiomyocytes
Striated
Actin and myosin filaments
Intercalated discs (cell membrane) forming gap junctions
Papillary Muscles
Attached to chordae tendineae (connective tissue)
Heart Valves
Attached to fibrous collagen rings → Fibrous heart skeleton
Separate atrial and ventricular myocardia
Atrioventricular (AV) and semilunar (SL) valves
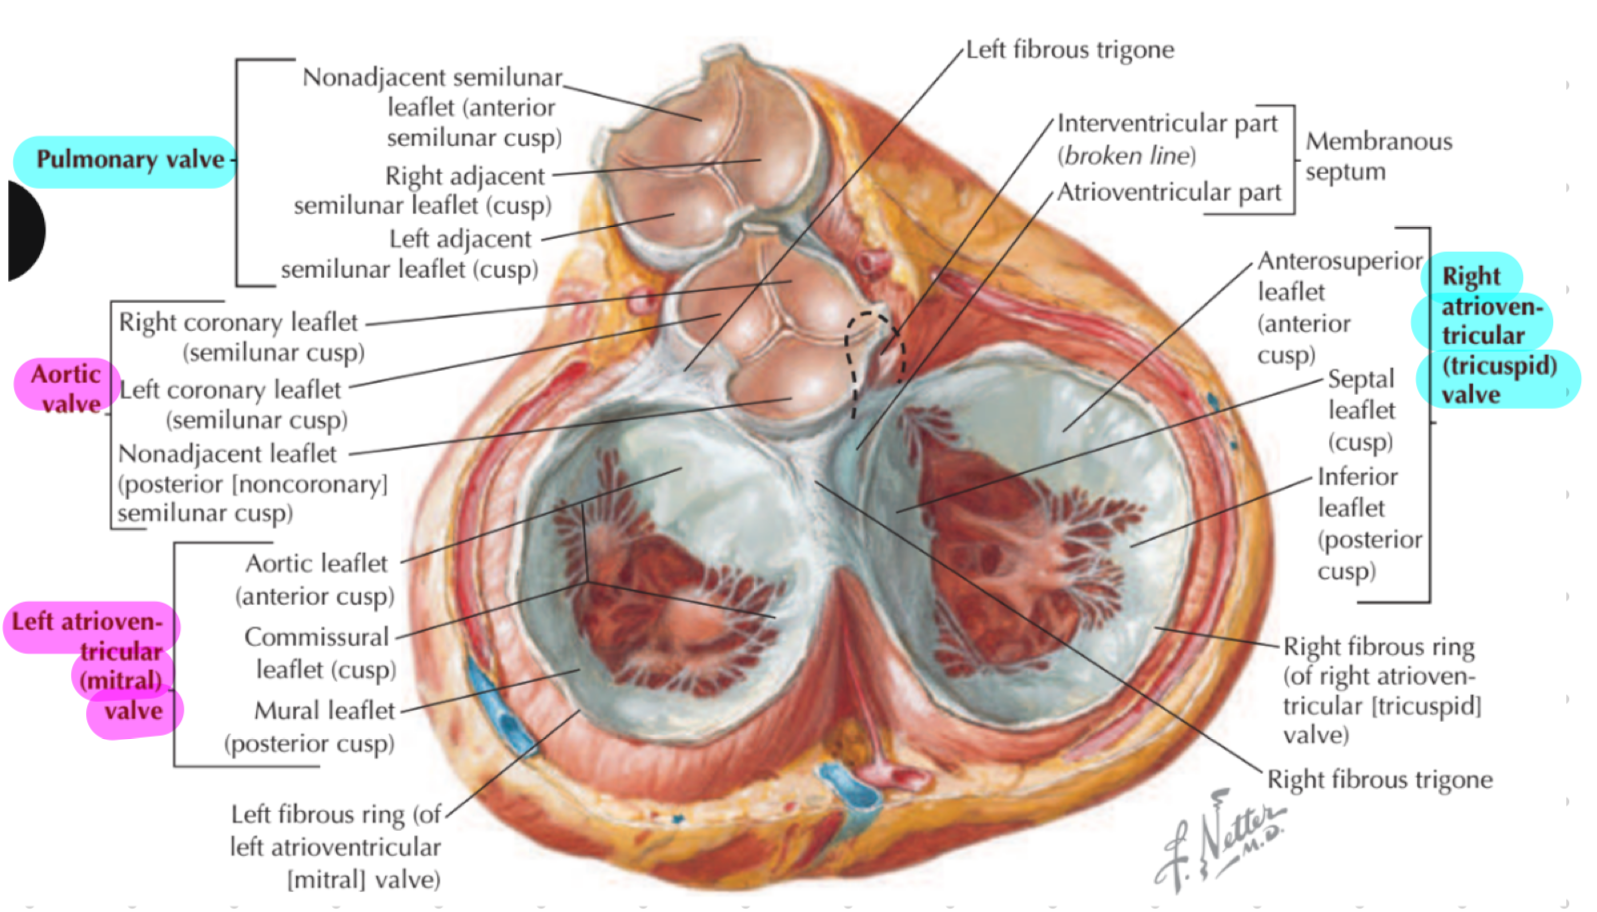
AV Valves
Right: Tricuspid
Between right atrium and ventricle
3 leaflets
Left: Mitral (Bicuspid)
Between left atrium and ventricle
2 leaflets
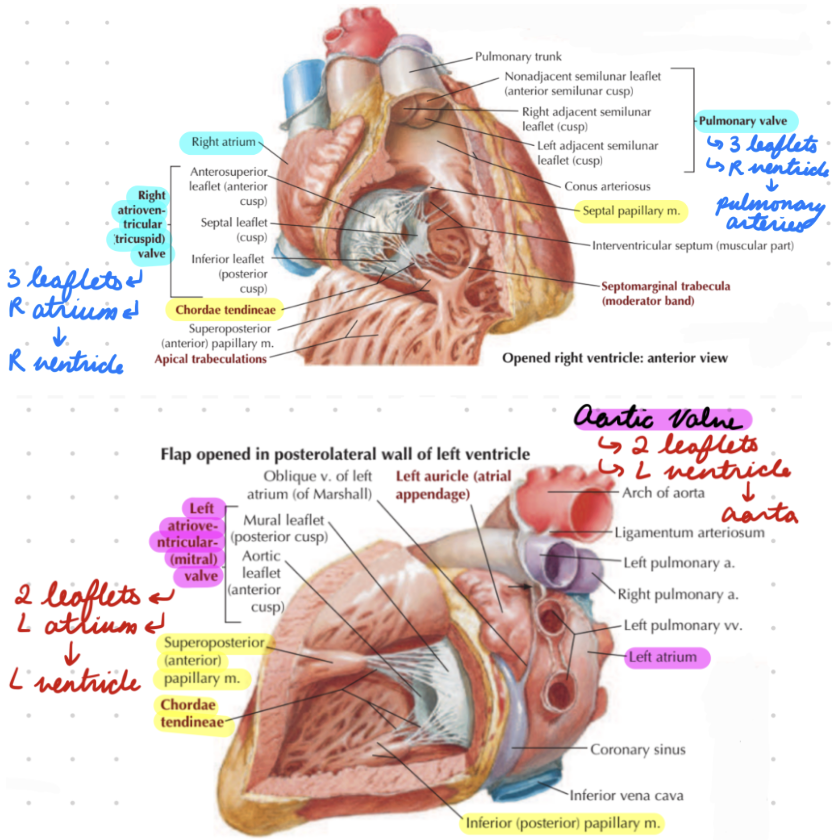
SL Valves
Right: Pulmonary
Between right ventricle and pulmonary trunk
3 leaflets
Left: Aortic
Between left ventricle and aorta
3 leaflets
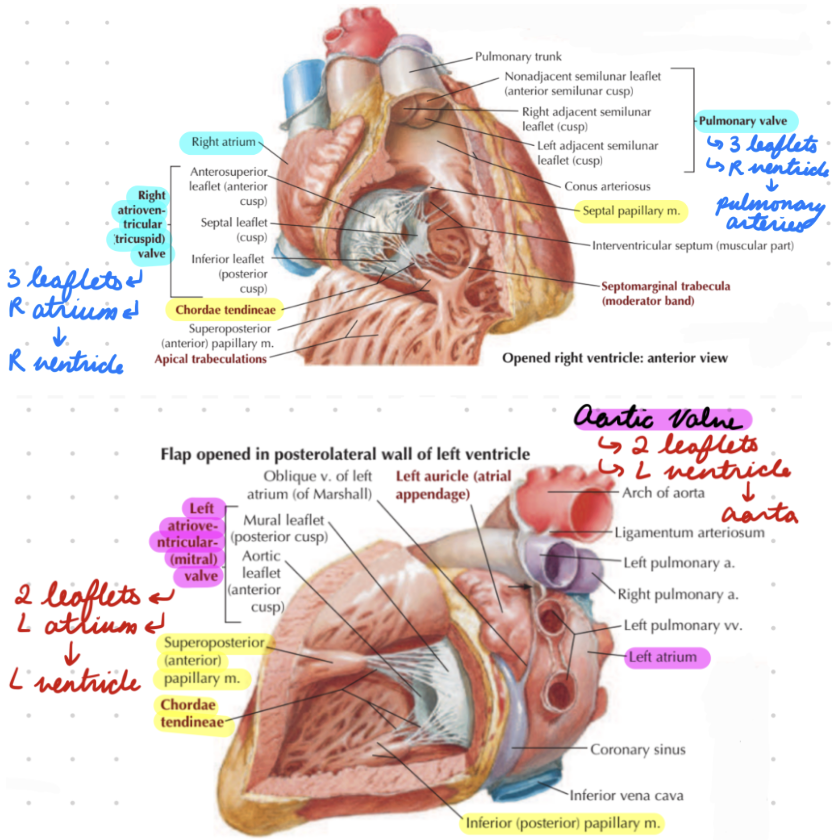
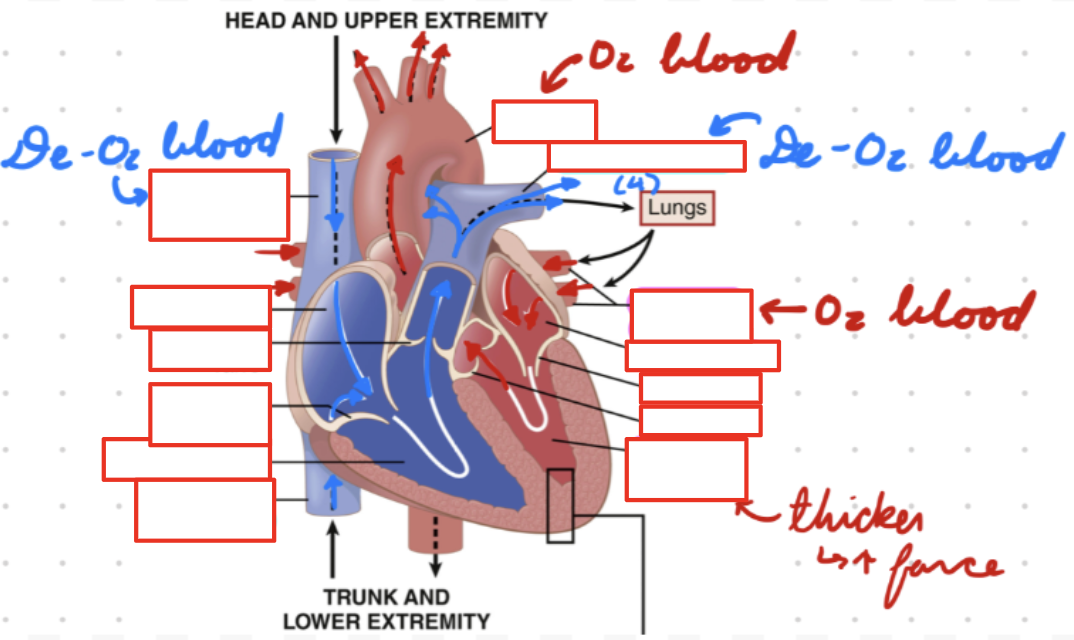
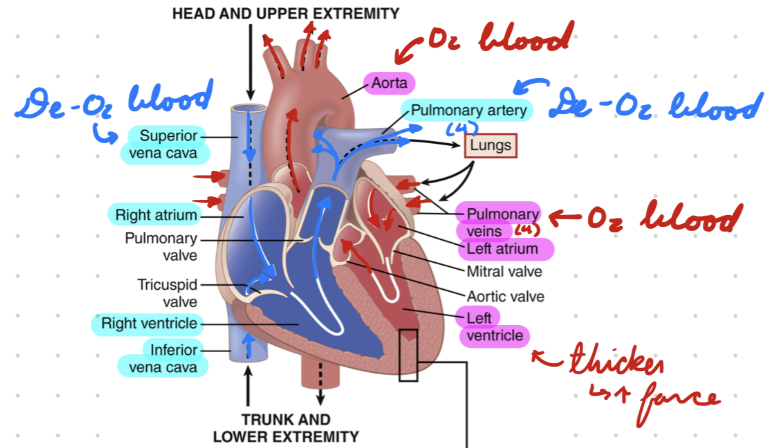
Heart Chamber Physiology: Left Atrium
Receive oxygenated blood from pulmonary circulation (pulmonary veins)
Pump to left ventricle
Heart Chamber Physiology: Left Ventricle
Receive blood from left atrium
Pump to systemic circulation (aorta)
Thicker muscles than right
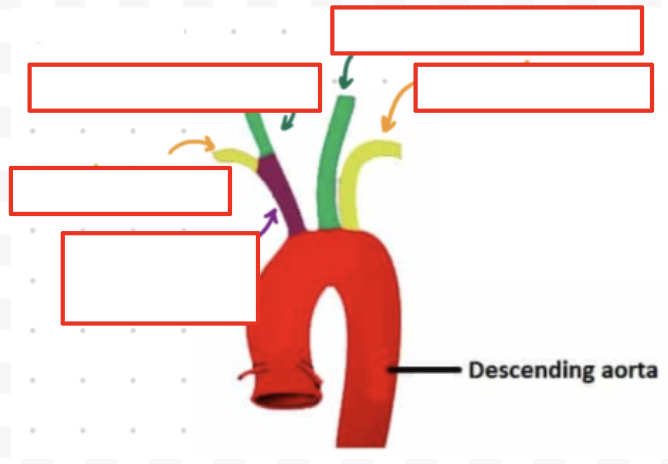
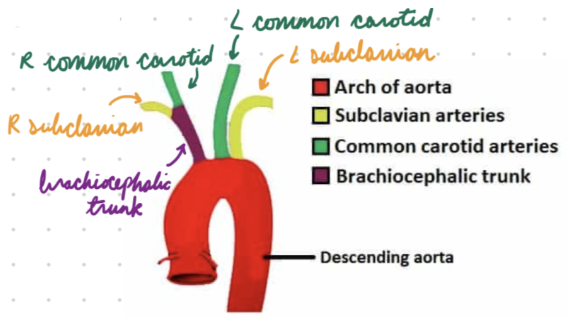
Aorta Branching
Aortic Arch: 3 branches
Left subclavian artery
Left common carotid artery
Brachiocephalic trunk
Brachiocephalic Trunk: 2 branches
Right subclavian artery
Right common carotid artery
Heart Chambers Physiology: Right Atrium
Receive deoxygenated blood from systemic circulation (superior and inferior vena cava, coronary sinus)
Pump to right ventricle
Heart Chambers Physiology: Right Ventricle
Receive blood from right atrium
Pump to pulmonary circulation (pulmonary arteries)
Myocardial Cell Physiology
Prolonged skeletal muscle-like contractions
Gap Junctions: Fast ion diffusion = Action potential travel between cells
Syncytium Contraction: Rapid action potential = Muscle cells contract together
Atrial and ventricular syncytia
Atria contracte befor ventricles (AV node delay)
Papillary Muscle Physiology
Attach to AV valves by chordae tendineae
Pull and align valves
Prevent eversion during systole
Contract with ventricles
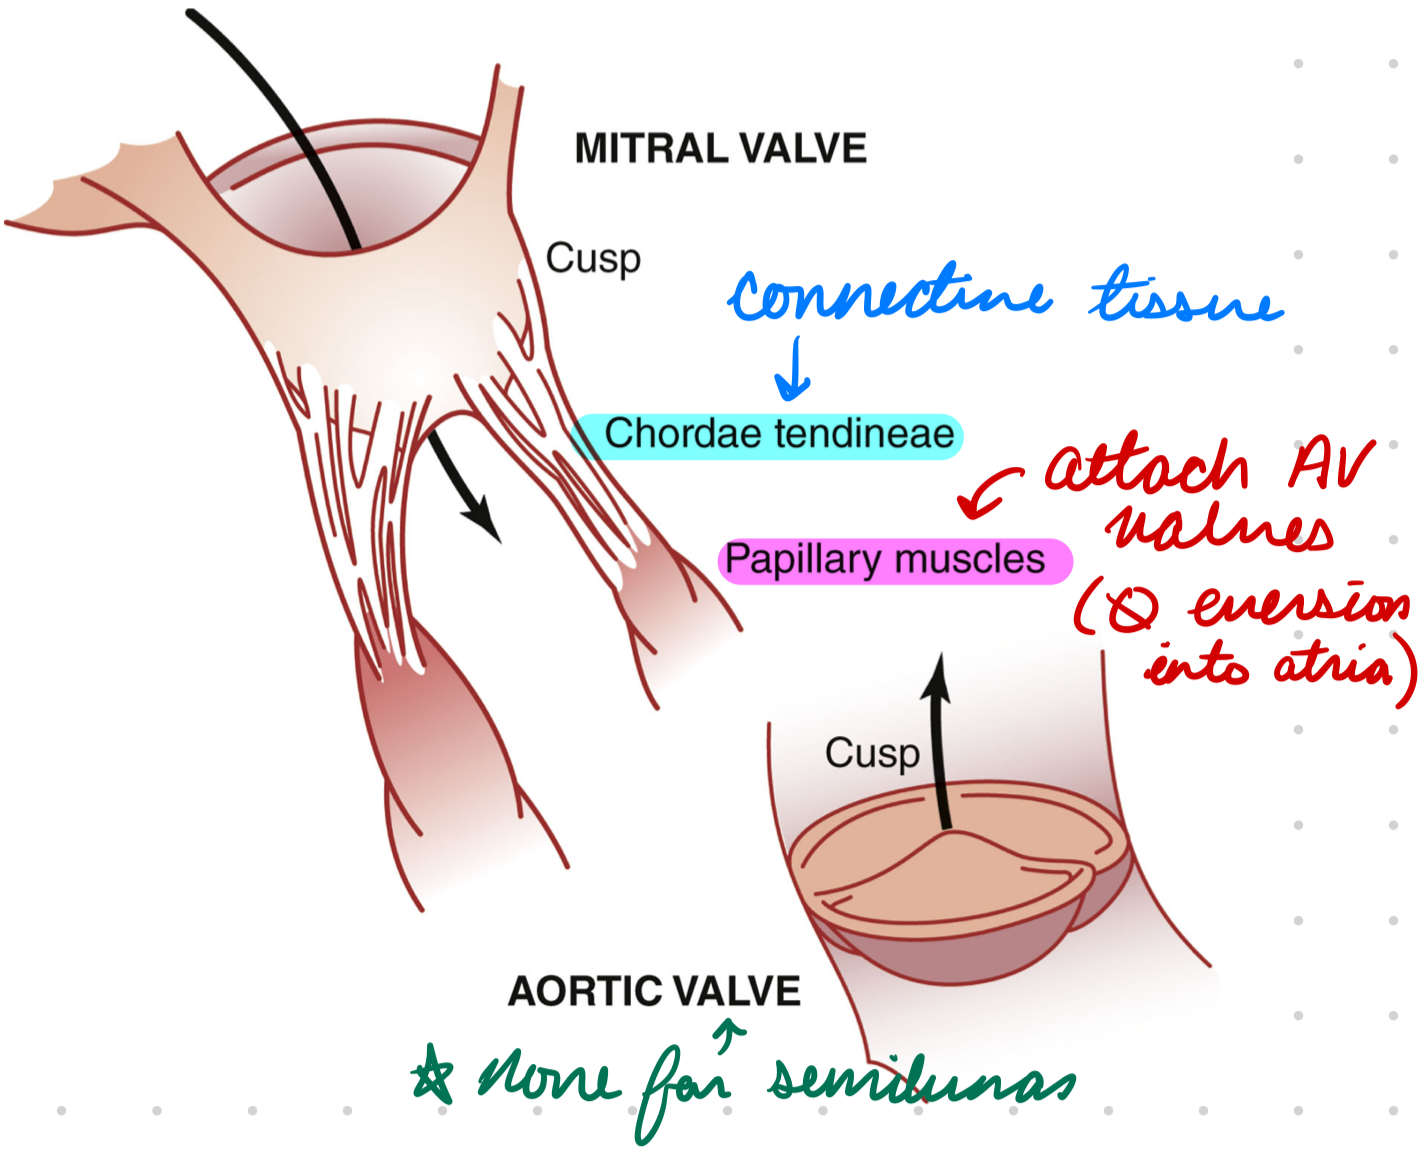
Heart Valves Physiology
Prevent blood backflow
Passive opening and closing from pressure differences during systole and diastole
AV: Prevent ventricle → Atria back flow during systole
SL: Prevent aorta/pulmonary artery → Ventricle back flow during diastole
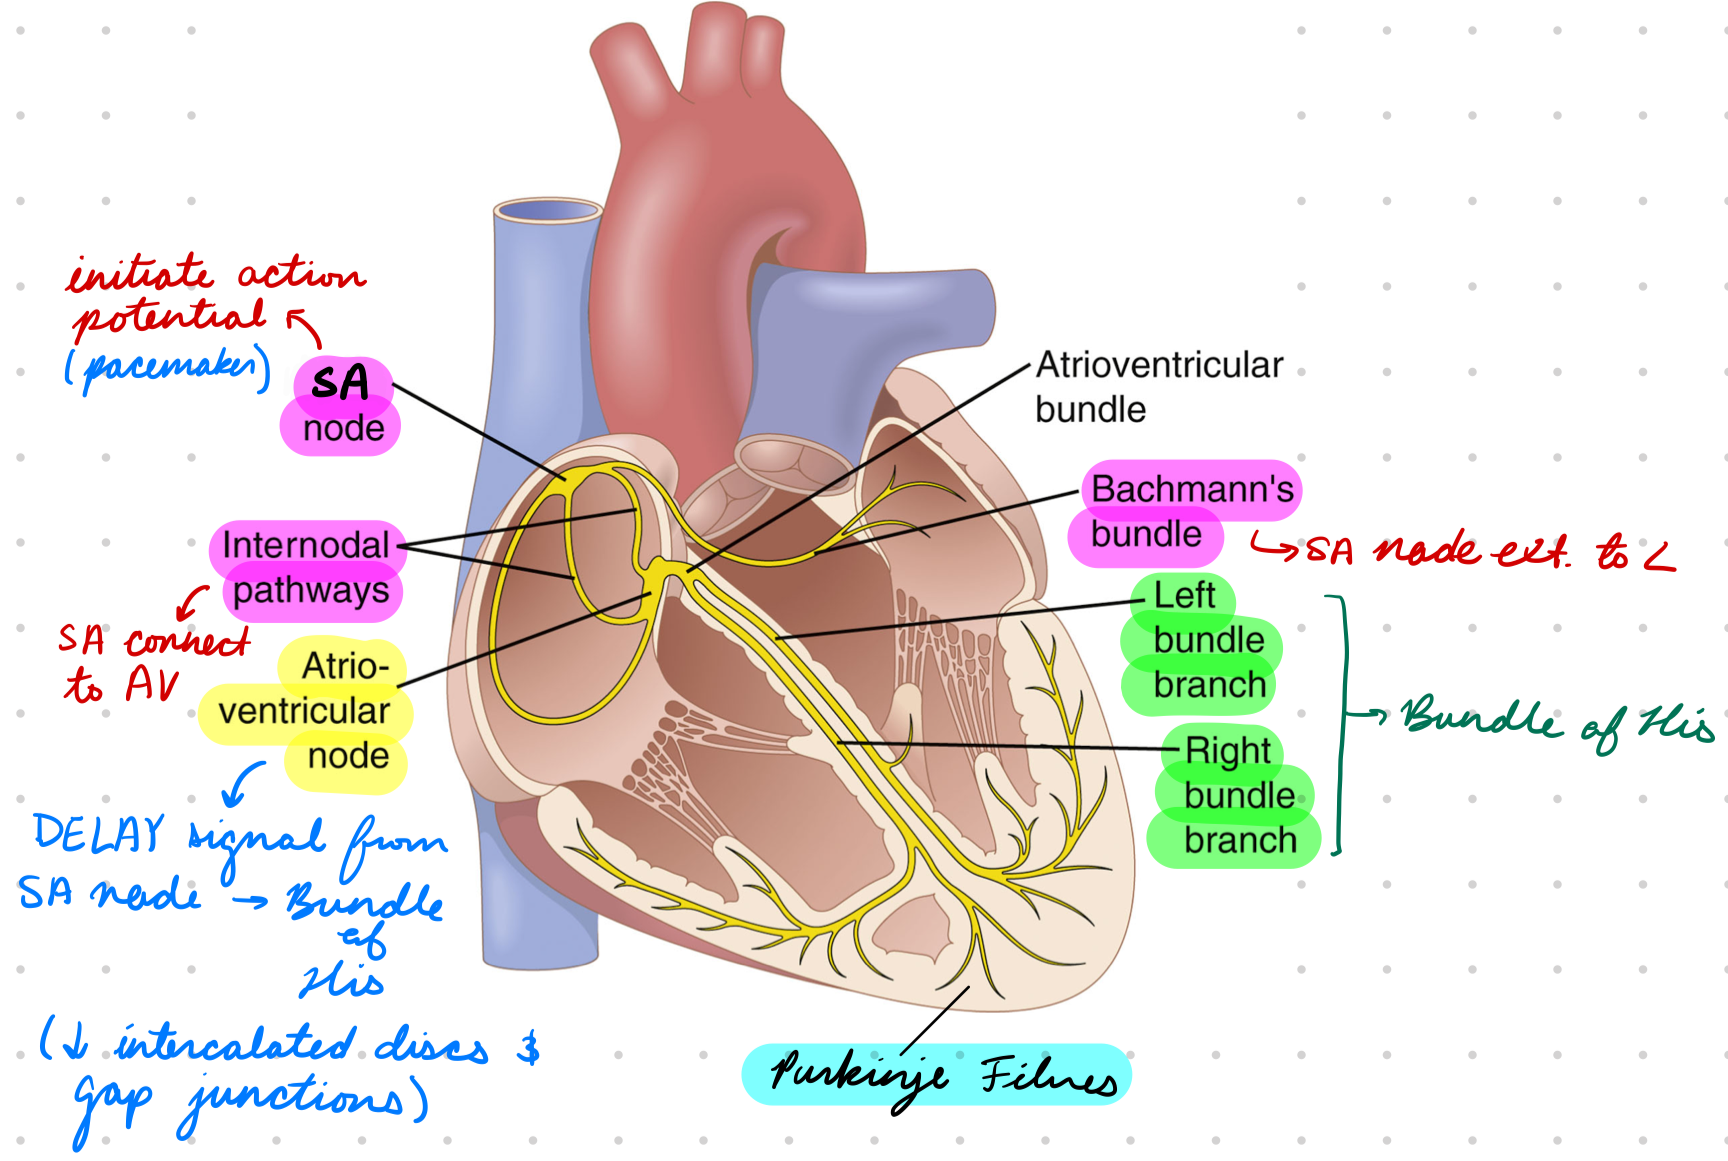
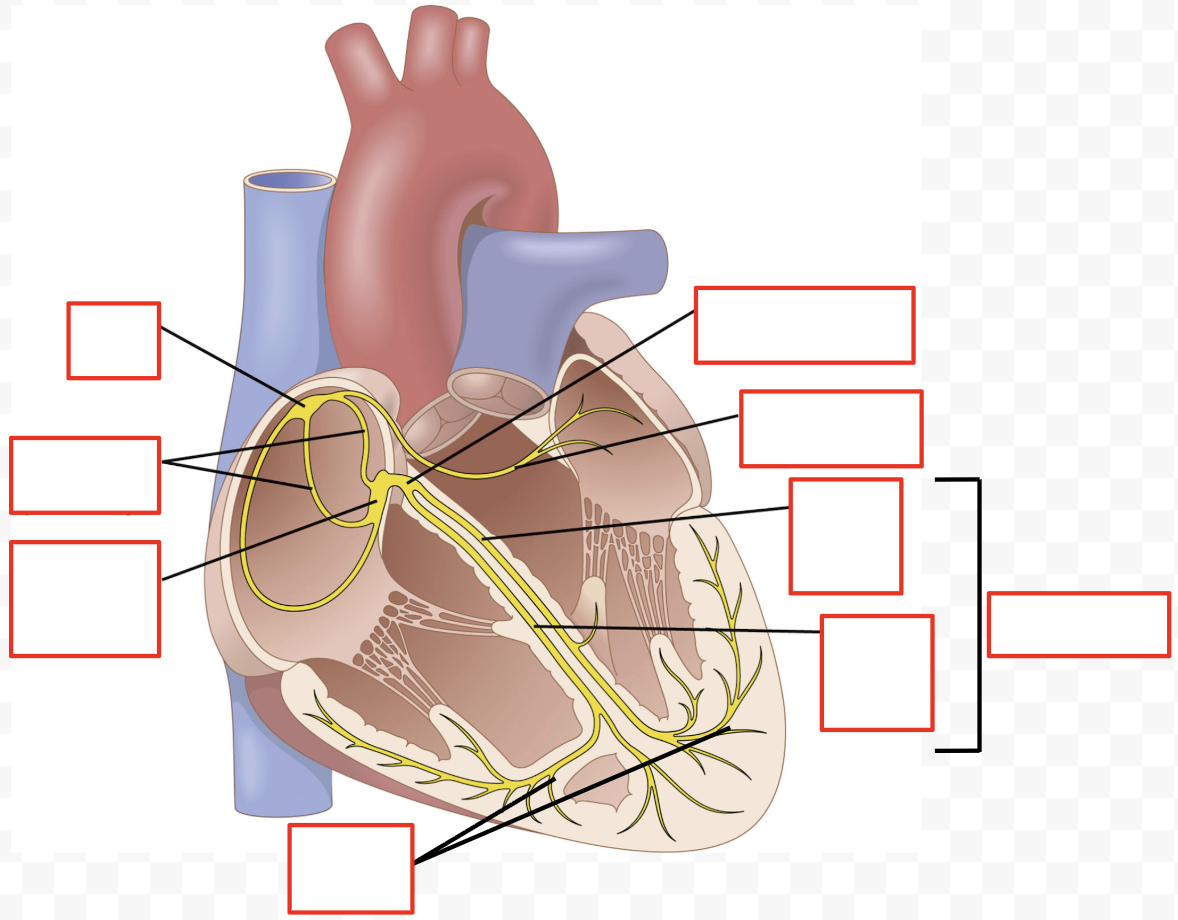
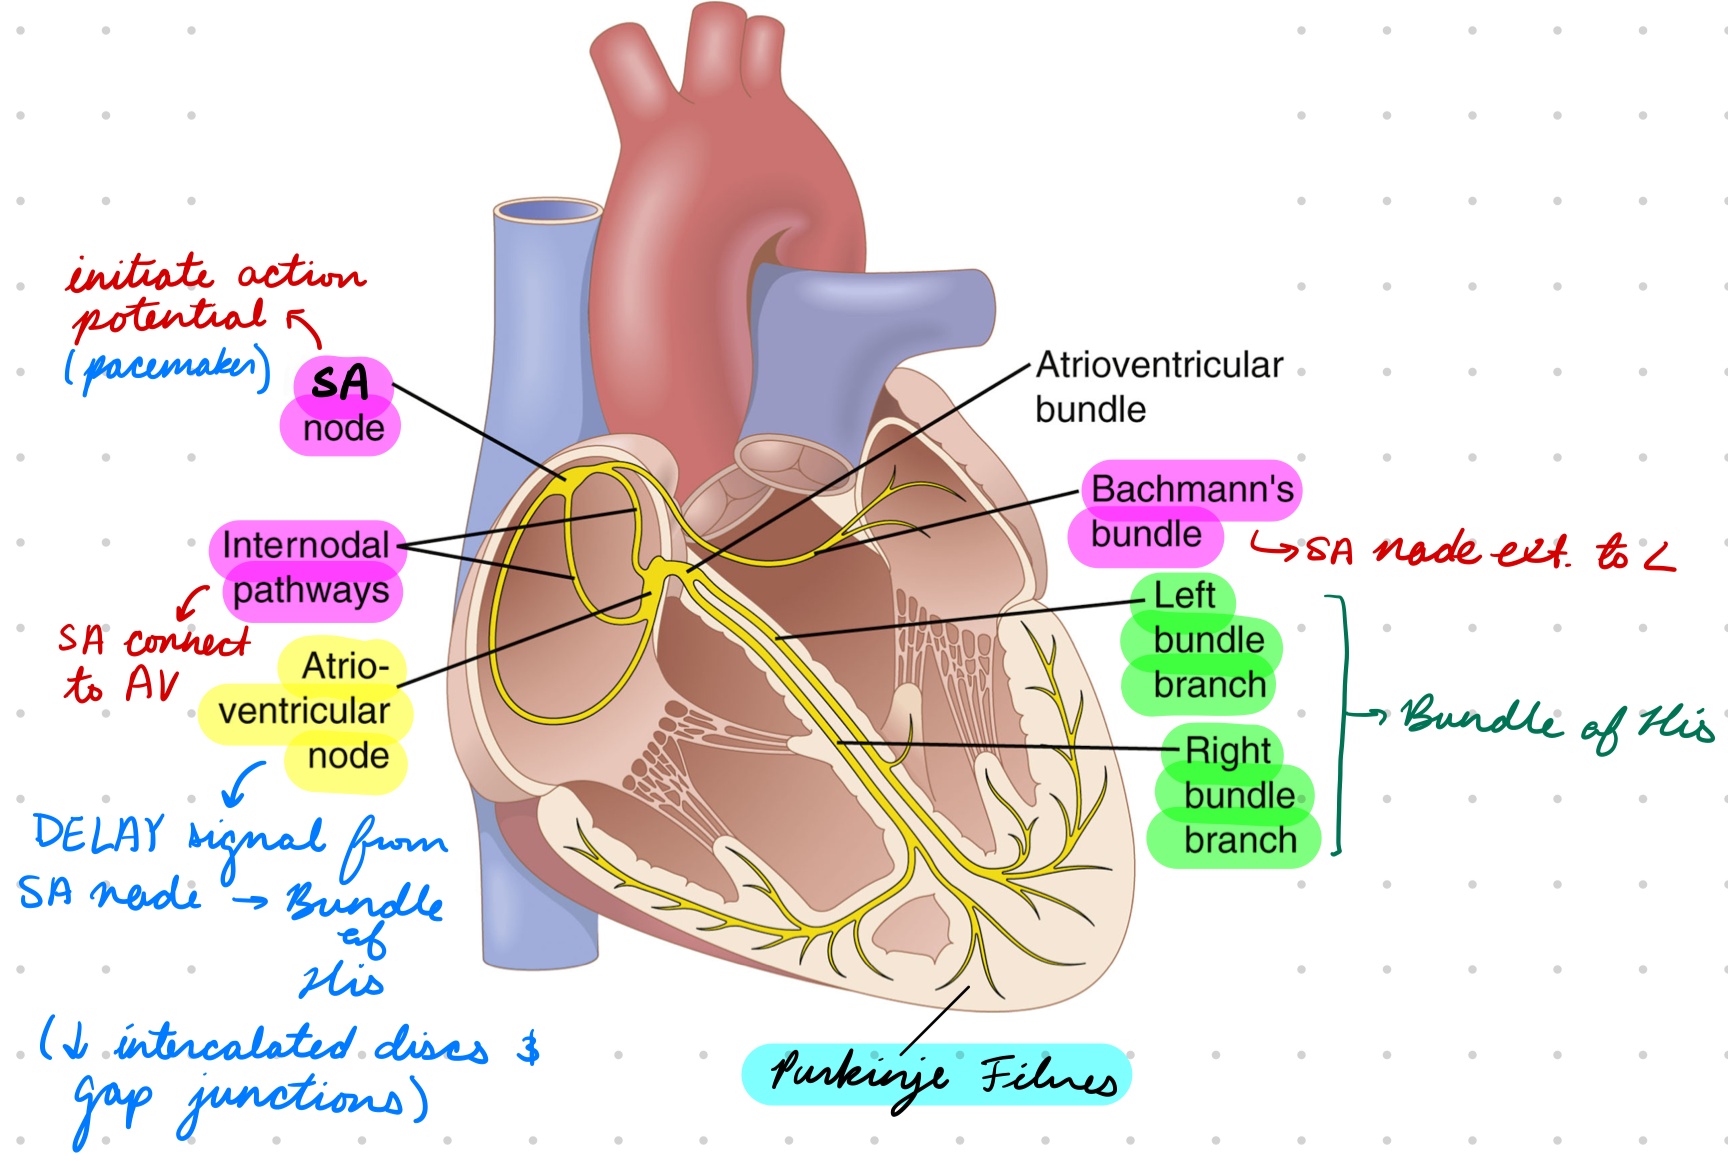
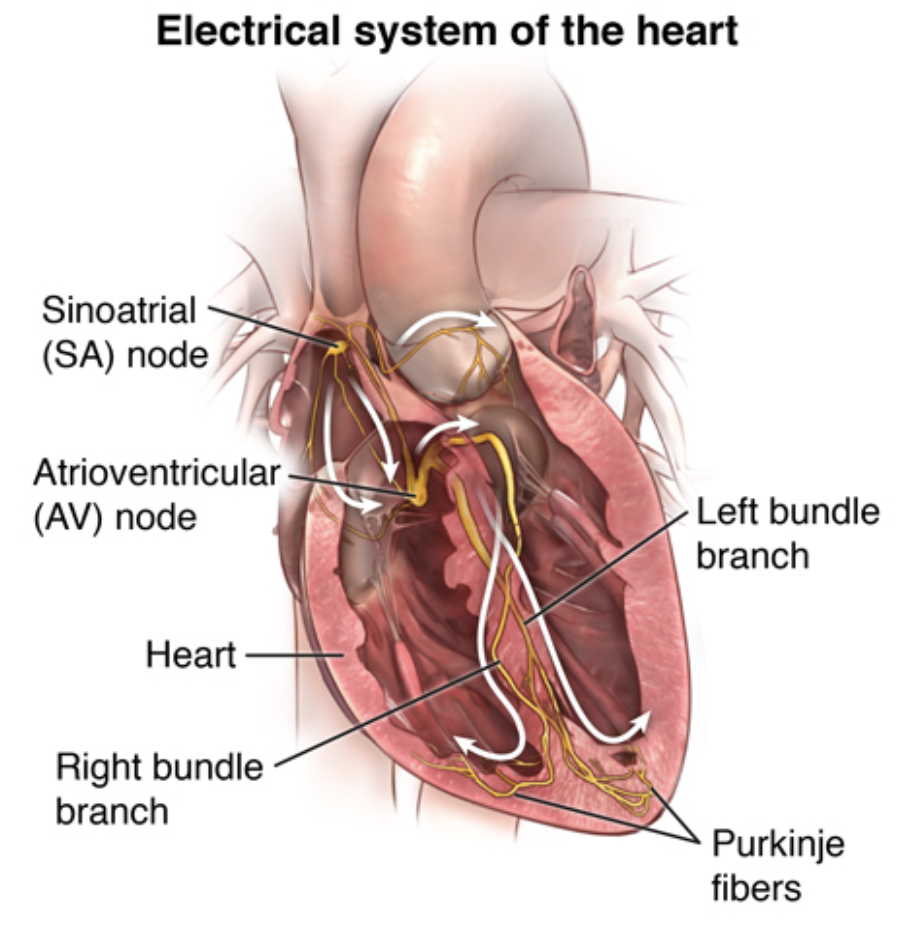
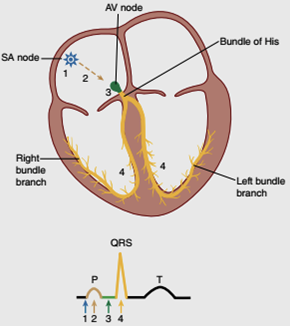
Cardiac Electrical Conduction System: Nodes
Specialized cardiac muscle cells for electrical conduction
Sinoatrial (SA) and atrioventricular (AV) nodes
SA Node
In right atrium
Near superior vena cava (SVC) opening
Bachmann Bundle: Extend to left side
Intranodal Fibres: Connect to AV node
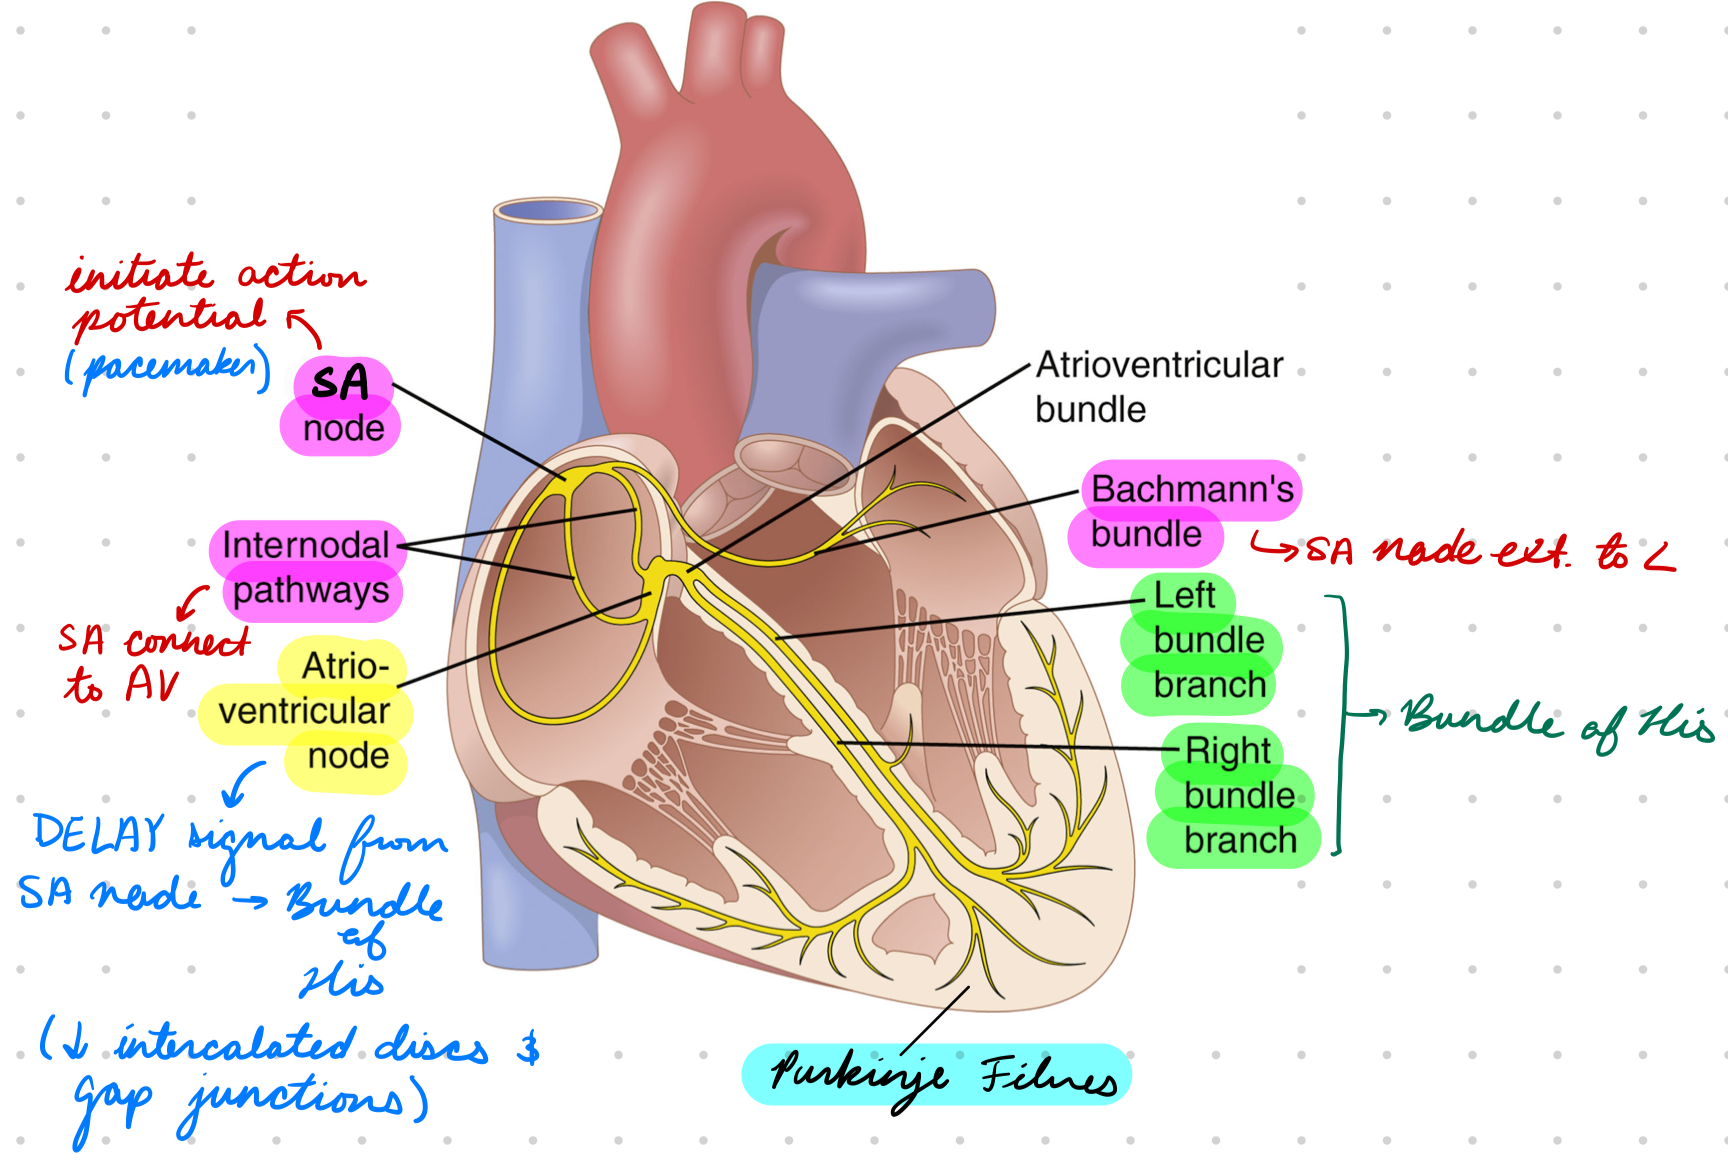
AV Node
In right atrium
Between coronary sinus and tricuspid valve
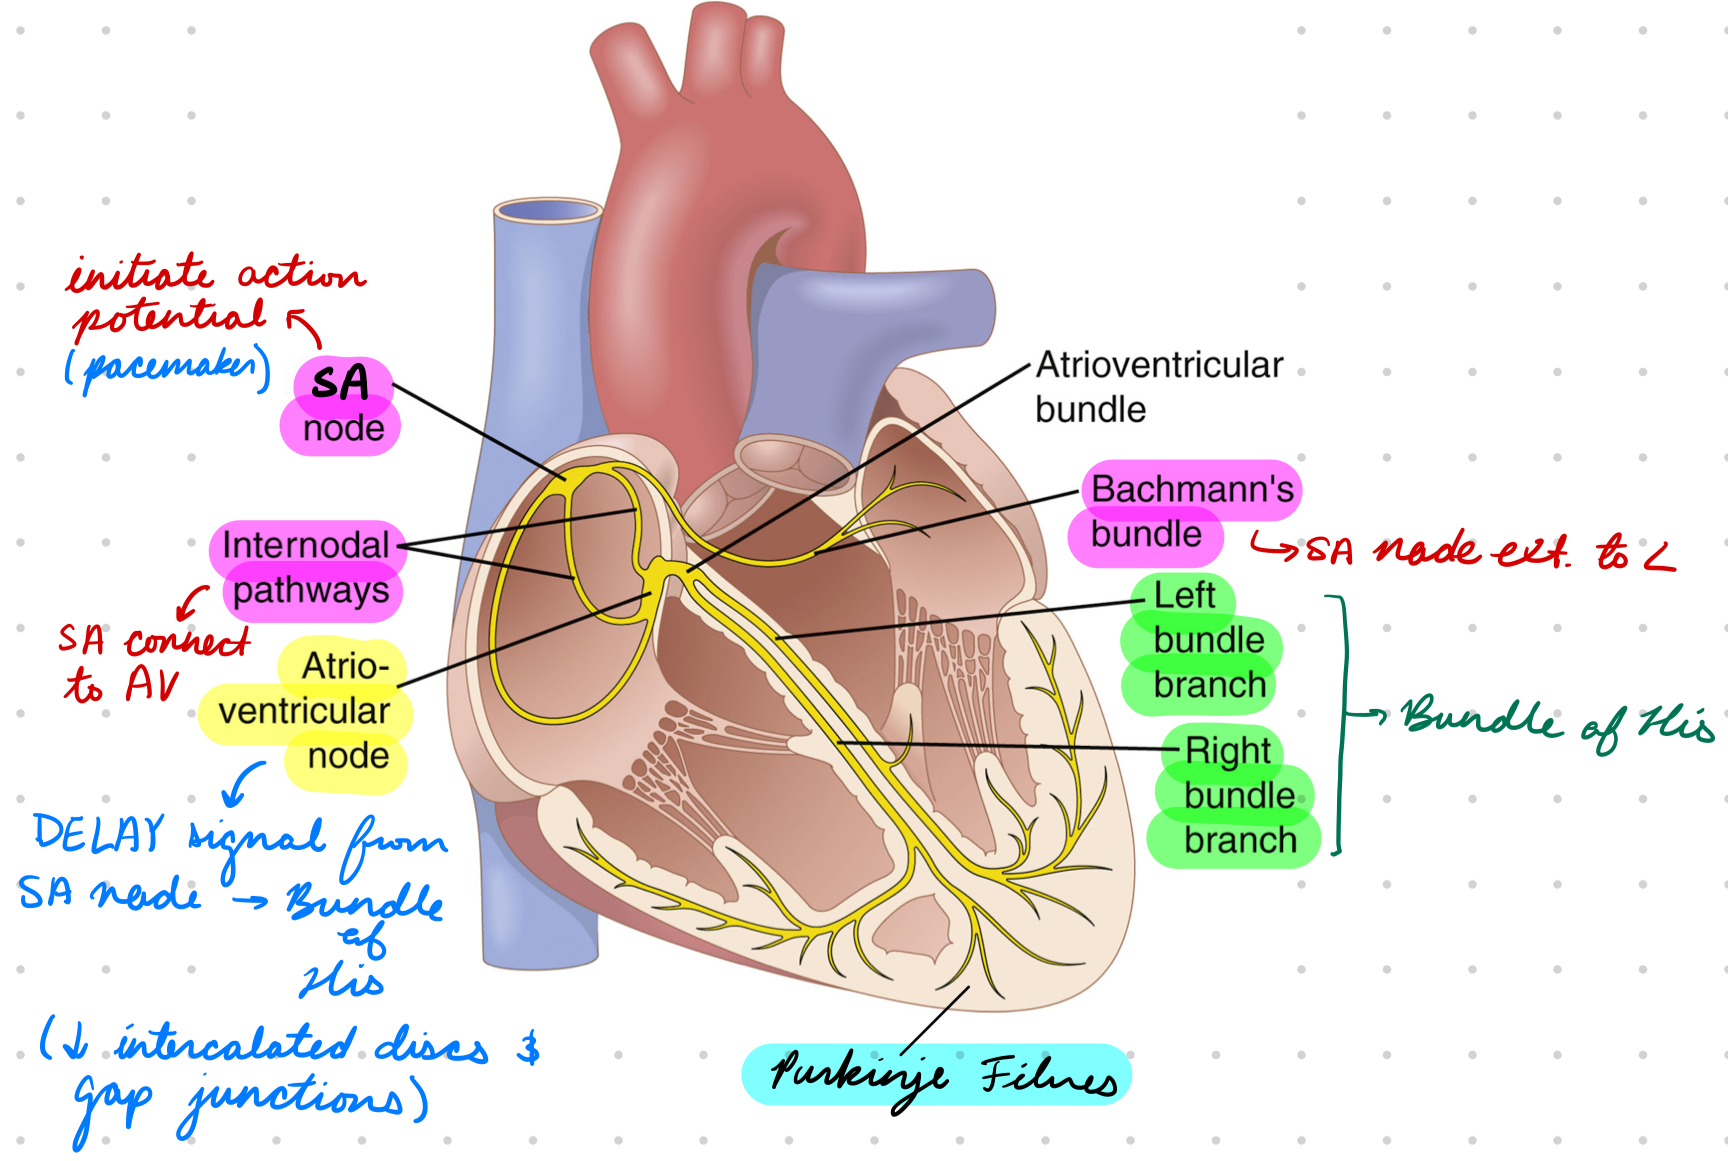
Cardiac Electrical Conduction System: Bundle of His
Down interventricular septum
Split into right and left bundle branches
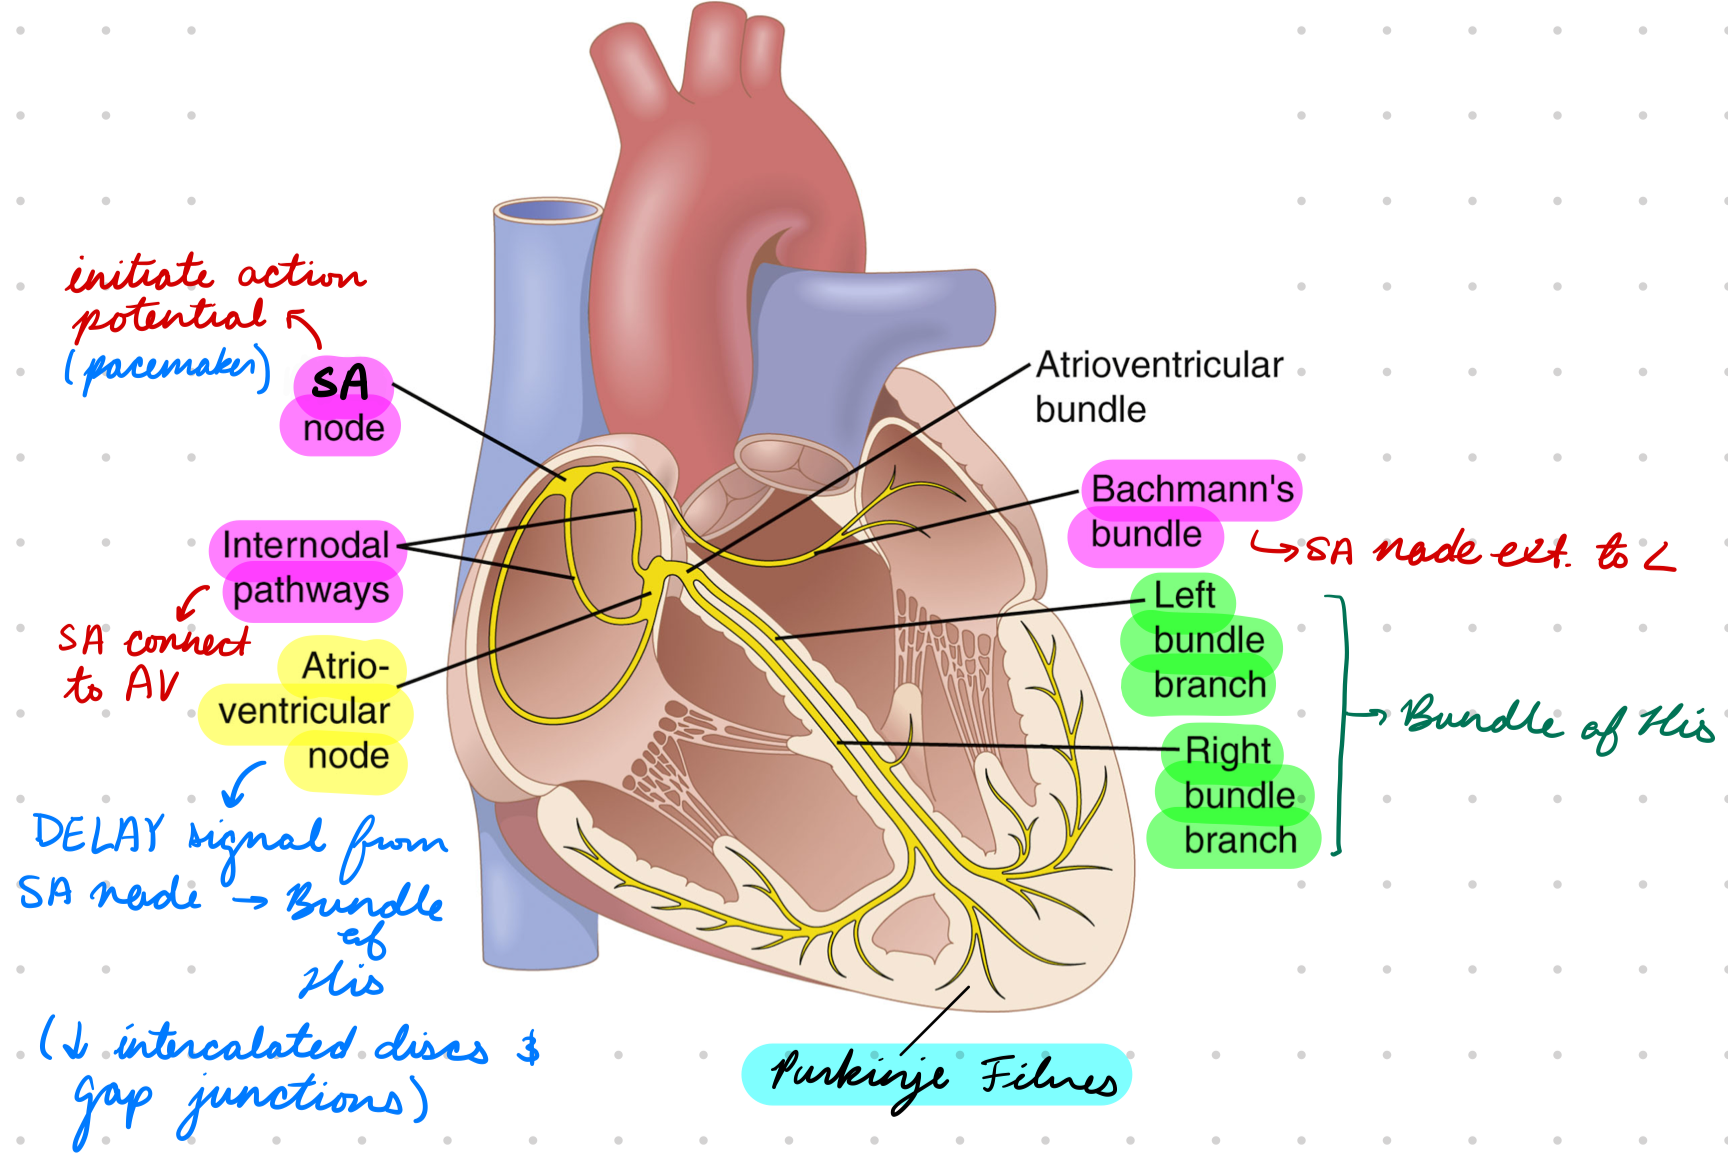
Cardiac Electrical Conduction System: Subendocardial (Purkinje) Fibres
In ventricles (subendocardial)
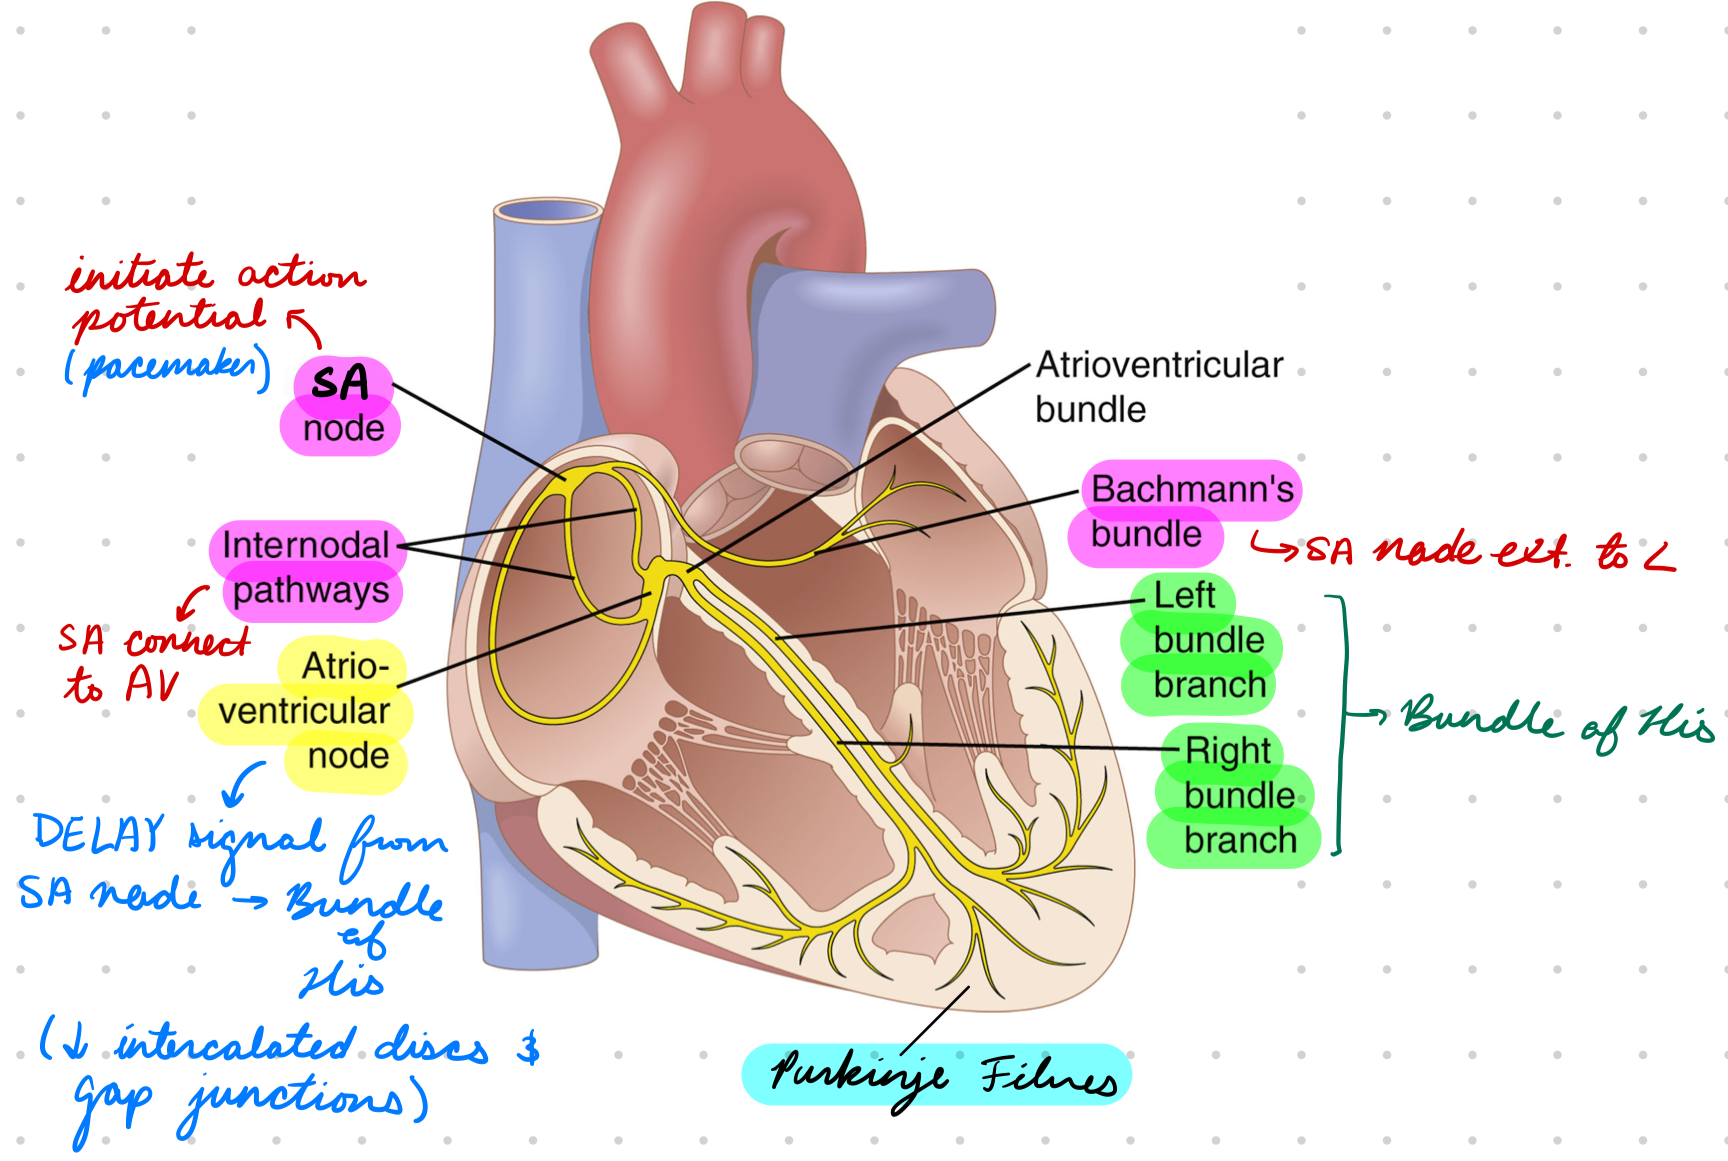
SA Node Physiology
Pacemaker
Initial action potential
For atrial contraction
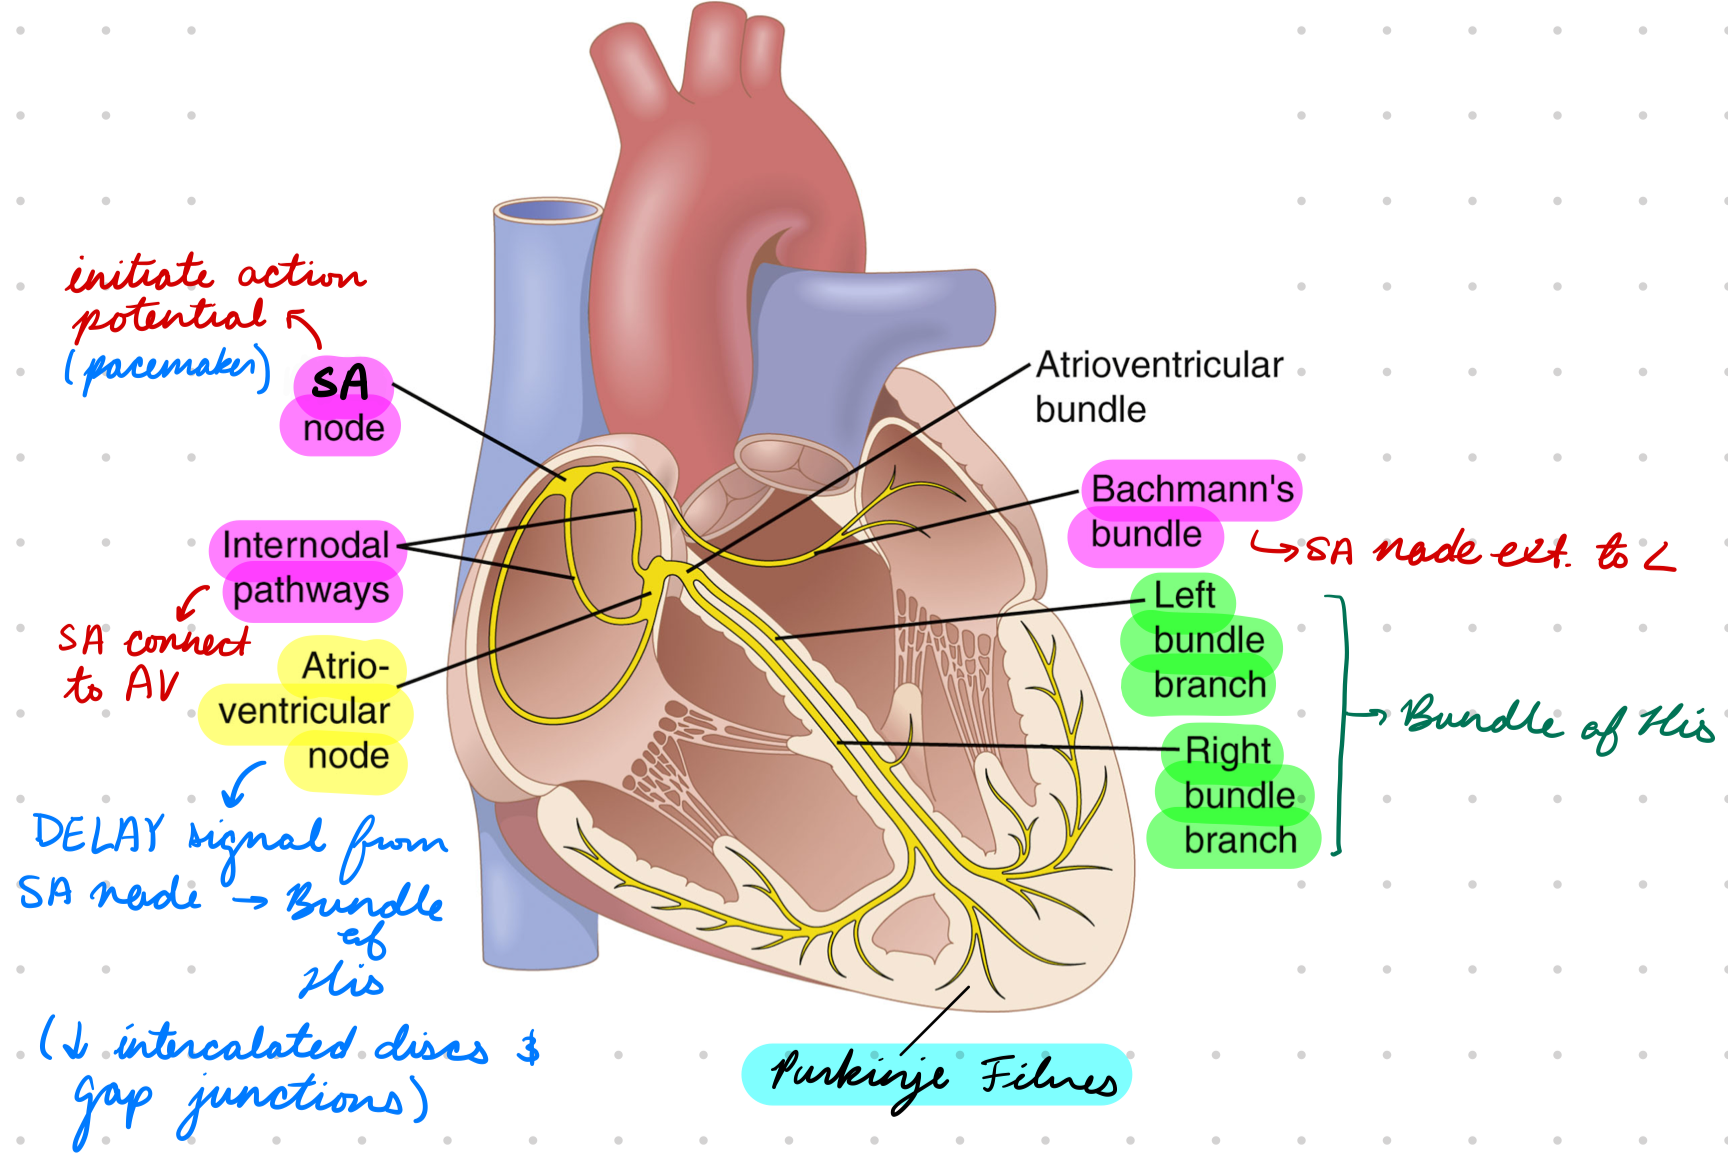
AV Node Physiology
Receive impulses from SA node
Delay signal conduction to bundle branches
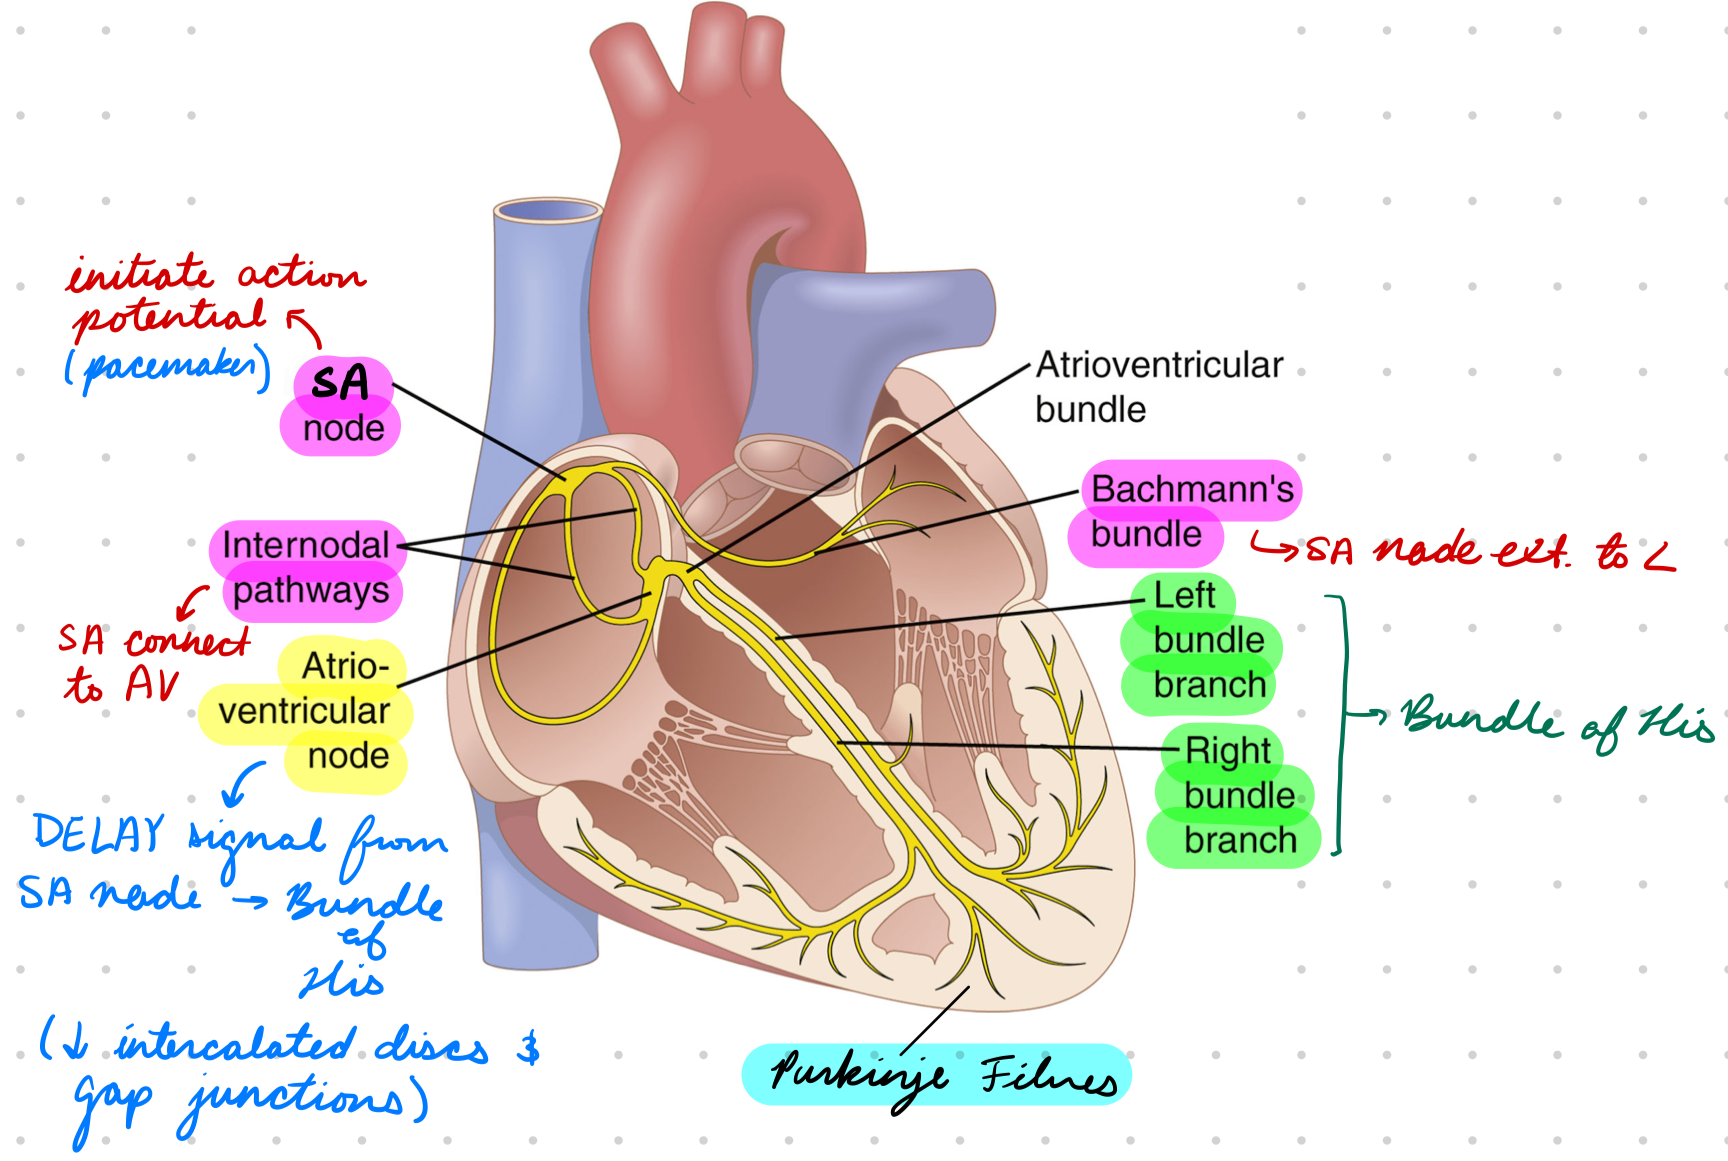
Bundle of His Physiology
Receive impulses from AV node
Conduct delayed electrical impulse from atria to ventricles
Less intercalated discs and gap junctions
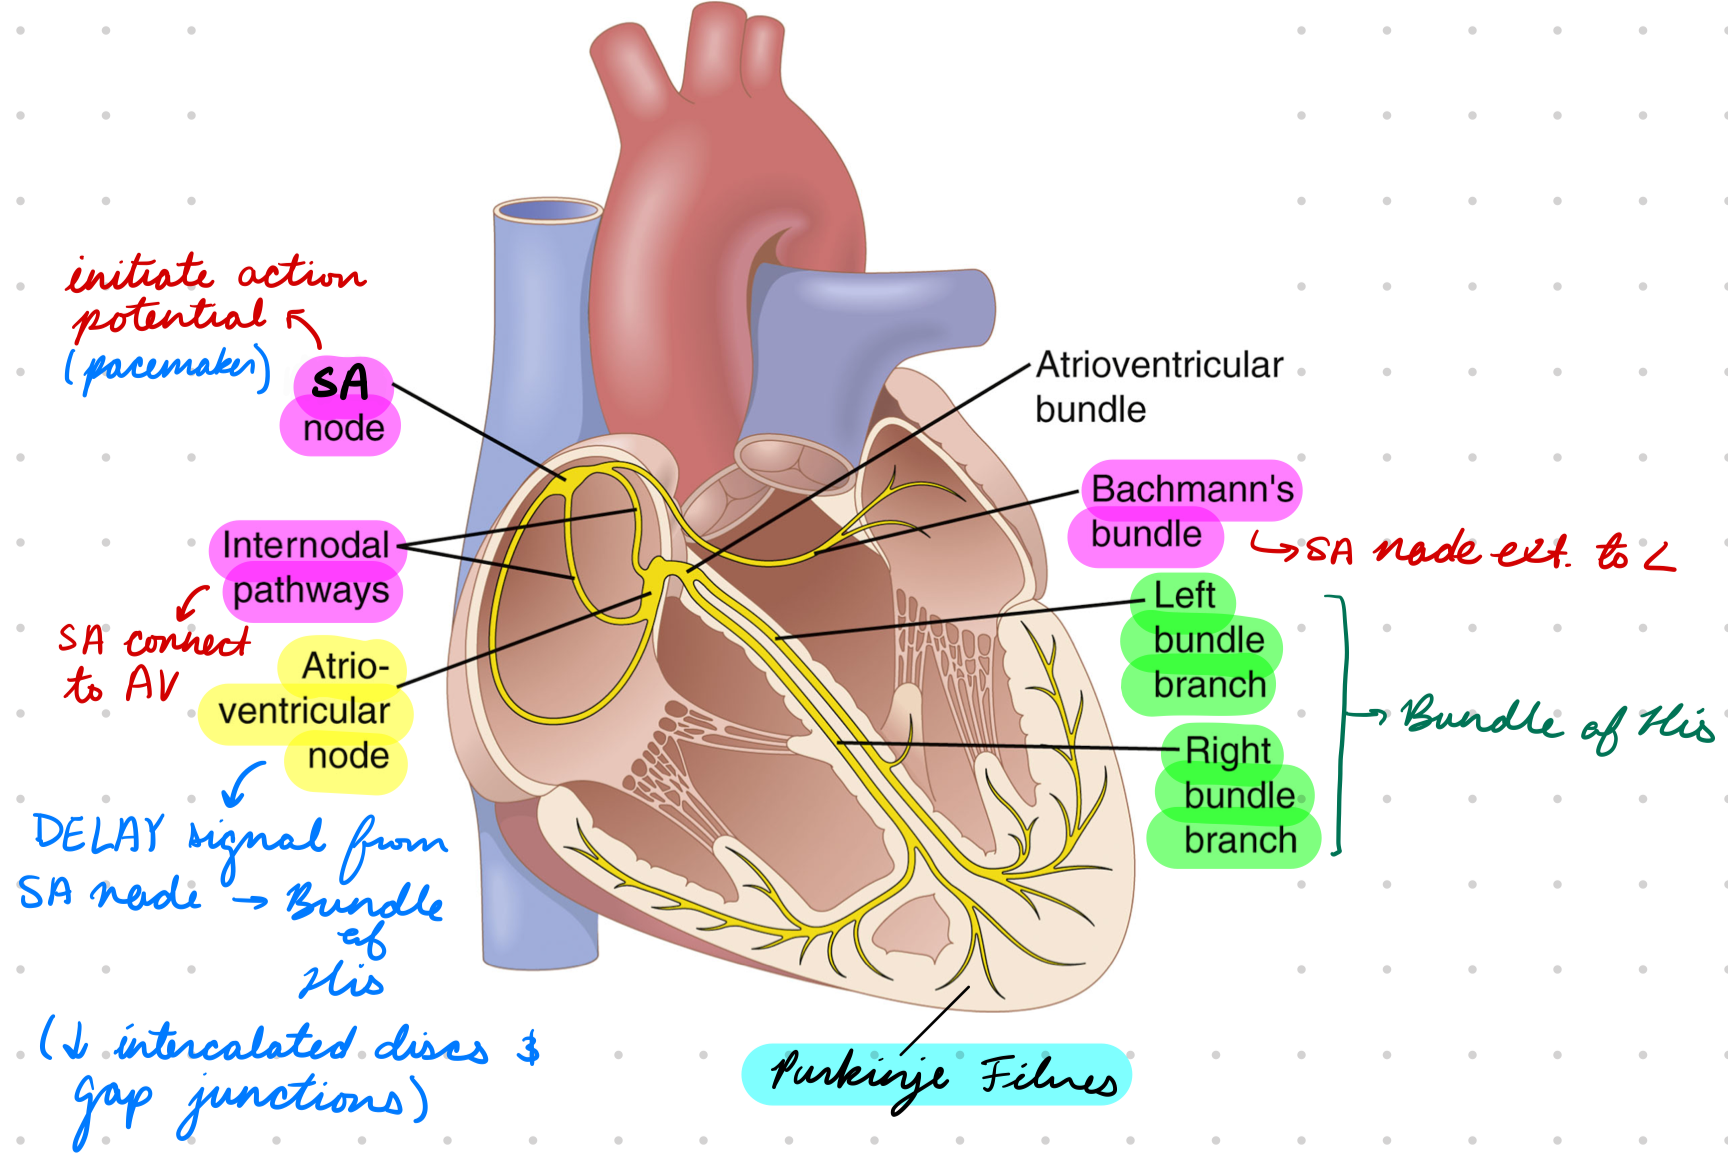
Purkinje Fibres Physiology
Conduct electrical impulse to ventricles for contraction
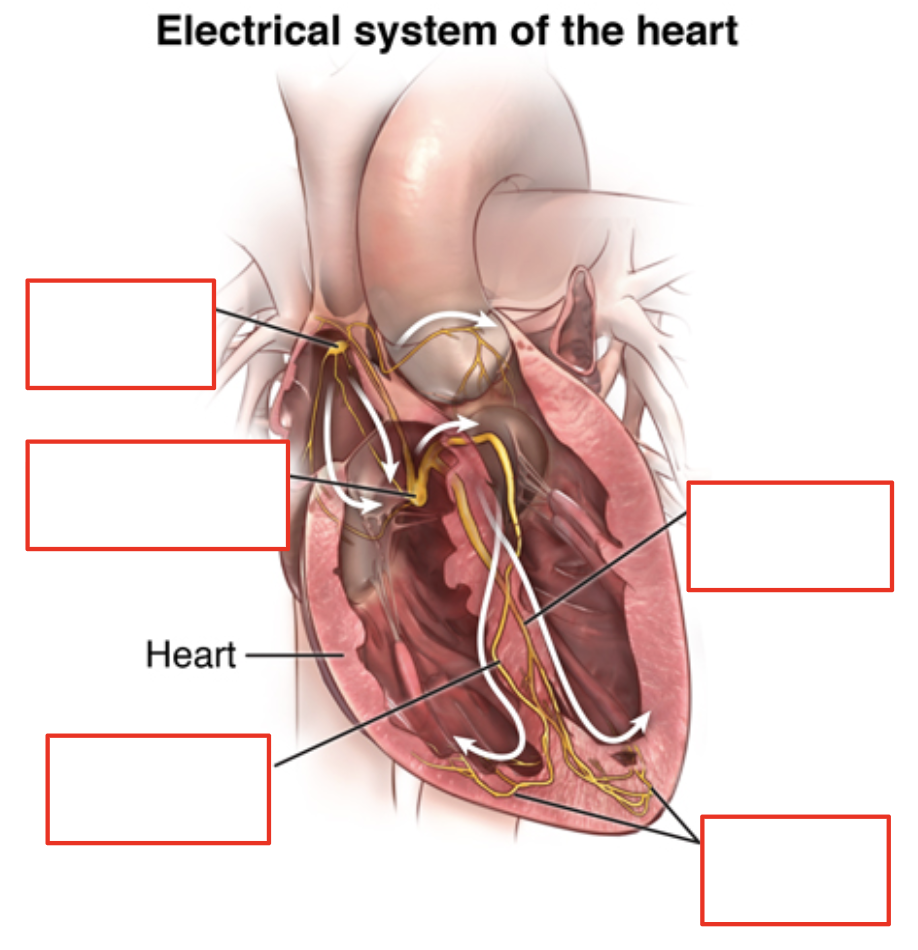
Electrical Circuit
SA node → AV node → Bundle of His → Purkinje fibres
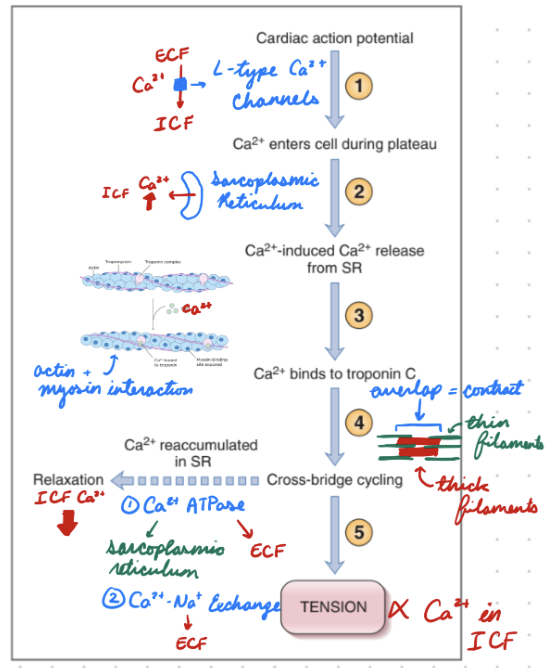
Excitation-Contraction Coupling
Electrical depolarization initiates muscle contraction (tension)
Cardiac action potential initiated in myocardial cell membrane
Ca2+ flow into cell through L-type Ca2+ channels (ECF → ICF)
Ca2+-induced Ca2+ release
Increased Ca2+ in cell triggers more Ca2+ release from sarcoplasmic reticulum
Plateau phase
Ca2+ bind troponin C
Move tropomyosin for myosin + actin cross-bridging
Cross-bridge cycling
Thin + thick filaments overlap = Tension
Continue until Ca2+ releases troponin C
Use ATP
Tension
Tension magnitude proportional to intracellular Ca2+ concentration
Increase Ca2+ = Increase contraction force
Ca2+ removal
Ca2+ ATPase:
Ca2+ back into sarcoplasmic reticulum
Remove plateau Ca2+ into ECF
Ca2+-Na+ Exchange:
Remove plateau Ca2+ into ECF
Ca2+ dissociates from troponin C = No actin-myosin interaction = Muscles relax
Cardiac Cycle Duration
Systole + diastole = 1/HR
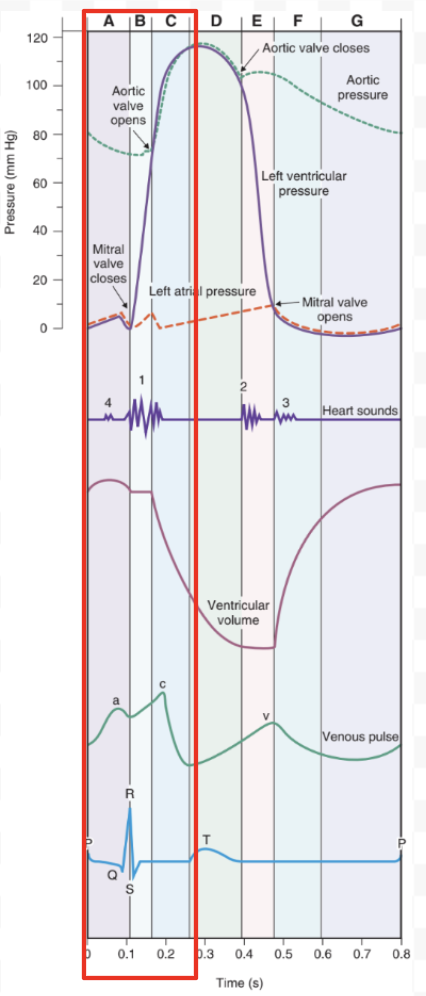
Cardiac Cycle: Systole
Heart contraction
Atrial Systole
Atrial depolarization
LA contracts = Increase pressure = Mitral valve opens
Large blood flow from LA → LV = Increase LV volume
Isovolumic Ventricular Contraction
LV depolarization
LV contracts = Increase pressure
(LV pressure > LA pressure = Mitral valve closes)Constant LV volume (closed valves)
Rapid Ventricular Ejection
LV continues contracting = Increase pressure
(LV pressure > Aortic pressure = Aortic valve opens)Blood enters aorta = Increase aortic volume + pressure
Decrease LV volume
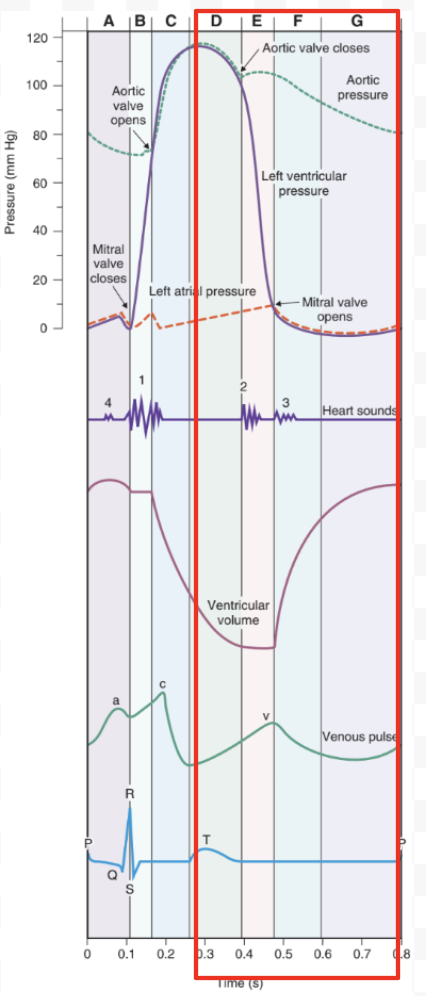
Cardiac Cycle: Diastole
Reduced Ventricular Ejection
LV repolarize (no contraction)
Decrease LV pressure = Decrease blood flow rate
(Aortic valve open)Decrease aortic pressure
LA pressure increases from blood return
Isovolumic Ventricular Relaxation
LV finishes repolarizing
Relaxed LV = Decrease LV pressure
(LV pressure < Aortic pressure = Aortic valve closes)
Rapid Ventricular Filling
LV pressure < LA pressure = Mitral valve opens
LA blood into LV = Increase LV volume
Reduced Ventricular Filling (Diastasis)
Slow LV filling
(Until end-diastolic volume)Atrial systole (cycle starts again)
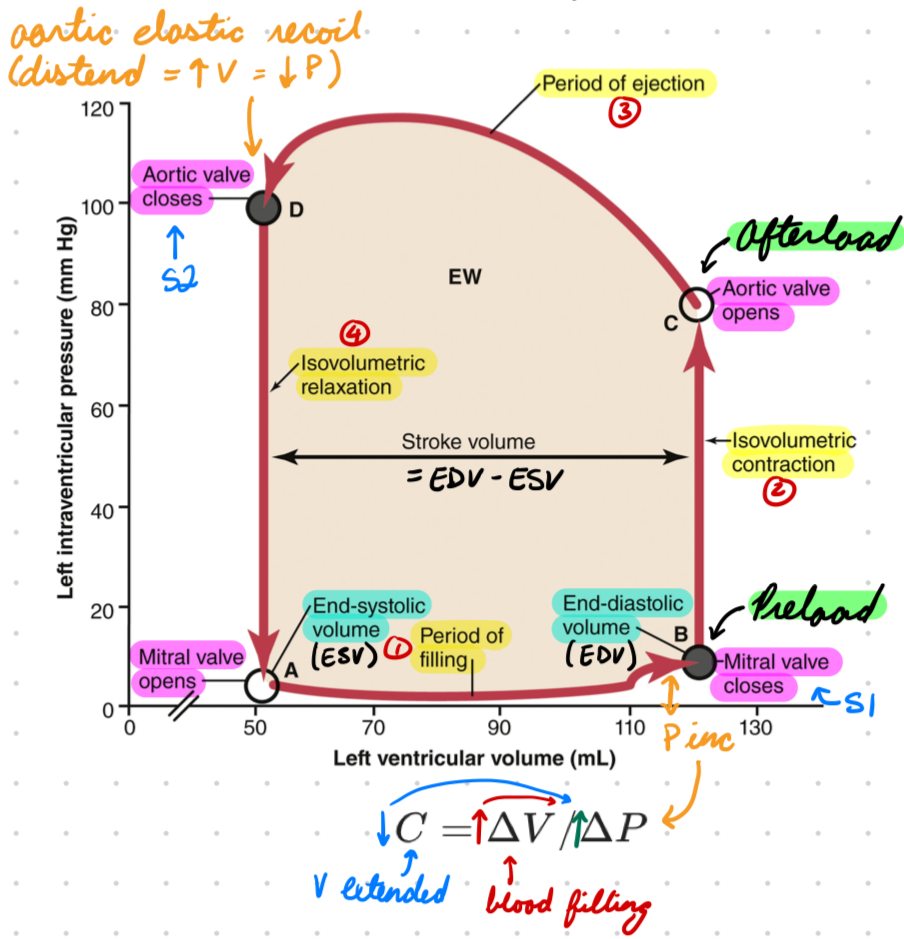
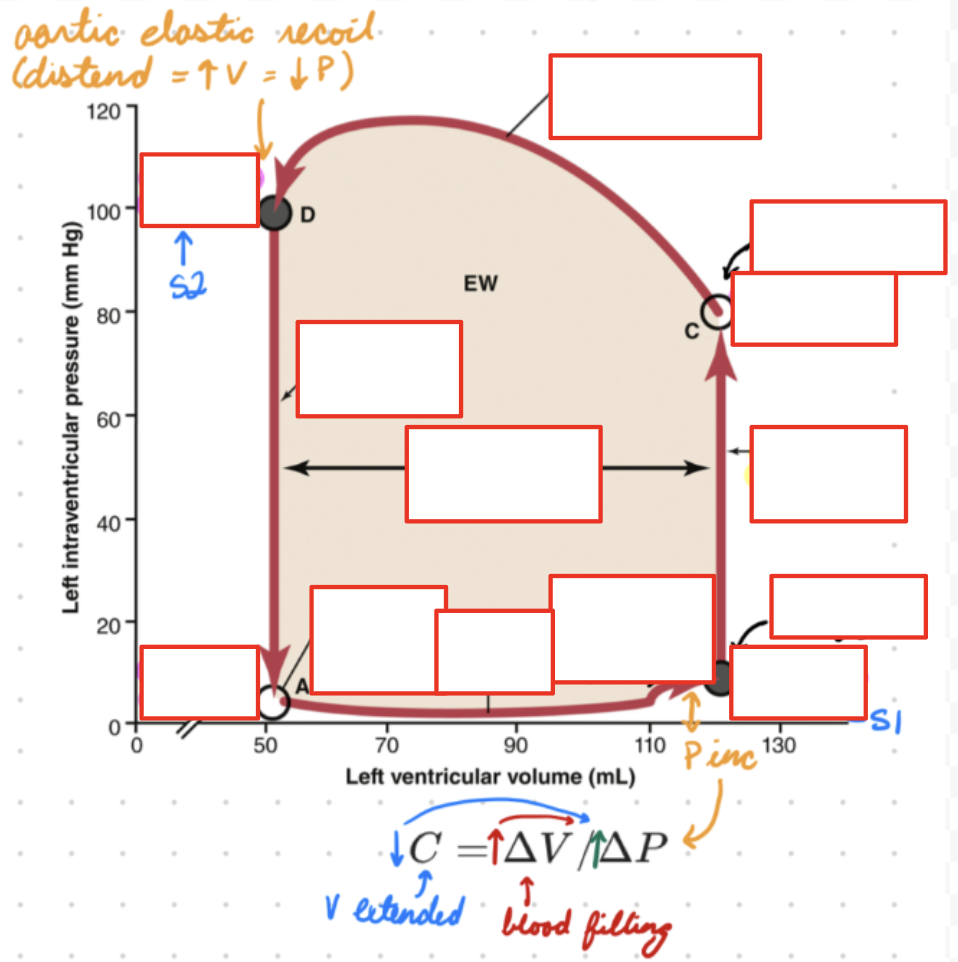
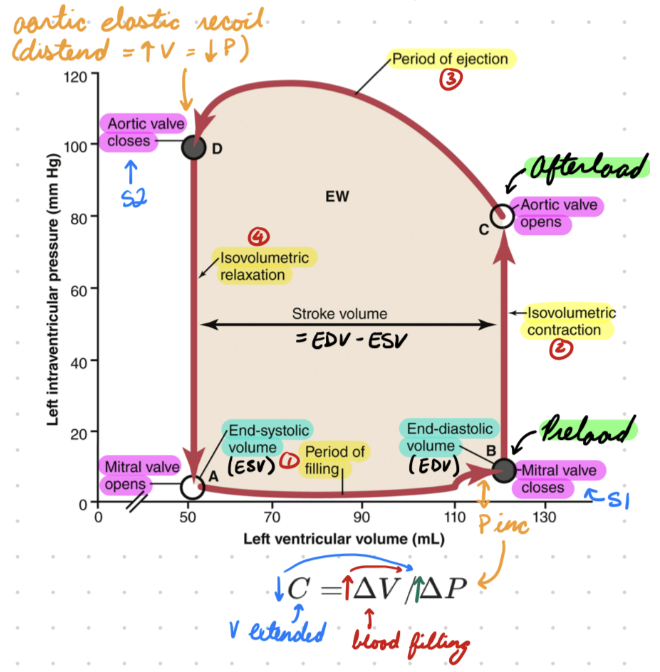
Pressure-Volume Loop
Relationship between LV volume and pressure during diastole and systole
Diastolic filling
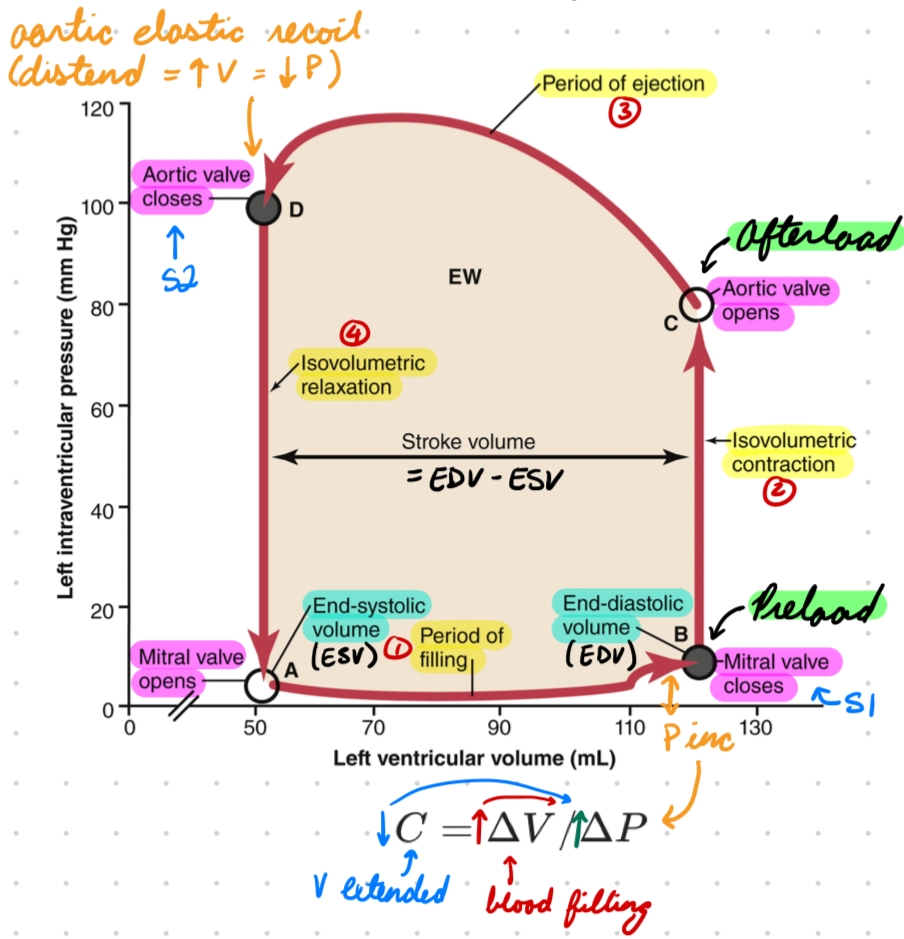
Isovolumic contraction
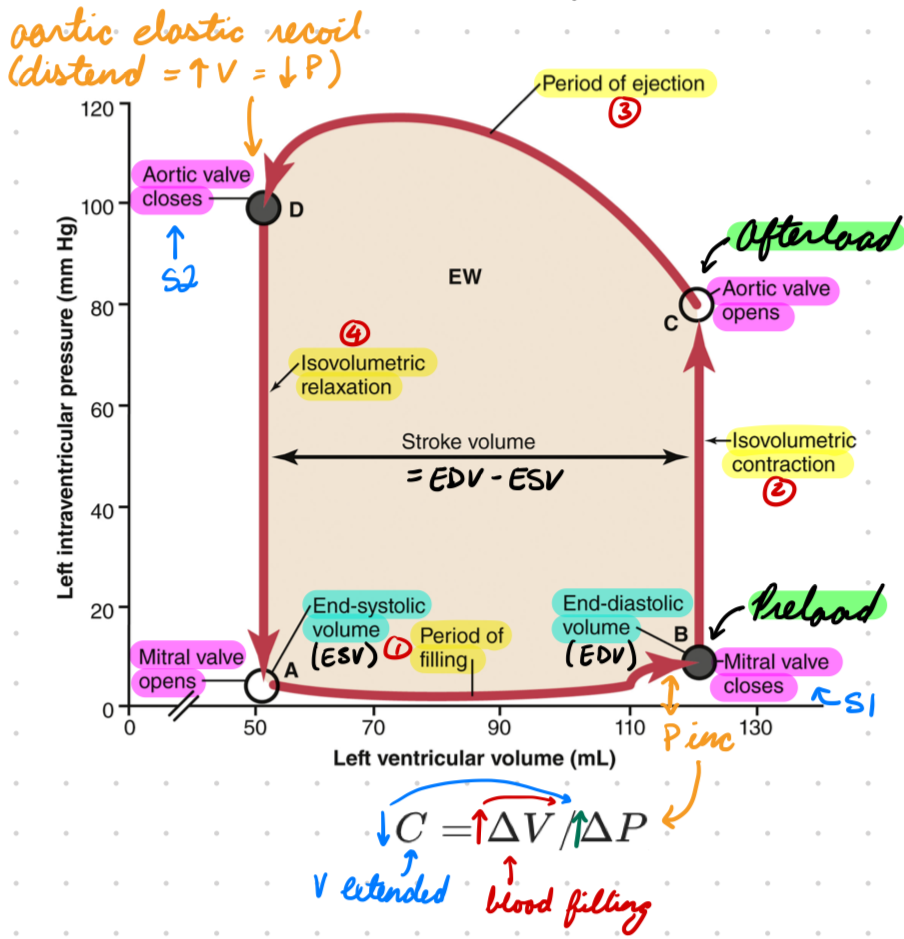
Period of ejection
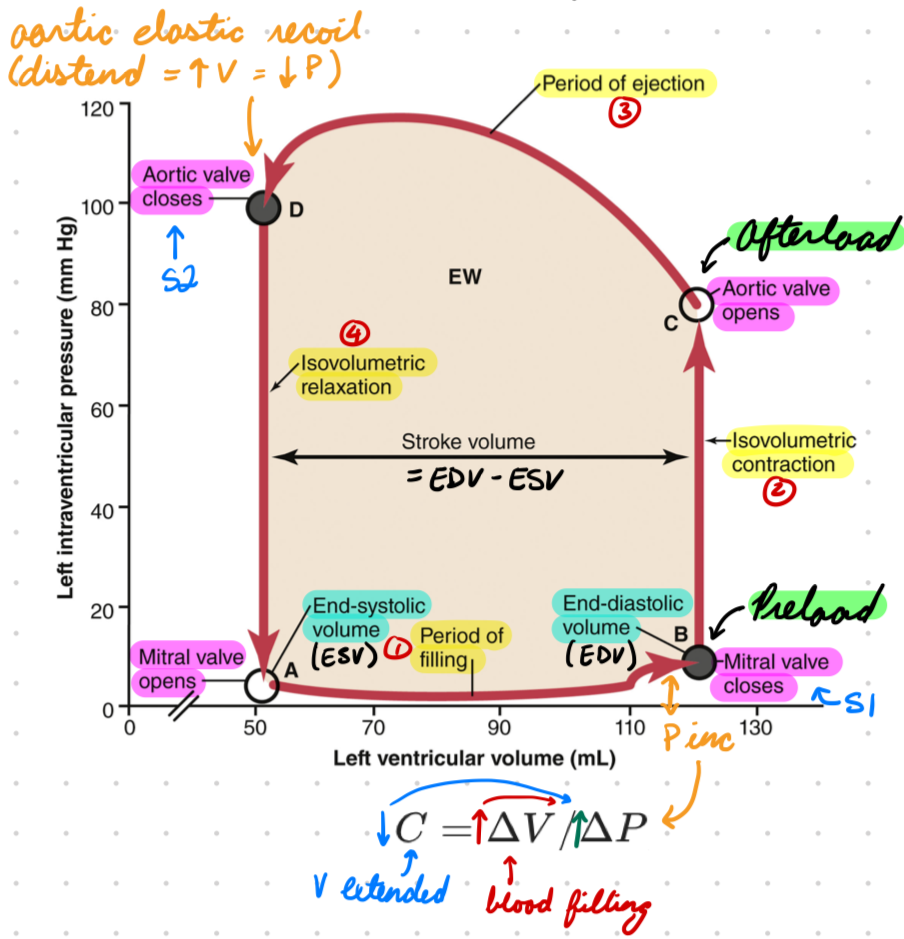
Isovolumic relaxation
PV Loop Phase 1: Diastolic Filling
Mitral valve open
Passive LV filling
Volume: Increase
AV valves open
End-Systolic Volume (ESV): Blood left from previous heartbeat (50mL)
End-Diastolic Volume (EDV, Preload): Blood entering LV from LA (120 mL)
Pressure: Low
2-3 mmHg
Small increase from decreased compliance and increased volume (5-7 mmHg)
Increased pressure
PV Loop Phase 2: Isovolumic Contraction
LV pressure > LA pressure = Mitral valve closes
LV begins contraction
Volume: No change
Valves closed
Pressure: Increase
LV contraction increase pressure to = Aortic pressure (afterload) (80 mmHg)
PV Loop Phase 3: Period of Ejection
LV pressure > Aortic pressure = Aortic valve opens
LV contraction forces blood into aorta (high pressure)
Volume: Decrease
Aortic valve open = Blood from from LV → Aorta (distension)
Pressure: Increase
LV contraction
Small decrease from rapid myocyte shortening + aortic elastic recoil
PV Loop Phase 4: Isovolumic Relaxation
LV pressure < Aortic pressure = Aortic valve closes
LV begins relaxation
Volume: No change
Valves closed (50 mL)
Pressure: Decrease
LV relax (2-3 mmHg)
Heart Sounds
From valves closing
S1-4
Sound 1
“Lub”
AV valves closing
Beginning of systole
Sound 2
“Dub”
SL valves closing
End of systole
Sound 3
Weak
Blood flow from atria → stiff ventricles
Middle of diastole (AV valves open)
Ken-tuc-key
S1-S2-S3
Sound 4
Weak
Atrial contraction
Forced atrial contraction from decreased ventricular compliance and increased resistance (stiff/hypertrophic ventricle)
End of diastole
Ten-nes-see
S4-S1-S2
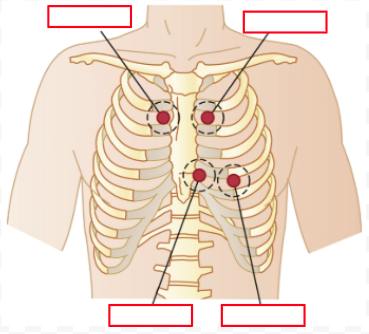
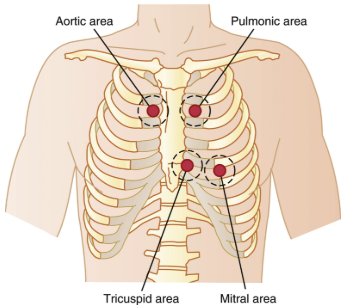
Cardiac Auscultation
Listening for valve sounds
Not directly on valves
Move stethoscope to differentiate sounds (closer → louder)
S1: AV Valves
Mitral: Left 5th intercostal space (lateral)
Tricuspid: Left 4/5th intercostal space
S2: SL Valves
Aortic: Right 2nd intercostal space
Pulmonic: Left 2nd intercostal space
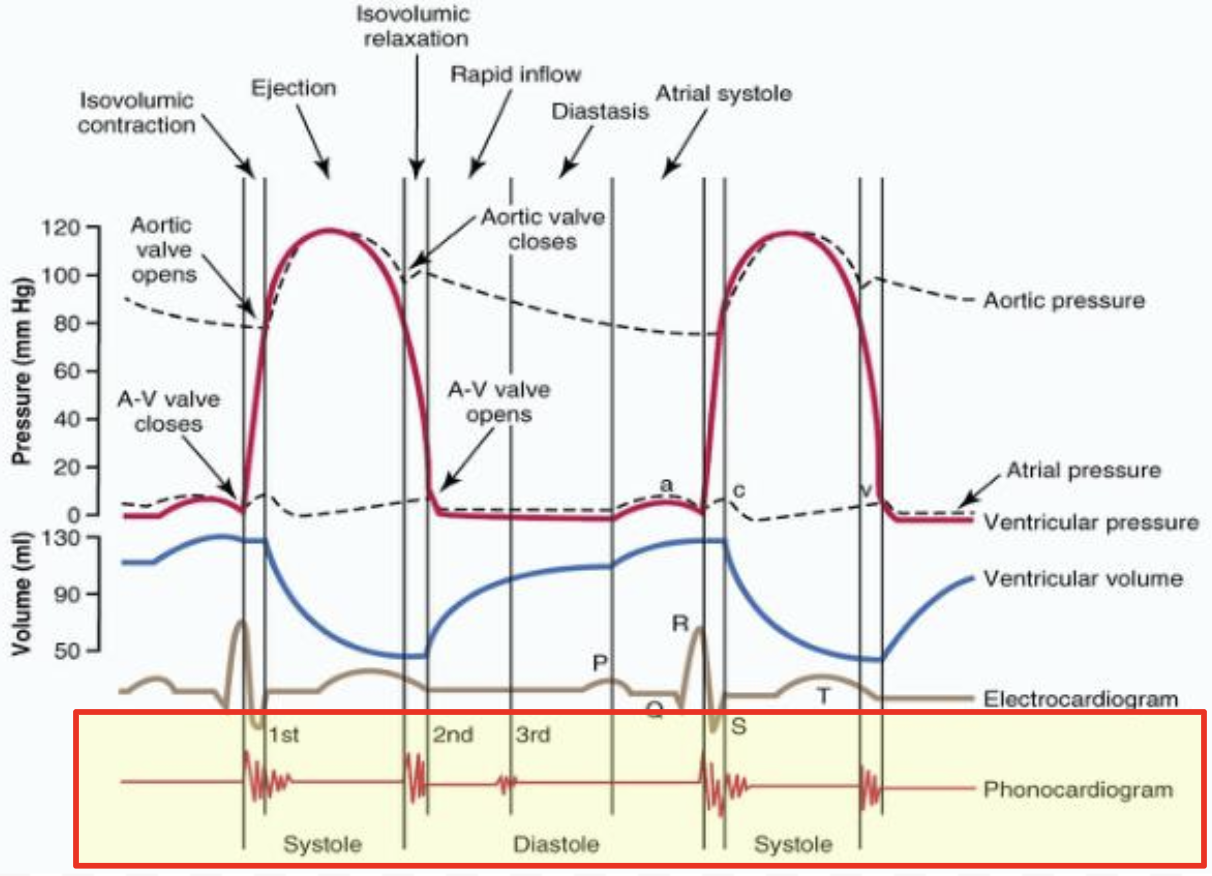
Wiggers Diagram
Pressure and volumes in left heart during cardiac cycle
Wiggers Diagram: Atrial Pressure
a wave: Atrial contraction = Increase pressure
Left > Right
c wave: Ventricular contraction = Increase pressure pushing into atria
Blood back flow + AV valve bulging into atria
v wave: Venous blood → Atria
Closed AV valves
End of ventricular contraction
AV valves open = Atrial blood → Ventricle = v wave ends
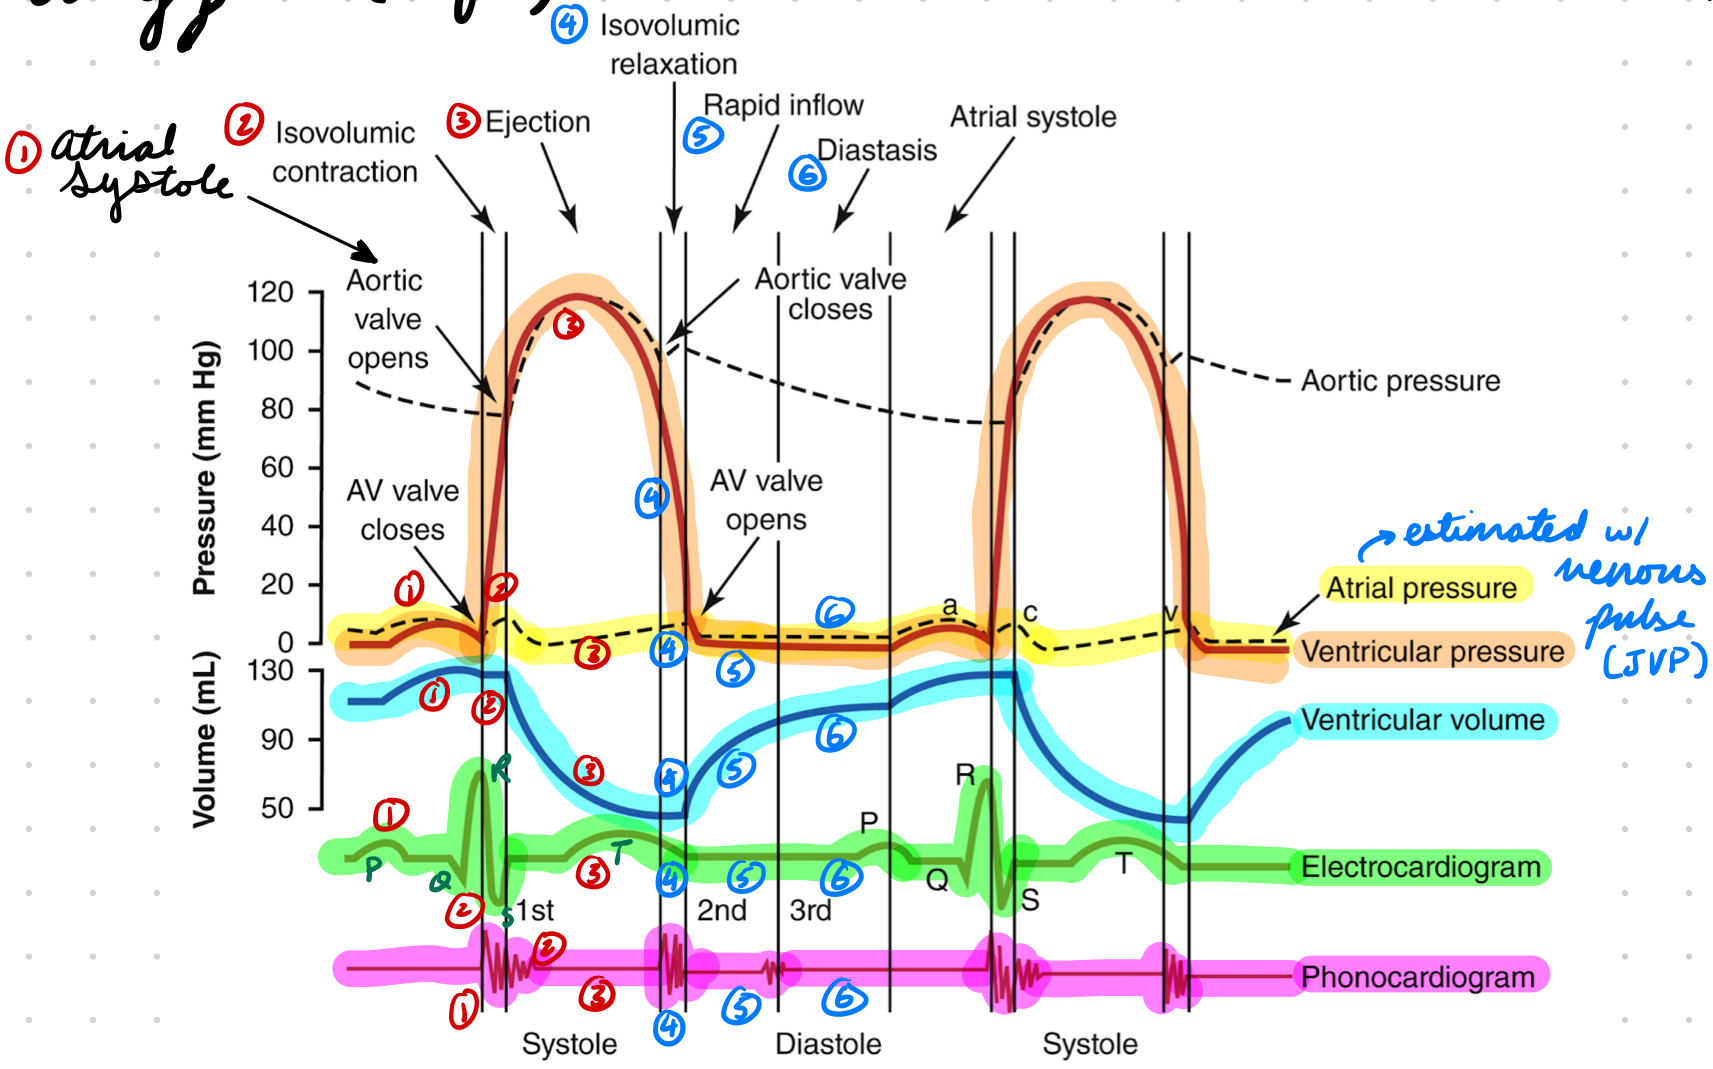
Wiggers Diagram: Venous Pulse
JVP
Good estimate of atrial pressure (noninvasive)
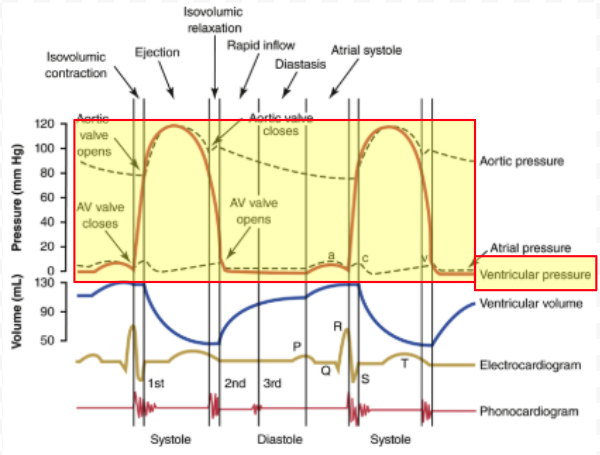
Wiggers Diagram: Ventricular Pressure
Large Increasing Curve:
Beginning of systole = Increase pressure
AV valves close
Middle of systole = Increased pressure opens aortic valve
Blood ejection
End of systole = Decreasing pressure
Aortic valve closes
Flat Portion:
Diastole = Open AV valves = Passive blood flow into ventricle
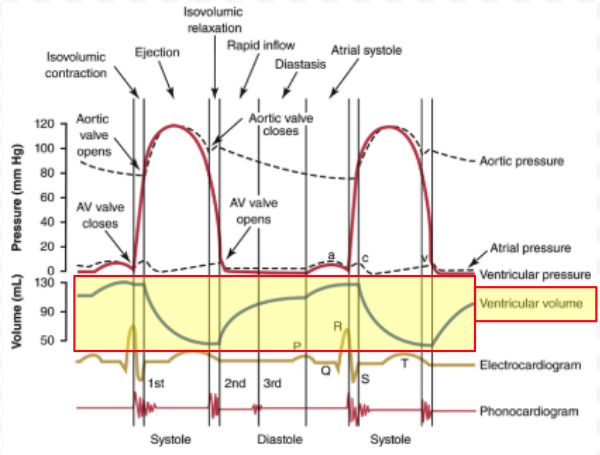
Wiggers Diagram: Ventricular Volume
Increasing Curve:
Diastole = Open AV valves = Blood fills ventricle
Diastole end = Slower blood flow into ventricle (small increase)
Decreasing Curve:
Systole = Open aortic valve = Blood from ventricle → Aorta
Diastole closes aortic valve
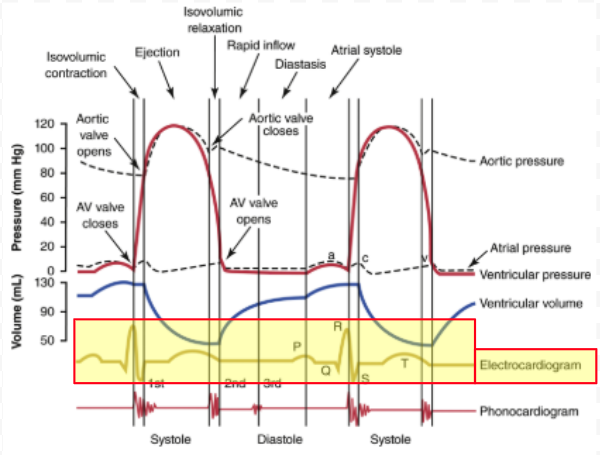
Wiggers Diagram: ECG
Measure electrical voltages from heart → Body surface
P wave
QRS wave
T wave
ECG: P Wave
Atrial depolarization
SA node initiate action potential
SA node conduct electric signal to AV node (delay)
Atrial contraction
ECG: QRS Wave
Ventricular depolarization
Electric signal sent down Bundle of His and Purkinje fibres
Q: Left to right bundle branch conduction
R: Purkinje fibres send signals outwards
S: Before start of ventricular systole
ECG: T Wave
Ventricular repolarization
Muscles relax
Ventricular systole → Diastole
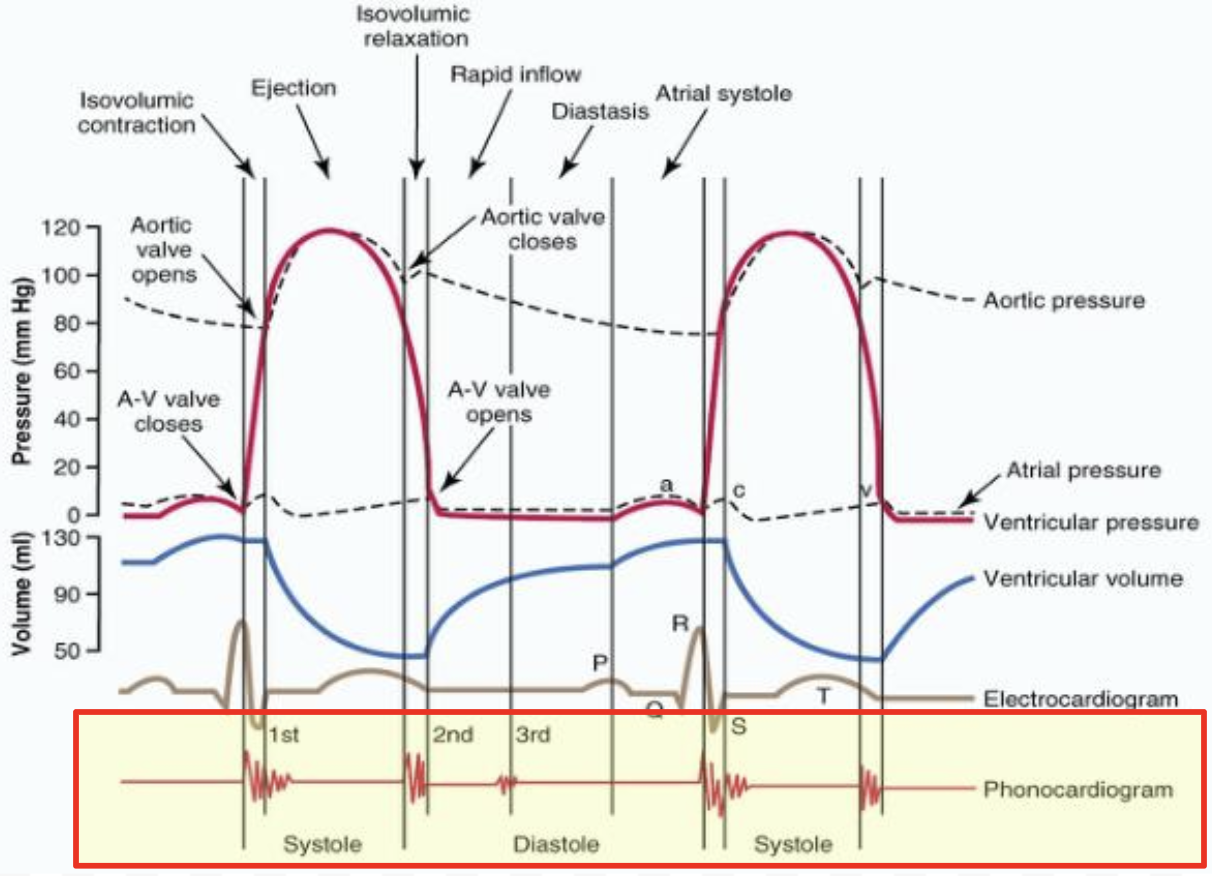
Phonocardiogram: S1
AV valves closing
Beginning of systole
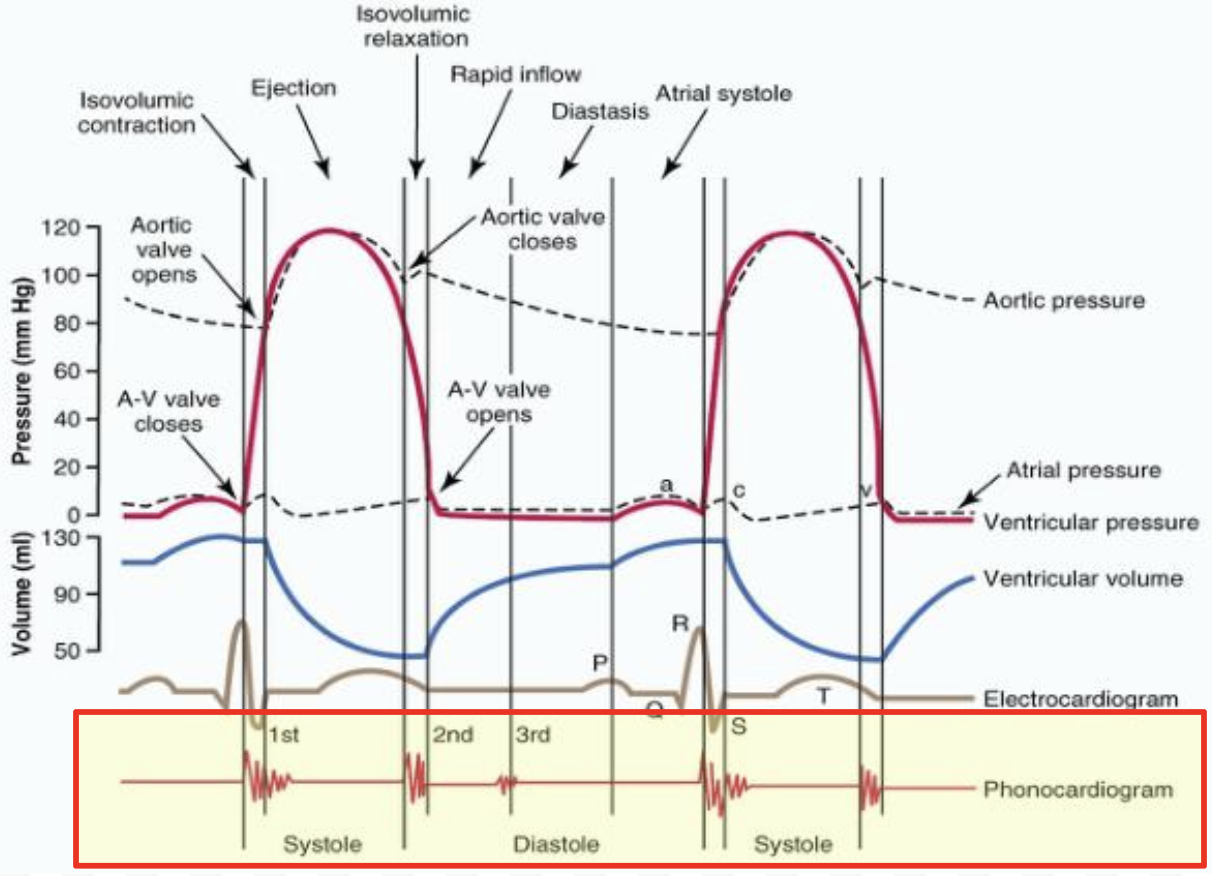
Phonocardiogram: S2
Semilunar valves closing
End of systole
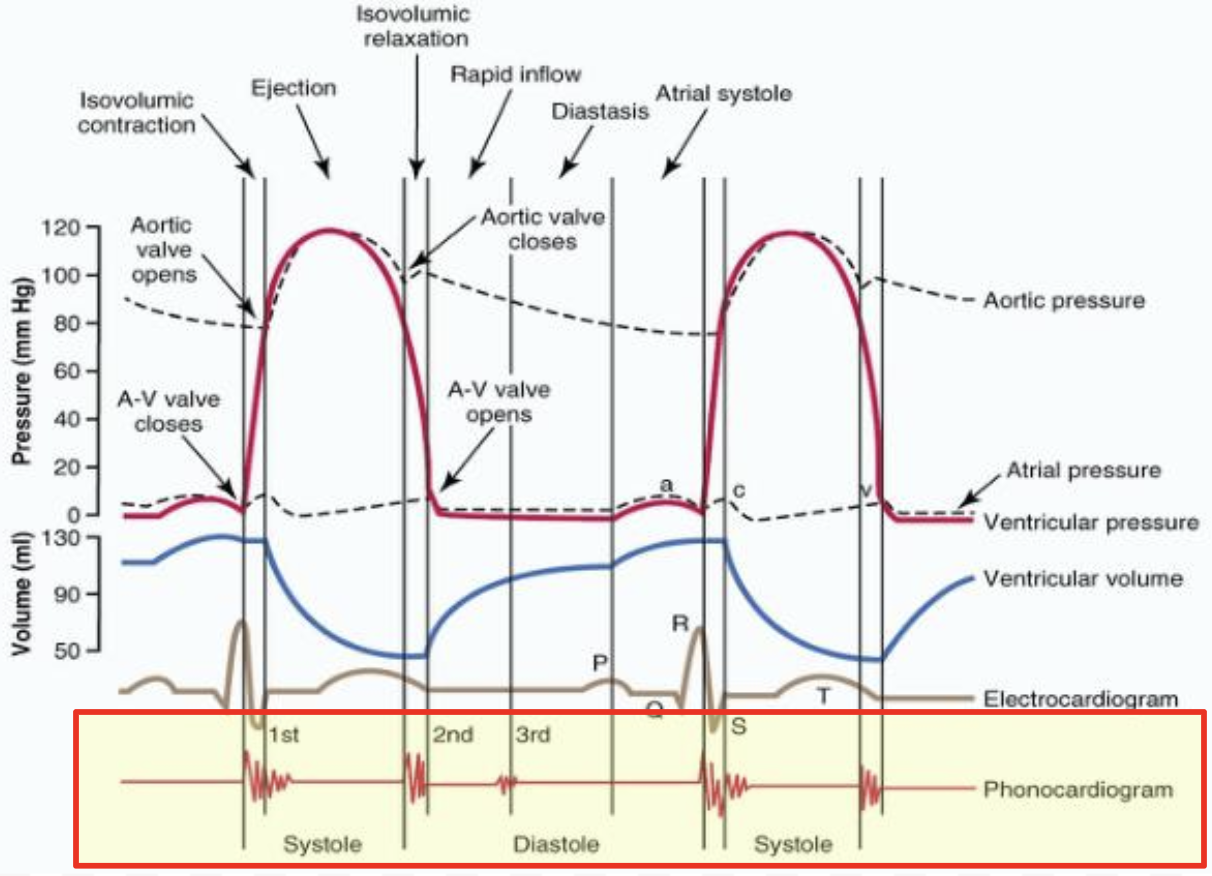
Phonocardiogram: S3
Blood flow into ventricle
Middle of diastole (AV valve open)
Ken-Tuc-Key (S1-S2-S3)
Phonocardiogram: S4
Atrial contraction
Forced contraction pushing blood into stiff/hypertrophic ventricle
End of diastole
Ten-nes-see (S4-S1-S2)