L02 - Basics of Modeling and Evaluation
1/28
Earn XP
Description and Tags
1. Modeling techniques 2. Linear Regression 3. Choosing the right model 4. K-Nearest-Neighbor Classification 5. Model evaluation
Name | Mastery | Learn | Test | Matching | Spaced |
|---|
No study sessions yet.
29 Terms
What are the categories of Machine Learning?
Supervised Learning: Training data includes desired outputs
Unsupervised Learning: Training data does not include desired outputs
Reinforcement Learning: Reward from sequence of actions
Supervised Learning
Typical data structure types
A feature (attribute) is a data item that represents a characteristic or a property of a data entity.
The label is the desired output of the machine learning algorithm, e.g. the attribute that we want to predict
What is the given and goal for the supervised learning?
Given: examples of input data(features) X and output(label) Y
Goal: predict function Y=F(X) for new, unknown examples X
Supervised Learning
Regression and Classification
If the target F(X) is continuous, the task is called Regression.
Sayılarla ifade edilen, ölçülebilen, kesintisiz değerler.
If the target F(X) is discrete, the task is called Classification.
Sayılı, sınırlı ve genellikle kategori şeklinde veriler.
How do machine learning algorithms work?
Every machine learning algorithm has three components:
Representation
Choosing the modeling type and thus defining the space of allowed models
Evaluation
Scoring function or cost-function to judge the models and distinguish good models from bad models
Optimization
Process of finding the best model in hypothesis space based on the given scoring function
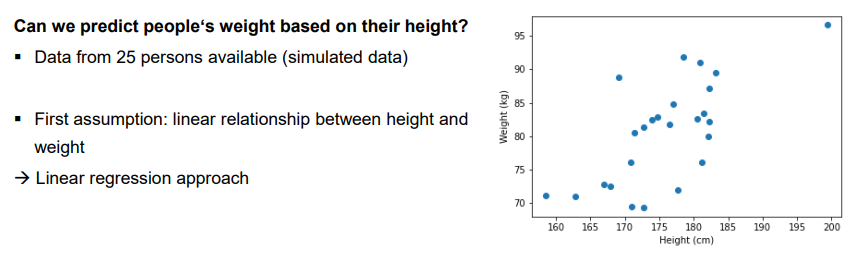
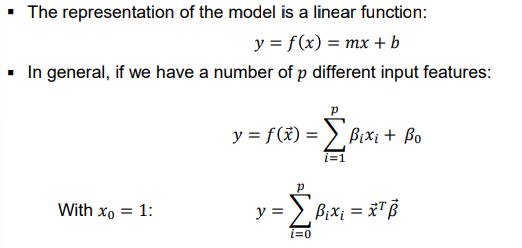
Linear regression
Representation
Linear regression is one of the simplest machine learning models
Linear regression
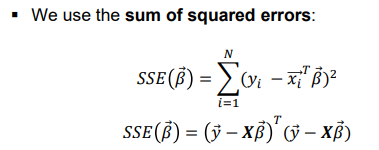
Evaluation
The linear models need to be evaluated using a scoring function
Linear Regression
Optimization
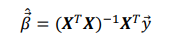
To find the optimal parameters \overrightarrow{\beta}, the SSE needs to be minimized
To find the minimum of the SSE, the derivative is set to 0 and solving for \overrightarrow{\beta}
What if there is no analytical solution?
Different definition of optimization?
Optimization in machine learning means finding the minimum of a cost function. In most cases, iterative approaches have to be implemented to find the minimum.
Gerçekte, bu minimum değeri tek adımda bulmak çok zor.
Terim | Basit Anlamı |
|---|---|
Optimization | En iyi çözümü bulma |
Cost Function | Modelin hata miktarını ölçer |
Iterative Approach | Deneye deneye daha iyi sonuç bulma |
Gradient descent
A simple optimization algorithm steps
Choose a starting point x
Calculate the gradient ∇𝑓(𝑥) of the cost function at the starting point
Step in the direction of the negative gradient (steepest descent)
x^{^{\prime}}=x-\gamma\nabla f\left(x\right)
New iteration
What are the hyperparameters?
In machine learning, hyperparameters \gamma are parameters that control the learning process. They are not part of the resulting model.
The learning rate \gamma is a hyperparameter and defines the size of the iteration steps.
What is a good model?
Has a low error
Predictions should be close to the actual values.
Generalizes well to unknown data
Model predictions should work just as well for new, unknown data points.
The error is made up by three terms
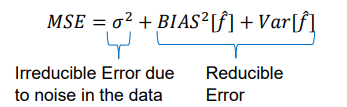
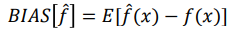
Bias
The bias of an estimator for a random variable y is the difference between an estimator expected value and the true value of the parameter being estimated.
The bias is independent of the training set considered and 0 for a perfect learner
It can be thought of as a systematic error due to incorrect assumptions in the model.
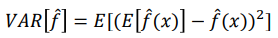
Variance
The variance of an estimator measures how much the estimator spreads out from its average value.
The variance is independent of the true value y and 0 for a learner that always predicts the same for all training sets.
It denotes changes in the model when using different training data
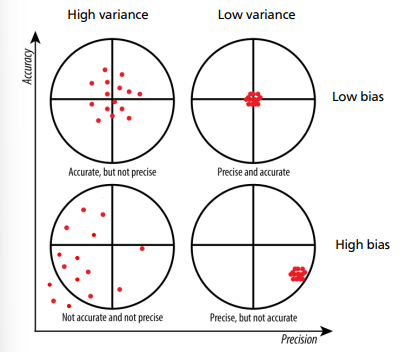
Accuracy, precision
Draw the diagram also
Accuracy assesses how close the results are to the actual value (bias of the results).
Precision assesses how close the results are with each other(variance) and therefore, how well the output is reproducible.
Bias-Variance-Trade-off
Goal: minimze both bias and variance
Very often, reducing variance leads to a higher bias and vice versa
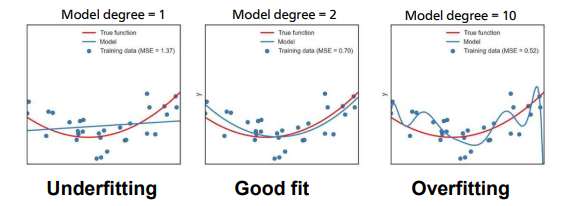
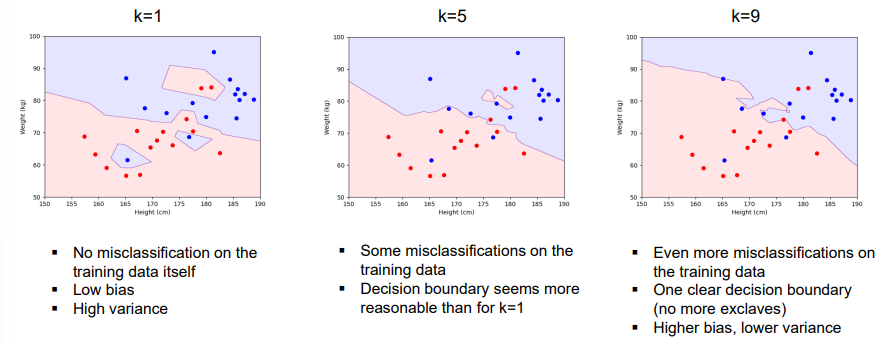
Overfitting and Underfitting
Underfitting: A model that suffers from underfitting is too general for a problem solution so that it is no even able to repeat the data it was trained with. The model has high bias and low variance.
Overfitting: A model that suffers from overfitting is too much adjusted to its training data so that it is not able to generalize the problem but repeat exactly what it has learned. The model has low bias and high variance.
Underfitting | Overfitting | |
|---|---|---|
Model | Too general | Too specific |
Problem | Can't learn training data | Learns only training data |
Generalize? | Already bad on training | Can't generalize to new data |
Bias | High | Low |
Variance | Low | High |
How to improve a model?
General recommendations for underfitting and overfitting models?
Underfitting model | Overfitting model |
Increase model complexity (helps to reduce bias) | Add more training data (helps to reduce variance) |
Modify model structure (additional features might help) | Feature subset selection (reduce the number of input features) |
Modify input features Adding more training data is usually not helpful | Decrease model complexity
|
What are the problems for the underfitting and overfitting models?
What are the solutions?
Underfitting
Problem: assumption of linear model not correct
Choose a non-linear model
Polynomial regression
Regression splines
Overfitting
Problem: Model too much adjusted to training data
High number of (irrelevant) input features
Number of data points not large enough
Regularization: Can be useful for high-dimensional feature spaces
Regularization types
Ridge Regression
Lasso Regression
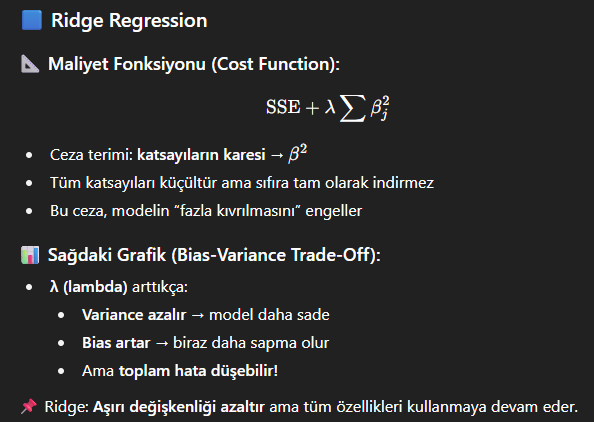
Ridge Regression
Penalty term proportional to square of the coefficients
Find best parameters to minimize the cost function
Tuning parameter controls the relative impact of the penalty term
Penalty term shrinks the estimated coefficients towards zero
Effect of regularization as λ increases:
Variance is reduced
Bias can increase significantly
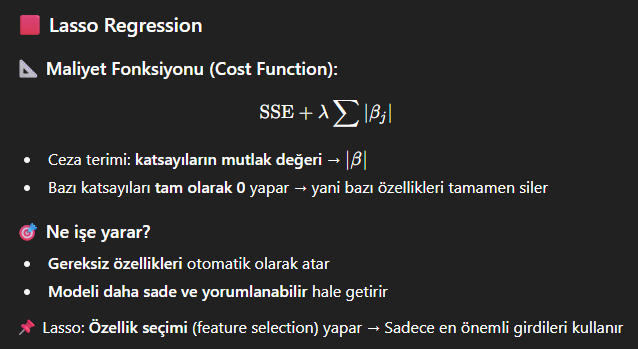
Lasso Regression
Penalty term proportional to absolute value of coefficients
Some of the parameters are set to exactly 0 with increasing tuning parameter
Selection of most important features
Increased model interpretability
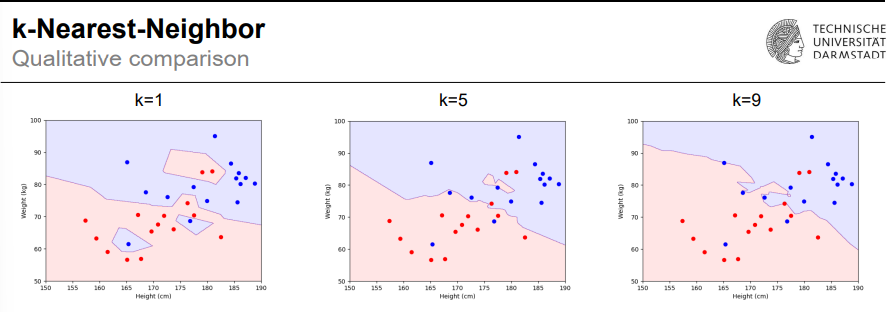
Classification algorithm
k-Nearest-Neighbor
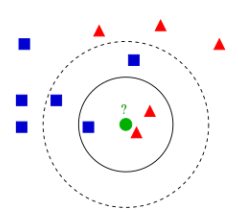
How to assign a class label to a new data point given some training data?
The k-Nearest-Neighbor algorithm is a very intuitive approach for classification.
No learning of a model is necessary
Assigning of class labels for unknown data is solely based on the training data
How to assign a class label to a new data point given some training data?
Choose the number k of neighbors
Calculate the distance (e.g Euclidean distance) from the data point to the training data points
Take the k nearest neighbors
Majority voting to determine the class assigned to the data point
What are the Evaluation of Learned Models?
Validation through experts
a domain expert evaluates the plausibility of a learned model
+ often the only option (e.g., clustering)
- subjective, time-intensive, costly
Validation on data
evaluate the performance of the model on a separate dataset drawn from the same distribution as the training data
+ fast and simple, no domain knowledge needed, methods for re-using training data exist (e.g., cross-validation)
- labeled data are scarce, could be better used for training
On-line Validation
test the learned model in a fielded application
+ gives the best estimate for the overall utility
- bad models may be costly
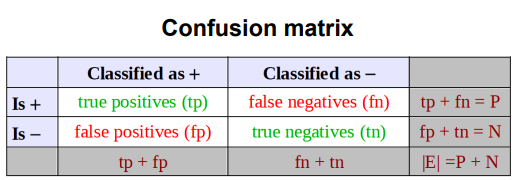
Binary classification
What is confusion matrix?
It is for validation on data
Define one class as positive class (+)
Define the other class as negative class (-)
Most common evaluation metric for binary classification:
Accuracy: acc= (tp+tn) / (tp+fn+fp+tn)
Validation on Data
Typically, the dataset is split into three parts:
Training data: data that is used to train the algorithm
Validation data: data that is used to optimize the hyperparameters of the model
Test data: data that is used to test the final model – never seen by the algorithm before
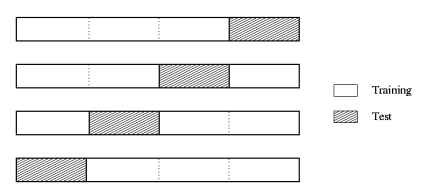
Validation on Data
k-fold-Cross-Validation
Partition your dataset into 𝑘 equal subsets (e.g. with 𝑘 = 10)
For every partition:
Keep the partition as test set and use the other k-1 partitions as training data
Train the model and evaluate its performance on the test set
Average the results
+ Makes best use of the data • No influence of random sampling
- Computationally expensive