Lecture 3 - Descriptive Statistics 1-2 (9/29-10/1)
1/14
There's no tags or description
Looks like no tags are added yet.
Name | Mastery | Learn | Test | Matching | Spaced | Call with Kai |
|---|
No analytics yet
Send a link to your students to track their progress
15 Terms
X (capital)
all possible values of the random variable
x (lowercase)
a specific value of X that was measured
Parameter
A fixed numerical characteristic of the population
ex: population mean, proportion, and standard deviation
Statistic
A numerical characteristic computed from a sample
ex: sample mean, proportion, and standard deviation
Measure of the center
Describes the typical or central value in a dataset
Sample mean
x̅ (x bar), the average
A measure of center
Median
x̃ (x tilde), describe the 50th percentile of the data
Percentile
Xp, where 0 < P < 100. P% of the data lies below it and (100-P)% of the data is above. So if you were 97th percentile in a class that means that 97% of students did worse than you
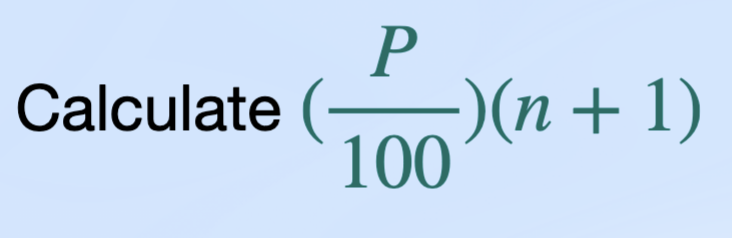
What is this for and how do you use it?
This is for seeing which data point is at the pth percentile
P = percentile
n = the number of individuals
If you get a decimal, take the average of the individuals on either side of the decimal
Range
The overall span of the data
Interquartile range (IQR)
The spread of the middle half of the data (Q3-Q1)
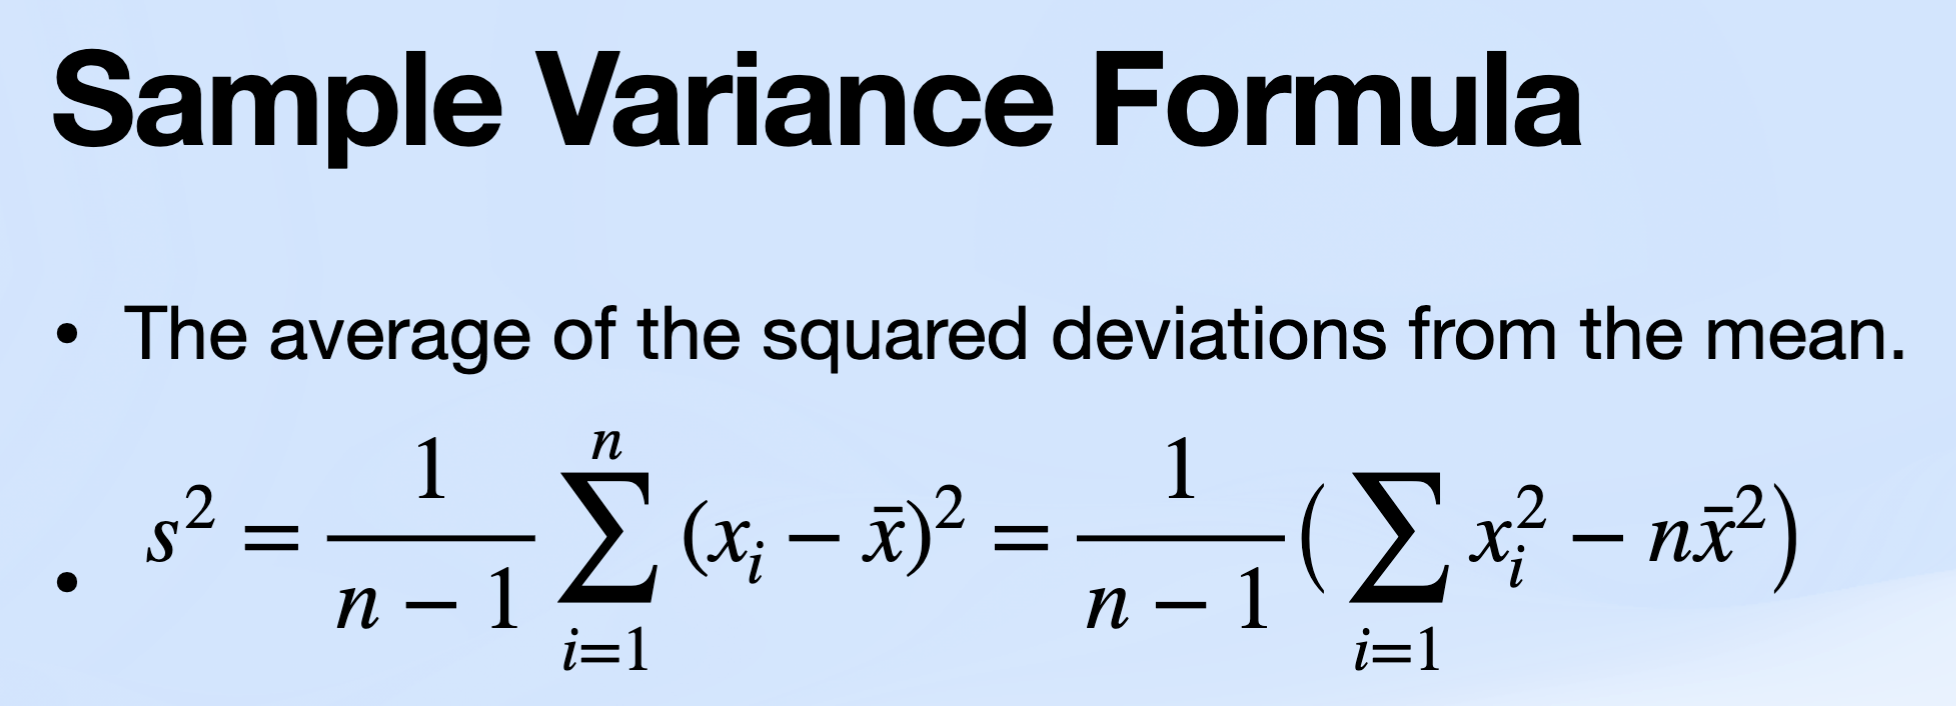
Sample variance
The average of the squared deviations from the mean
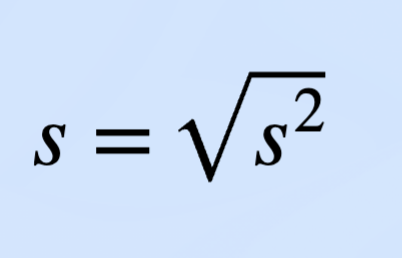
Sample standard deviation
A measure of how far values typically are from the mean
(the square root of sample variance)
Frequency in descriptive statistics for categorical data
The number of sample items that fall into each category
Relative frequency/sample proportions in descriptive statistics for categorical data
The frequency of a category is divided by total sample size
The fraction or percentage of the sample in each category