BI 157L: Chlorophyll Study Guide
1/15
Earn XP
Description and Tags
Questions & answers from Chlorophyll Quizzes
Name | Mastery | Learn | Test | Matching | Spaced |
|---|
No study sessions yet.
16 Terms
Fill in the blank:
Pixel values range from 0 to ____.
255
Which of the following statistical tests can be used to compare more than two variable groups?
a. None of these
b. ANOVA
c. two-tailed T test
d. one-tailed T test
ANOVA
In a greyscale image, if the pixel value is 1 that means the pixel color is _____.
a. a dark grey
b. white
c. a light grey
d. black
a dark grey
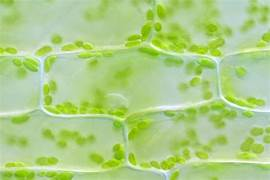
Which of the following is present in the microscope image below?
a. A cell
b. Chloroplasts
c. Chlorophyll
d. None of these
e. All of these
All of these
Which wavelength of light does a plant absorb when converting sunlight into energy? (select all that apply)
a. RGB
b. None of these
c. red
d. green
e. blue
red blue
Which wavelengths of light does a plant reflect when converting sunlight into energy? (Select all that apply)
a. RGB
b. none of these
c. red
d. green
e. black
f. white
g. blue
green
What was the purpose of the "split channel" function in imageJ? (select all that apply)
a. so that we could quantify the value of green in the pixels
b. to split the image into red, green and blue components
c. to measure the size of certain areas in the image
d. none of these
e. to split he image into separate areas of equal pixel #s
to split the image into red, green and blue components,
so that we could quantify the value of green in the pixels
During our plant experiment: What was the dependent variable, or the outcome that we intend to measure at the end of the experiment?
a. Leaf size
b. Effect of sun
c. % greenness
d. rate of respiration
e. none of these
% greenness
During Module 3 (Our plant experiment): What was the independent variable(s), or the factors that we purposely control and manipulate in order to effect the outcome of the experiment? (Select all that apply)
a. % greenness
b. Light condition
c. Pixel value
d. Seed type
e. Soil
f. None of these
g. Sugar/no sugar
Light condition,
Soil,
Seed type
You notice two colors of flowers growing outside of your house, about half of them are red and half of them are blue. You wonder if both colors of flowers typically grow to the same height, or if the growth habits differ depending on the color of flower. You make the following hypotheses:
Hypothesis 1: On average, the red flowers will have a significantly greater height than the blue flowers.
Null Hypothesis: On average, the red and blue flowers are the same height.
Which of the following should you use to test this hypothesis?
a. One-tailed T test
b. Any T test will do
c. Two-tailed T test
d. None of these
e. ANOVA
one-tailed T test
For what purpose did we use Ethanol? (EtOH)
a. None of these are correct
b. As a herbicide
c. AS a pesticide
d. To extract chlorophyll
e. As a dietary supplement for fruit flies
To extract chlorophyll
What was the independent variable(s) in our chlorophyll experiment? Aka, the variables that we included and manipulated in the experiment in order to find out if they have any effect on the outcome?
(Select all that apply)
a. Type of seed
b. Sunlight/no sunlight
c. Sevin concentration (ppm)
d. Weight of the soil (g)
e. Type of soil
f. Sugar/no sugar
g. Atrazine concentration (ppm)
Sunlight/no sunlight,
Type of soil ,
Type of seed
What was the dependent variable in our chlorophyll experiment? Aka, the thing that we measured at the end to find out the results of our experiment?
(Select all that apply)
a. EtOH concentration
b. size of plants that grew
c. # of RGB
d. % greenness
e. # of plants that grew
% greenness
True or false: You can use an ANOVA to compare the averages of two or more variable groups (For example, two or more seed types)
Select one:
True
False
True
What was the research objective of the chlorophyll experiment? (Select all that apply)
a. To try to produce the greatest amount of chlorophyll
b. None of these are correct
c. To test the relationship between % green and chlorophyll content
d. To isolate the effects of sunlight, plant type, and soil type
e. To test out some things that could have an effect on sunlight
To test the relationship between % green and chlorophyll content
To isolate the effects of sunlight, plant type, and soil type
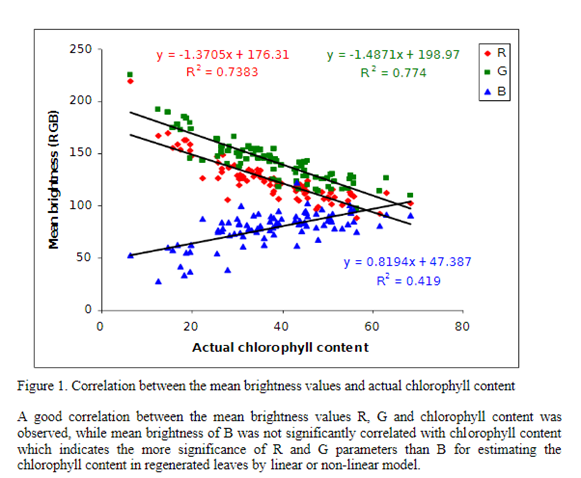
Researchers did a study to show the relationship between the Actual Chlorophyll Content in a plant, and the Mean Brightness of pixels in images of those plants. To to this, they plotted the pixel values (mean brightness) for red, blue and green band photos.
The graph they produced (below) helps us to see what higher or lower pixel values tell us about the chlorophyll content. This is important for how we interpret the data we collected (mean greenness) during our chlorophyll experiment.
When looking at Green band images (G), which of the following statements is true? Select all that apply. Use the image below for reference:
a. if the Mean Brightness (i.e. mean greenness) is lower, the Actual Chlorophyll content is greater.
b. If the Mean Brightness (i.e. mean greenness) is greater, the Actual Chlorophyll content is lower.
c. if the Mean Brightness (i.e. mean greenness) is greater, the Actual Chlorophyll content is greater.
d. if the Mean Brightness (i.e. mean greenness) is lower, the Actual Chlorophyll content is lower.
e. None of these are correct
if the Mean Brightness (i.e. mean greenness) is lower, the Actual Chlorophyll content is greater.
If the Mean Brightness (i.e. mean greenness) is greater, the Actual Chlorophyll content is lower.