Lecture 2: Global Biodiversity: How Natural Patterns Inform Conservation
1/22
Earn XP
Description and Tags
Gonzalez
Name | Mastery | Learn | Test | Matching | Spaced |
|---|
No study sessions yet.
23 Terms
Estimates for the number of eukaryotic species on Earth
3-100 million
~8.7 million ( ± 1.3 million) eukaryotic species
~2.2 million are marine
Estimates for percentage of species still awaiting descriptions (Earth and Ocean)
86% on land
91% in the ocean
Why are there fewer described ocean species?
There is lower relative diversity in marine habitats (excluding coastlines).
Percentage of life in soil
59%
Most biodiverse habitat on Earth
Species Richness
Number of Species
Evenness
Distribution of species and their balance
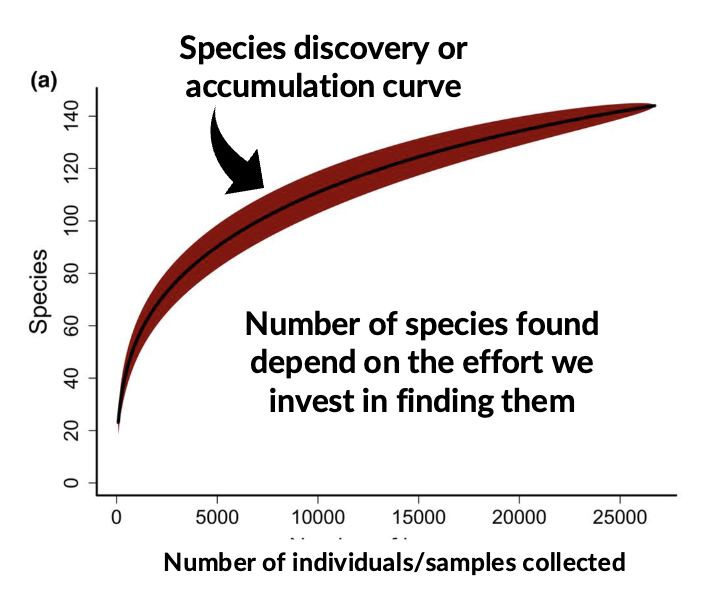
Species discovery/ accumulation curve
Number of species discovered depends on effort invested
Rank - abundance curve (and changes in RAC)
Changes can indicate how evenness is changing, loss of species, introduced species, reordering of species dominance
These changes require effort to detect, which most countries simply do not have the resources for.
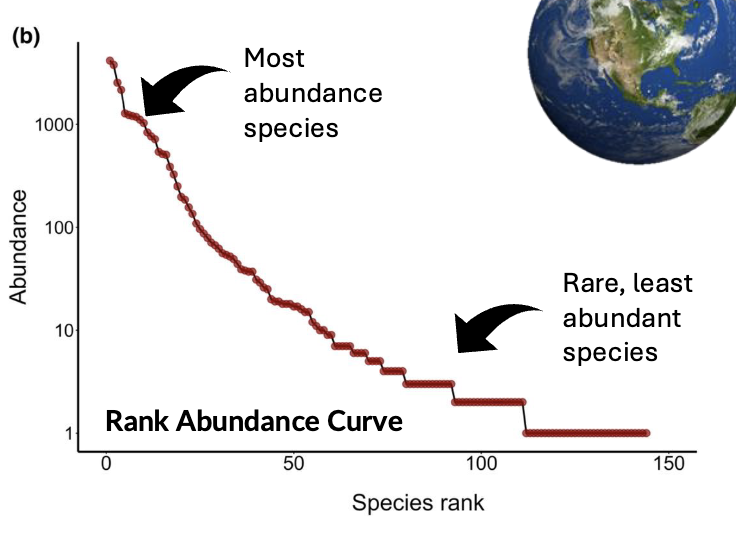
Log RACs - how to interpret them
Slope indicates evenness
Steep gradient= low evenness
Shallow gradient= high evenness
Species Abundance Distributions (SADs)
Plot of the frequency relative to their abundance
GBIF - Global Biodiversity Information Facility
From 1900, SAD has become more lognormal because of citizen science/ research
There may be universality in the shape of the SAD (though some groups have more or less of the SAD discovered)
Biodiversity hotspots
Geographically defined areas that have an extraordinary concentration of endemic species
More than half of Earth’s species contained in 1.4% of its land area
Currently 36 recognized hotspots
Percentage of vascular plant species found in biodiversity hotspots
44%
Percentage of vertebrate species found in biodiversity hotspots
35%
Criteria for biodiversity hotspots
High endemism:
Must contain at least 1,500 species of vascular plants that are found nowhere else on Earth
Significant threat:
It must have lost at least 70% of its original habitat
How hotspots emerged
Topographical and microclimate diversity
Macroclimate stability
Proportion of hotspot species at high extinction risk
2/5
1/3 because of increasing climate change in previously stable microclimate
Species can’t adapt fast enough
The Latitudinal Diversity Gradient
High number of mammals in tropical latitudes (and most other groups)
There are some exceptions (salamanders)
This pattern holds true for elevation gradients as well
Has flattened during “greenhouse” periods (higher global temperatures)
Groups for which the Latitudinal Diversity Gradient holds true
Vascular plants
Birds
Mammals
Amphibians
Mosses
Three hypothesis groups for LDG
Climate and energy hypotheses
Historical/ Evolutionary hypotheses
Spatial hypotheses
Climate and energy hypotheses for LDG
Species - Energy: More solar energy and water in the tropics leads to higher productivity
Climatic Stability: Less seasonality allows for greater specialization and narrower niches
Historical/ Evolutionary hypotheses for LDG
Evolutionary time: never scoured by glaciers, so “more time” to develop
Spatial Hypotheses for LDG
Mid-domain effect
Ranges overlap at the equator