isu ib hl bio
1/246
There's no tags or description
Looks like no tags are added yet.
Name | Mastery | Learn | Test | Matching | Spaced | Call with Kai |
|---|
No analytics yet
Send a link to your students to track their progress
247 Terms
Stability of an ecosystem
ecosystem can endure over time because of the processes functioning within it. (has gradual changes)
Stable ecosystem example
Daintree rainforest - oldest continuously forested rainforest on earth
What does the structural and functioning stability of an ecosystem depends on
Sufficient supply of energy
Recycling of nutrients
Genetic diversity
Climatic variables remaining within tolerance levels
Sufficient supply of energy
Energy enters an ecosystem as light, so it's important that there are producers and they are efficient for the ecosystem to be stable
Recycling of nutrients
There is a finite supply of nutrients in an ecosystem, so they must be recycled by organisms for it to thrive
Genetic diversity
large gene pools mean protection if there is significant changes, because some alleles will allow the species to adapt, keeping the ecosystem stable
Climatic variables remaining within tolerance levels
species in an ecosystem can tolerate some abiotic changes, but not significant. so variables must stay in tolerance levels for ecosystem to be stable
Possible tipping point of ecosystem stability - Amazon Rainforest
- so large that it influences its own weather + climate, if disrupted:
- normally water vapour is produced by vegetation transpiration (has cooling effect)
- condensation of water vapour turns into clouds/rainfall (influences wind patterns)
Amazon forest deforestation cycle
deforestation = less transpiration = less water vapour = less natural cooling event = higher temperature = easier to burn = reduced forest
Tipping point
point where an ecosystem can no longer cope with environmental change, shifting from one state to another
Amazon tipping point
17% cleared over 60 years
tipping point unknown
Mesocosm
portion of a natural ecosystem to be used for ecological experiments
Sealed mesocosm
allows energy transfer but prevents matter exiting/enterin
How mesocosm allow for experiments
once set up, a specific condition can be changed, then the changes in mesocosm are monitored and analysed
When to address ethical considerations - mesocosms
when animals are involeved
Keystone species
species whose activity has a disproportionate effect on the structure of an ecological community (risk of ecosystem collapse if they're lost)
What keystone species impact
prevalence and population levels of other species in community
Keystone species examples
cassowaries, ochre sea star
Keystone species ochre sea star
- found in intertidal zones in western North America, predator of mussels
- removal of sea stars = increase mussel population = less invertebrates/algae ∴ decrease biodiversity
Keystone species cassowaries
- large, flightless birds found in topical rainforests, swamps, mangrove forests, woodlands, beaches in Queensland
- eat fruit, then disperse and germinate seeds
- animals rely on these plant species
sustainable harvesting: brazil nuts
- harvested from Bertholletia excelsa trees in the Amazon
- area is threatened by logging
sustainable harvesting = selective logging + leaving some nuts to germinate
Issues with agriculture
- soil erosion
- leaching of nutrients
- supply of fertilisers + other inputs
- agrochemical pollution
- carbon footprint
soil erosion
wearing away of surface soil by water and wind
leaching of nutrients
rainfall/irrigation water dissolving nutrients in soil and carrying them away from crop roots
supply of fertilisers + other inputs
chemical fertilisers increase levels of nutrients in soil (production + transport = expensive + energy extensive)
agrochemical pollution
chemical pesticides contaminate soils
- carried away to waterways
runoff
water that moves across the land surface and into streams and rivers
leaching
removal of dissolved materials from soil by water moving downwards
eutrophication
nutrient enrichment of aquatic environments from runoff and leaching
eutrophication effect on ecosystem
chain reaction that reduces level of dissolved oxygen
how does eutrophication reduce oxygen levels
BOD increase (caused by extra decomposition by excessive algal growth) = oxygen levels depleting
- deprives aquatic animals of oxygen
biochemical oxygen demand (BOD)
the amount of oxygen needed by bacteria in a body of water
1. excess nitrates + phosphates = rapid algae/plant growth
2. sunlight blocked by algae on water surface so plants deep under water die
3. excess algae/plants = increase organic material available to bacteria (increasing their pop.)
4. increase bacteria = more oxygen needed for respiration (increase BOD), decreasing level of dissolved oxygen in water
5. aquatic animals cannot obtain enough oxygen to survive
biomagnification
increase in toxin concentration in trophic levels
biomagnification process
- small amount enters at producer/primary consumer levels
- toxin from prey accumulates in body tissue of predators
- repeated along food chain until level of toxin is high enough to cause illness/death
biomagnification: mercury
-mercury biomagnifies as it goes up the food chain
-mercury-contaminated fish are the primary pathway of mercury into humans
biomagnification: DDT (dichloro-diphenyl-trichloroethane)
Persistence: Banned in many developed nations but remains in water sediments due to its chemical stability.
Bioaccumulation & Biomagnification: Absorbed by bottom feeders/zooplankton, then concentrated up the food chain, reaching highest levels in top predators (e.g., eagles, ospreys).
Ecological Effects: Causes eggshell thinning in birds, leading to population declines (e.g., bald eagles). This prompted the 1973 Endangered Species Act in the U.S.
Recovery: After DDT was banned, environmental and animal concentrations declined, aiding species recovery.
effect of microplastics
- not biodegradable
- can be ingested by marine animals
- accumulate in body tissues
- passes to predators
- some plastics slowly release chemicals that have been associated with certain types of cancer
macroplastics
pieces of plastic bigger than 5 mm
microplastics
pieces of plastic smaller than 5 mm (found in every marine ecosystem studied so far)
north pacific subtropical gyre
- plastics get caught in gyres (large ocean currents)
- great pacific garbage patch created in north pacific subtropical gyre
- high level of microplastics
macro/microplastic impact on marine life
- sea turtles eat plastic bags (think they're jellyfish)
- plastic rings from six-packs of canned drinks stuck on wildlife necks
- fishing nets trap fish, turtles, marine mammals
- microplastics take up space in digestive tract of marine animals (less nutrient intake)
rewilding methods
- reintroducing apex predators/keystone species
- re-establishing connectivity of habitats over large areas
- minimisation of human impact
rewilding
approach to restoring natural ecosystems (minimal human intervention)
diversity
variety or multiformity, a condition of being different in character and quality
ecosystem diversity
variety in the combinations of species living together
- partly due to the very varied environments on Earth
- also due to geographical ranges of organism
species diversity
the many different species on the evolutionary tree of life
- these species have varied body plans, internal structure, life cycles and modes of nutrition
genetic diversity within species
variety in the gene pool of each species
- there is variation both between geographically separated populations and within populations
estimation of the number of eukaryotic species on Earth
2-10 million species
- accounts for undiscovered species
estimation of the number of prokaryotic species on Earth
cannot be done
- too many uncertaintes for reliable estimates
how can relative levels of biodiversity be deduced
fossil evidence
what and when was the most recent mass extinction
the end of the Cretaceous period - when an asteriod collided with Earth
66 million years ago
- resulting in the death of non-avian dinosaurs
what will cause the sixth mass extinction
anthropogenic causes - human activity
overharvesting
human take plants and animals from natural ecosystems by hunting animals, harvesting plants for food or medicines, logging forests for timber and fishing
- current rates are unsustainable
habitat destruction
natural habitats were destroyed so that land could be used for agriculture
- leads to the loss of some species
invasive species
when alien species are introduced to ecosystems, they can drive native species to extinction by predation, spreading pests and diseases or competition for resources
- endemic species become extinct if they hybridise with aliens
pollution
chemical industries produce a vast range of substances that are used and then discarded or released into the environmental
- burning of fossil fuels, agriculture, miming or extraction and pharmaceuticals are all major sources of pollutants
global climate change
human activities are causing very rapid changes in temperatures, rainfall, snow cover and other environmental variables on Earth
8 direct/ indirect causes of ecosystem loss (CLOUD BLM)
1. land-use change for agricultural expansion in temperate zones
2. urbanisation - urban area has grown to accommodate the rapidly growing human population
3. overexploitation of natural resources
4. miming and smelting destroy areas of natural ecosystems and pollution
5. building of dams and extraction of water for irrigation can lead to loss of natural river and lack ecosystems
6. drainage or diversion of water for human uses has caused the loss of swamps
7. leaching of fertilisers into rivers causes eutrophication and algal blooms
8. climate change
biodiversity crisis
describe the unprecedented losses of ecosystems and species occurring today
evidence of the biodiversity crisis for monitoring 5 prerd
- population size of a species
- range of a species
- diversity of species in an ecosystem
- richness and evenness of biodiversity in a ecosystem
- extent to degradation of an ecosystem
in situ conservation
conserve species in their natural habitats
- leaves areas of the Earth surface in a state of pristine wilderness, protected
advantages of in situ conservation
- ensured that species live in an abiotic environment to which it is adapted
- allows the species to interact with other wild species, conserving more aspects of the organism's niche
- animal behaviour patterns can remain normal
- costs are low
ex situ conservation
the preservation of species outside their natural habitats - organisms are removed from the wild and placed into zoos (breeding programs) and botanic gardens (must propagate plants)
advantages of ex situ conservation
1) organisms are protected from predation and poaching
2) health of individuals can be monitored and medical assistance given as required
3) can be bred to increase numbers of an endangered species
4) can be used as sites of education
germplasm
- radical long term storage of living material
- seed banks at low temperatures for plants
- samples of eggs and sperm for animals
EDGE of Existence project
has a criteria to identify animal species that are most deserving of conservation
- species that are both evolutionarily distinct and globally endangered
example of species extinction
Northern Island Giant Moas and Caribbean monk seals
example of an ecosystem loss
the loss of mixed dipterocarp forest in Southeast Asia
overarching cause of the current biodiversity crisis
human population growth
Define population.
A group of individual organisms of the same species living in a given area.
State what isolates populations of the same species.
Geographical barrier that prevents interbreeding --> reproductively isolated.
Define sample.
A small portion of a population allowing for estimates.
Outline the purposes of sampling a population.
Usually impossible to count every organism in a population due to camouflage or movement.
Allows for estimates based on evidence of populations.
Define sampling error.
Statistical error that occurs when the sample does not accurately represent the entire population.
Describe the need for randomness in sampling procedures.
Gives every organism an equal chance of being included in a sample to avoid sampling biases/ errors.
Outline the use of quadrat sampling to estimate the population of a sessile organism.
Repeatedly placing a quadrat frame at random positions in a habitat and recording number of organisms present.
Top/ right = In, Bottom/ left = out
Procedure:
1. Measuring tape base line along habitat edge.
2. Table/ random number generator to generate random numbers.
3. First number determines distance along tape, second determines perpendicular distance across the habitat.
4. Quadrat is placed precisely at the distances determined by the two random numbers.
Describe the method of capture- mark- release-recapture sampling to estimate the population of a motile organism.
1. Capture as many as possible with netting, trapping, or careful searching.
2. Mark each individual without making more visible to predators.
3. Release and allow all to settle back into habitat.
4. Recapture as many as possible and count how many marked and unmarked.
5. Lincoln index: Population size = (caught and marked initially x total number recaptured)/ recaptured with marks.
List assumptions made about the population when using mark-recapture methods to estimate population size.
No migration in or out.
No births or deaths.
Marked mix back into population and have same chance to be recaptured.
Marks remain visible.
Marks do not increase threat of predation or survival.
Define carrying capacity.
Maximum population size that an environment can support.
List examples of resources that may limit the carrying capacity of a population.
Plants: Water, light, soil nitrogen.
Animals: Water, breeding space, food, dissolved oxygen.
Outline population size control as an example of a negative feedback loop.
Density independent factors: Same effect no matter population size.
Density dependent factors: Increasing effect as population size increases.
Density dependent factors cause regulation of population size by increasing mortality rates as natality rates increase.
List examples of density- dependent factors that maintain population carrying capacity.
Competition: For limited resources like water/ nutrients.
Predation: More intense as population is more dense.
Disease, parasitism, prey infestation: Easier for spread from host to host.
Outline examples of density- independent factors that maintain population carrying capacity.
Natural disasters.
Flooding.
Outline conditions in which populations can grow exponentially.
Positive feedback: Breeding --> more reproduction --> more organisms can breed.
Density dependent factors are absent or ineffective.
--> Spread into new area or new ecological niche.
Abundant resources, no pathogens/ pests.
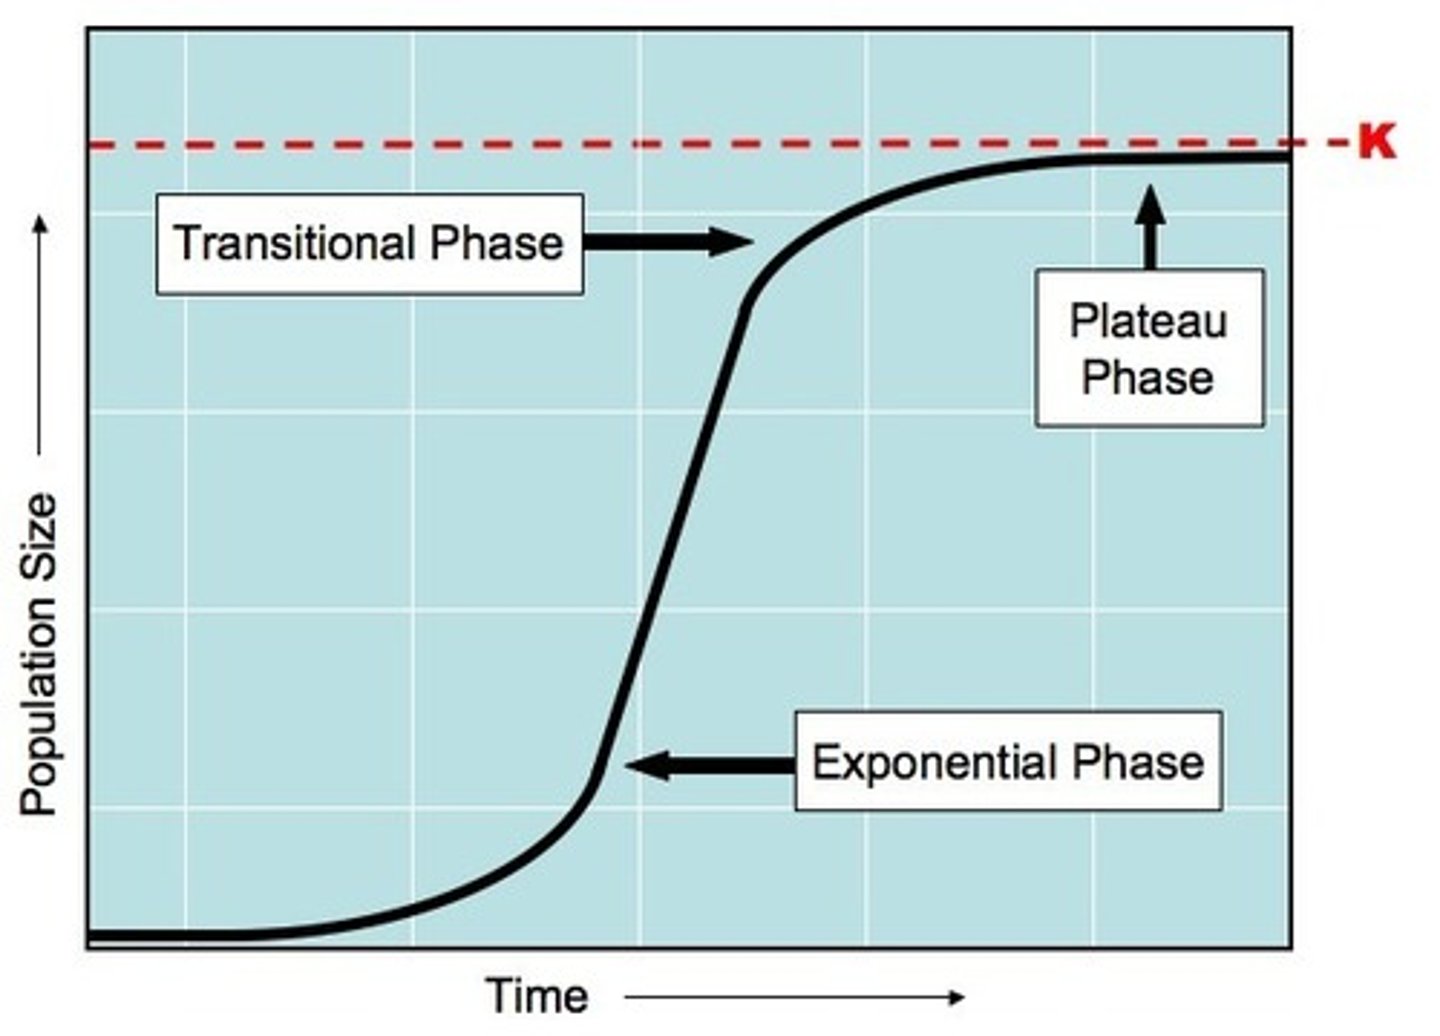
Explain the reasons for the pattern of sigmoid population growth curve.
Exponential growth: Abundant resources, low competition/ mortality.
Transition phase: Population growth slows due to reduced resource availability.
Plateau phase: No net growth, stable population size, reached carrying capacity.
Ex: Collared dove growth plateaued in the UK, Netherlands, and other places in Europe due to environmental factors like pests/ pathogens.
Outline a method for monitoring the population of yeast or duckweed over time.
Experiment: Carrying capacity of given container, ideal cnditions (light, nutrients, container surface area) for population growth.
Numbers monitored by data logging or regular counts.
Define intraspecific relationship.
A relationship that exists between individuals of the same species.
Competition and cooperation.
Outline cause and effect of competition in a population.
Share an ecological niche --> require same resources.
Some individuals more successful and gain more resources --> survive and reproduce --> natural selection to allow more effective competition.
List examples of competition and cooperation in plant and animal populations.
Competition: For light in plants, pollinators in flowering plants, food in animals, breeding sites in animals.
Cooperation: Communal roosting in animals, feeding in animals, defence against predation in animals, parental care in animals.
Define community.
Give an example of a community of organisms.
A group of populations living together and interacting with each other.
Coral polyps, fish, sea urchins, sponges, and algae.
Outline the ecological interactions within biological communities. Include mutualistic (++), competition (--), predation (+-), herbivory (+-), parasitic and pathogenic interactions (+-).
Mutualistic: Both species benefit.
Competition: Shared resources.
Predation: One species kills and eats the other.
Herbivory: Primary consumers feed on producers.
Parasitic: Host harmed and parasite benefits.
Pathogenic: Pathogen species causes disease in host.
State an example of mutualistic (++), competition (--), predation (+-), herbivory (+-), parasitic and pathogenic interactions (+-).
Mutualistic: Zooxanthellae living in hard coral cells.
Competition: Cows and bisons feeding on grass.
Predation: Anteaters feeding on ants or termites.
Herbivory: Bison feeding on grasses.
Parasitic: Ticks living on deer skin and feeding on blood.
Pathogenic: Potato blight fungus infecting potato plants.
Outline the mutualistic relationship within root nodules in Fabaceae (legume family).
Fabaceae: Provides protection from consumers, maintains low oxygen concentrations, and energy by photosynthesis.
Rhizobium (in root nodules): Fixes nitrogen to produce ammonium, supplies ammonium to plant, prevents nitrogen deficiency.
Outline the mutualistic relationship within mycorrhizae in Orchidaceae (orchid family).
Orchid: Supplies carbon compounds made by photosynthesis.
Fungus: Supplies orchid with nitrogen and phosphorus in soil, supplies water absorbed from soil.
Outline the mutualistic relationship of zooxanthellae in hard corals.
Zooxanthellae: Supplies carbon compounds and oxygen produced by photosynthesis.
Hard corals: Safe protected environment, grows close to sea surface for reliable light source, supplies carbon dioxide by respiration.
Define endemic and invasive species.
Endemic: Species that occur naturally in an area.
Invasive: Species that were accidentally or deliberately introduced by humans that increase and spread rapidly.
Describe the effect of invasive species on the realized niche of an endemic species.
Endemic occupies smaller realized niche due to being outcompeted by invasive species.
Outline the competition for resources in an example of endemic and invasive species.
Red lionfish endemic to coastal seas in Indo-Pacific.
Small number escaped from aquarium, multiplied and spread on coral reefs.
Adapted to avoid venomous vines and lack of predators.
Compete with endemic fish species by establishing territories for which other fish are excluded.
Explain the methodology and limitations of using a chi-square test to assess presence of interspecific competition in a community.
Tests for independence or associations between species and goodness of fit.
1. Define two hypotheses.
2. Draw contingency table of observed frequencies.
3. Calculate expected frequency: (row x column total)/overall
4. Calculate degrees of freedom: n-1 where n is number of outcomes.
5. Critical value is 3.83 (p < 0.05): If chi-squared is greater, alternative hypothesis accepted.
6. Chi-squared = Sum of (observed-expected)^2/expected.