STAT 250 Second Quiz
1/21
Earn XP
Description and Tags
This is for Chapter 3 and beyond
Name | Mastery | Learn | Test | Matching | Spaced |
|---|
No study sessions yet.
22 Terms

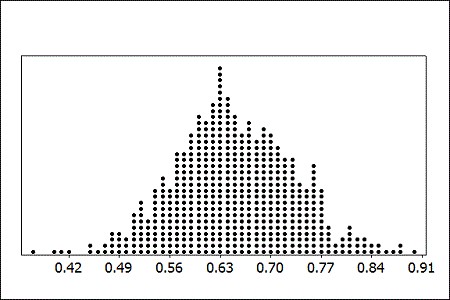
The sampling distribution shows sample proportions from samples of size n = 35, estimate the population proportion from the dotplot:
0.63

If the sample size n = 65 was used rather than n = 35, what would be true?
The sample statistics would have less variability.

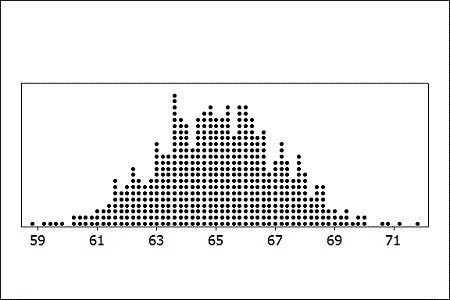
n = 50 Using the sample distribution, how likely is x̄ (x bar) = 55.6?
Identify if this is a sample proportion or a sample mean
Sample proportion
Identify if this is a sample proportion or a sample mean
Sample mean

Sample means of the size n = 50 IF n = 30 had been used instead of n = 50, what would be true?
The sample means would be centered at the same value
In a survey of 7,786 randomly selected adults living in Germany, 5,840 said they exercised for at least 30 minutes three or more times per week.
Identify with proper notation, the quantity being estimated
p = proportion of German adults who exercise for 30 minutes three or more times per week
In a survey of 7,786 randomly selected adults living in Germany, 5,840 said they exercised for at least 30 minutes three or more times per week.
Give the value of the best estimate of the population parameter, along with the equation
p hat = 5840 / 7786 = 0.75 (proportion of the sample that say they exercise for 30 minutes three or more times per week)
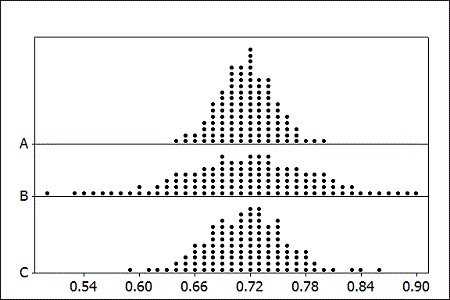
According to U.S. Census data, 71.6% of Americans are age 21 and over. The provided figure shows possible sampling distributions for the proportion of a sample age 21 and over, for samples of size n = 50, n = 125, and n = 350
Which sample size is for graph A?
n = 250
In a recent Gallup survey of 1,012 randomly selected U.S. adults (age 18 and over), 53% said that they were dissatisfied with the quality of education students receive in kindergarten through grade 12. They also report that the "margin of sampling error is plus or minus 4%."
What is the population of interest?
U.S. adults (age 18 and over)
In a recent Gallup survey of 1,012 randomly selected U.S. adults (age 18 and over), 53% said that they were dissatisfied with the quality of education students receive in kindergarten through grade 12. They also report that the "margin of sampling error is plus or minus 4%."
What is the sample being used?
1012 randomly selected U.S. adults
In a recent Gallup survey of 1,012 randomly selected U.S. adults (age 18 and over), 53% said that they were dissatisfied with the quality of education students receive in kindergarten through grade 12. They also report that the "margin of sampling error is plus or minus 4%."
What is the population parameter of interest, and what is the correct notation for this parameter?
p = proportion of U.S. adults who are dissatisfied with the quality of education students receive in kindergarten through grade 12
In a recent Gallup survey of 1,012 randomly selected U.S. adults (age 18 and over), 53% said that they were dissatisfied with the quality of education students receive in kindergarten through grade 12. They also report that the "margin of sampling error is plus or minus 4%."
What is the relevant statistic?
p hat = proportion of the sample of 1012 randomly selected U.S. adults who are dissatisfied = 0.53
Identify if this is statement is a proper interpretation of a 95% confidence interval
95% of the population values fall within this interval
Incorrect
Identify if this is statement is a proper interpretation of a 95% confidence interval
The probability that the population parameter is in this interval is 0.95
Incorrect
Recently, the Centers for Disease Control and Prevention estimated 9.4% of children under the age of 18 had asthma. They reported the standard error to be 0.35%.
Assuming that the sampling distribution is symmetric and bell-shaped, find a 95% confidence interval and show the equation
0.094 - 2 × 0.0035 = 0.087 | 0.094 + 2 * 0.0035 = 0.101 (8.7% to 10.1 %)
Identify if the sample 20, 20, 20, 20, 20 is a possible boostrap sample from the original sample of 20, 24, 19, 23, 18
Possible
An Internet provider contacts a random sample of 300 customers and asks how many hours per week the customers use the Internet. It found the average amount of time spent on the Internet per week to be about 7.2 hours.
Define the parameter of interest, using the proper notation
mu (u) = mean number of hours per week all customers use the internet
An Internet provider contacts a random sample of 300 customers and asks how many hours per week the customers use the Internet. It found the average amount of time spent on the Internet per week to be about 7.2 hours.
Give the best estimate of the population parameter
x bar = 7.2 hours
An Internet provider contacts a random sample of 300 customers and asks how many hours per week the customers use the Internet. It found the average amount of time spent on the Internet per week to be about 7.2 hours.
The standard error is about 0.458. Find the 95% confidence interval for the parameter
7.2 - 2 × 0.458 = 6.28 | 7.2 + 2 × 0.458 = 8.12 (6.28 to 8.12 hours)
An Internet provider contacts a random sample of 300 customers and asks how many hours per week the customers use the Internet. It found the average amount of time spent on the Internet per week to be about 7.2 hours.
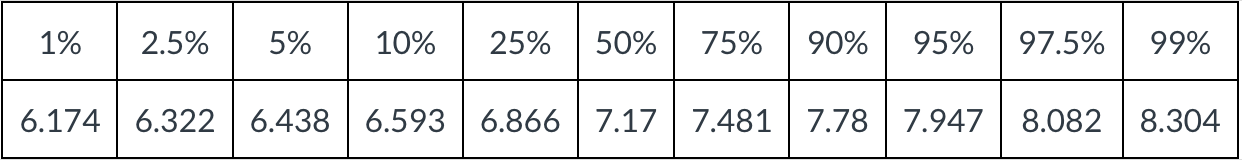
Percentiles of the boostrap distribution are provided, use the percentiles to report a 95% confidence interval along with how to calculate it:
100 - 95 = 5 | 5/2 = 2.5 or 97.5% and 2.5% | (6.322 hours to 8.082 hours)

An Internet provider contacts a random sample of 300 customers and asks how many hours per week the customers use the Internet. It found the average amount of time spent on the Internet per week to be about 7.2 hours.
Percentiles of the boostrap distribution are provided, use the percentiles to report a 90% confidence interval along with how to calculate it:
100 - 90 = 10 | 10/2 = 5 or 95% and 5% | (6.438 hours to 7.947 hours)