TOPIC #3: Numerical Summaries
1/15
Name | Mastery | Learn | Test | Matching | Spaced |
|---|
No study sessions yet.
16 Terms
What are the advantages of a numericall summary?
Reduces all data to one simple number/statistic and this allows for easy communication and comparisons
what major features can be used to create numeric summaries?
maximum, minimum, centre (mean and median), spread (standard deviation, range, IQR)
Mean
sum of data/size of data, - is the unique balancing point on the histogram
median
the middle data point , is the halfway point on the histogram, splitting the histogram into bottom 50 and upper 50 %

what is the purple line on this image
the median
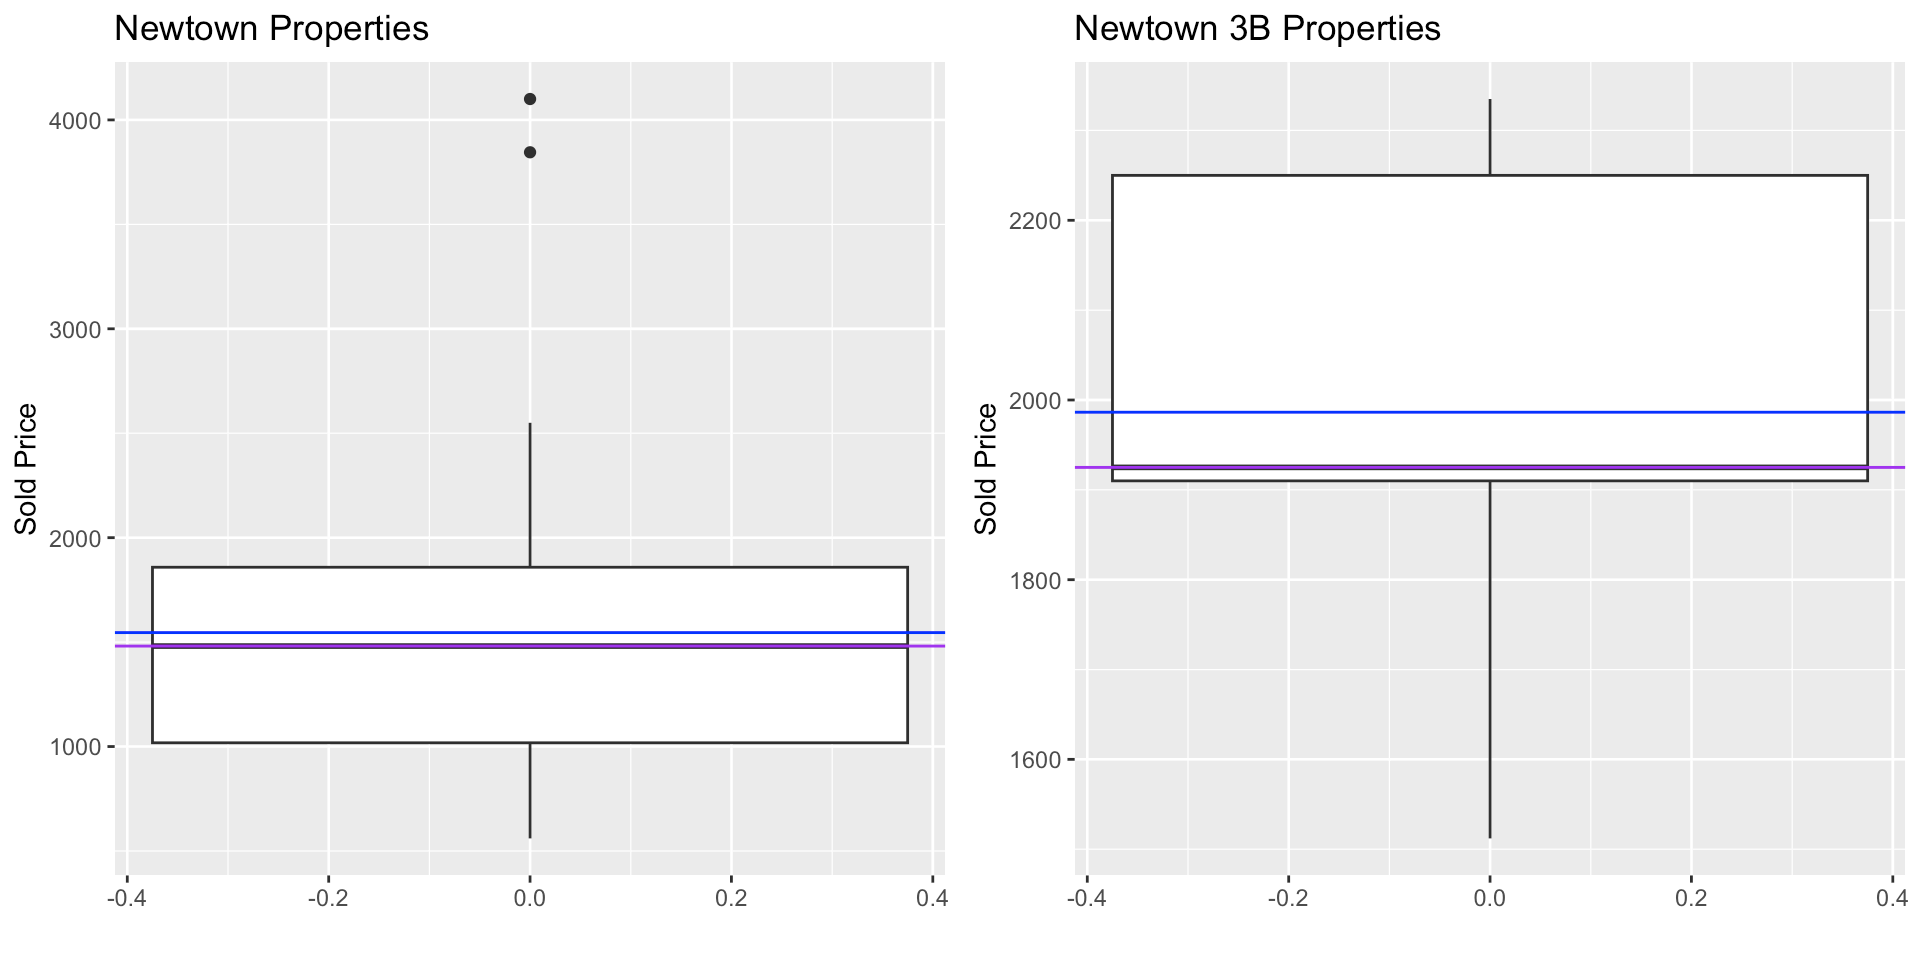
what is the blue line on this image
the mean
what is said to be robust, and a good summary for skewed data and why?
the median, as it is not affected by outliers.
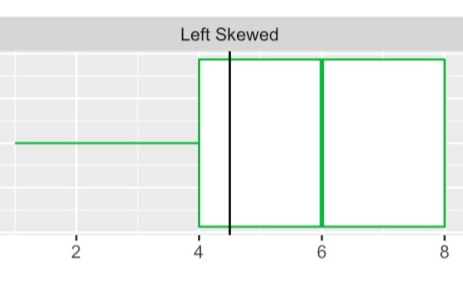
for left skewed data, what can we expect from the mean and median?
the mean is smaller than the median
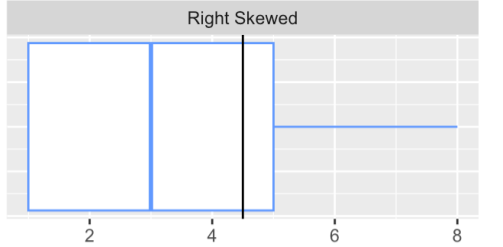
for right skewed data what cna we expect from the mean and the median
we expect the mean to be larger than the median
how to typically measure spread?
standard deviation: measures the spread of the data. SDpop = RMS of (gaps from the mean) (Root mean square (RMS) - measures the average of a set of numbers, regardless of the signs. Square the numbers, mean the results, then root the result.), RMS
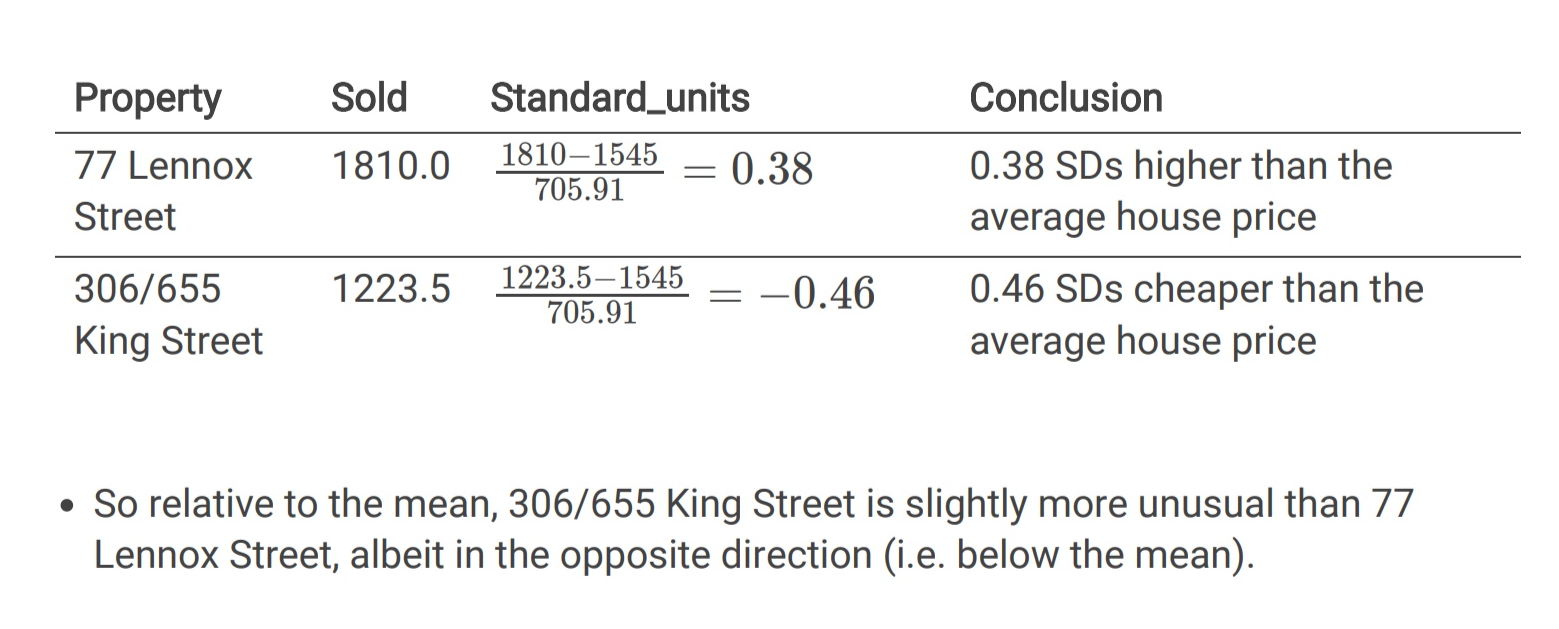
what is the z score
the standard units of a data point is how many standard deviations it is above and below the mean. standard units = (data point - mean)/SD (example given)
What does the IQR measure
spread. IQR = middle 50% of the data,
what is the coefficient of variation?
combines the mean and standard deviation into one summary CV = SD/mean
Changes to data, with mean and standard deviation (calculations)
Y = aX + b (Y = new dataset, X = old dataset with mean M and standard deviation S) ,
new mean = aM + b
New SD = aS
what does shifting the data change
changes the mean of the data
what does scaling the data change?
changes the mean and SD of the data