Module 1 Prelims & Final Quiz
1/24
Earn XP
Description and Tags
1A & 1B & Module 1 Quiz
Name | Mastery | Learn | Test | Matching | Spaced |
|---|
No study sessions yet.
25 Terms
Match each description to the correct term:
____a subgroup of the individuals of interest
____a value calculated using data from a subgroup of the individuals of interest
____a value calculated using data from all individuals of interest
____all individuals of interest
1. population
2. sample
3. statistic
4. parameter
2,3,4,1
Match diff sampling scenarios to proper sampling name:
To survey a sample of elementary school age students from a large school district, the district is split by schools. Then five of the elementary schools are randomly selected and all children attending these five schools are surveyed.
To survey a sample of elementary school age students from a large school district, all of the elementary students are put on a list and the sample is determined by selecting one at random from the top of the list and then selecting every 50th student on the list from that point on.
To survey a sample of elementary school age students from a large school district, the students are split into groups by grade level. Then a sample of 100 students is randomly selected from each grade level.
1. simple random sampling
2. cluster sampling
3. convenient sampling
4. stratified sampling
5. systematic sampling
6. voluntary response sampling
2,5,4
Match the different sampling scenarios to the proper sampling name
In order to try to find out the opinions of the student body at a university on a specific topic, a list of all students' names was randomly generated, and then the first 200 students on the list were surveyed.
In order to try to find out the opinions of the student body at a university on a specific topic, a survey was sent to every student's email address asking them to complete the survey.
In order to try to find out the opinions of the student body at a university on a specific topic, the student body was divided by ethnicity, and then 20 students from each ethnic group were randomly selected and surveyed.
1. simple random sampling
2. cluster sampling
3. convenient sampling
4. stratified sampling
5. systematic sampling
6. voluntary response sampling
1,6,4
Notice that in one situation, the students would have to voluntarily fill out the survey, in another situation, the students are put into groups prior to random samples being selected from every group, and in the last situation, student names are randomly selected to be at the top of the list.
Ann Landers once asked her female readers whether they would be content with affectionate treatment from men, with no sex ever. Over 90,000 women wrote in, with 72% asnwering "Yes." Why shouldn't we believe the results of this "poll"?
A. It was biased due to a voluntary response.
B. It was biased due to a small sample
C. The question was unclear.
D. It was quantitative data.
E. It was biased due to a leading question.
A. It was biased due to a voluntary response.
A survey asked working individuals who commute to work (1) How do you get to work? (some possible answers were: drive self in a motorized vehicle, car-pool in a motorized vehicle, mass transit, bicycle, walk, etc.) The survey also asked them (2) How long is your commute time in minutes? (3) What is an estimate of the cost of your daily commute in dollars? (4) Which is the more influential factor in your commuting decisions, time or cost? (5) How many days per week do you commute to work?
Identify the type of data produced by these five questions.
___How many days per week do you commute to work?
___How long is your commute time?
___How do you get to work?
___What is an estimate of the cost of your daily commute?
___Which is the more influential factor in your commuting decisions, time or cost?
1. qualitative (categorical)
2. quantitative (numerical) and discrete
3. quantitative (numerical) and continuous
2,3,1,3,1
Determine type of study:
A study compared vegetarians to nonvegetarians & determined tht vegetarians had 28% lower death rate from heart attacks & 37% lower death rate from cancer.
Individuals who experience migraine headaches were split into two grps by age; individuals over 50 in one grp & individuals 50 or younger in another grp. Within each grp, individuals were randomly assigned to either a meditation grp or a grp that received no treatment.
Researchers want to know if type of music students listen to affects their ability to retain info. Each student read a chapter from a history textbook while listening to pop. Then, same group of students read a different chapter while listening to classical . A test on each chapter was given, & the diff's in scores for the two chapters were determined for each student.
1.observational study
2.completely randomized design
3.randomized block design
4.matched pair design
1,3,4

A random sample of 80 postal customers' transactions were observed at a post office and the bar chart was created.
What type of graph is this?
A. stem and leaf chart
B. pie chart
C. bar chart
D. histogram
C. bar chart
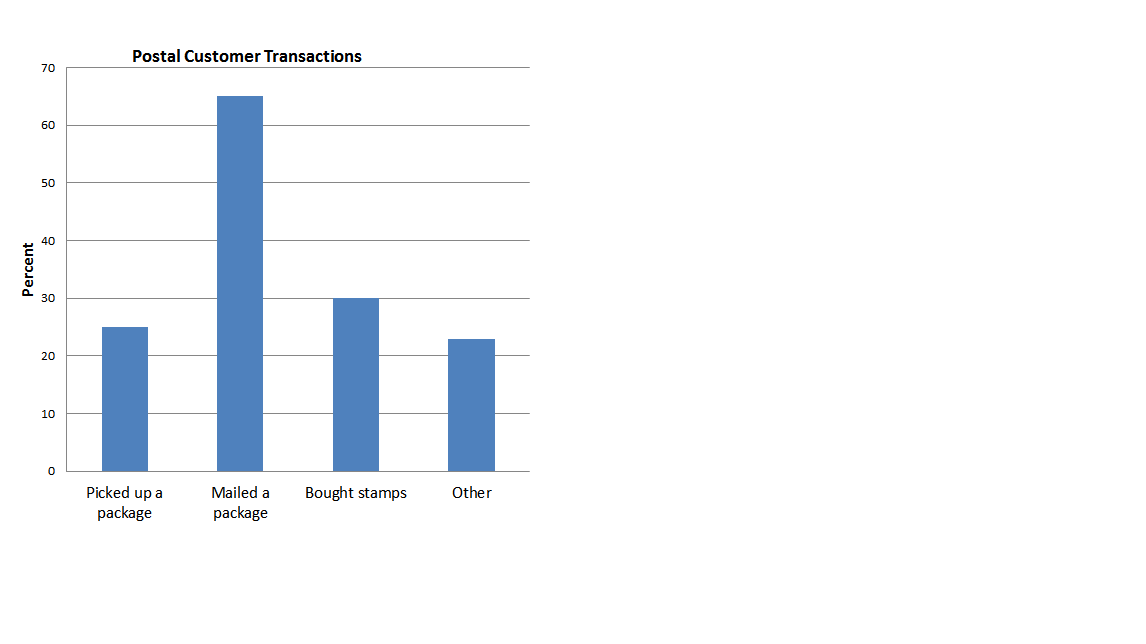
A random sample of 80 postal customers' transactions were observed at a post office and the bar chart was created.
Approximately what percent of these postal customers picked up a package?
A. 30
B. 20
C. 64
D. 25
D. 25

A random sample of 80 postal customers' transactions were observed at a post office and the bar chart was created.
Approximately how many of these postal customers mailed a package?
A. 64
B. 52
C. 80
D. 25
B. 52

The amount of time it took to complete a quiz was recorded for several students. The data is summarized in the histogram. How many students took more than 16 minutes to complete the quiz?
7

The amount of time it took to complete a quiz was recorded for several students. The data is summarized in the histogram. What percent of the students took at most 12 minutes to complete the quiz?
Round your answer to one decimal place if needed. Do not include the % sign in your answer.
52.5
The phrase "at most" is equivalent to "less than or equal to". If someone said they have at most $30, then they are saying they have no more than $30, which is $30 or less.
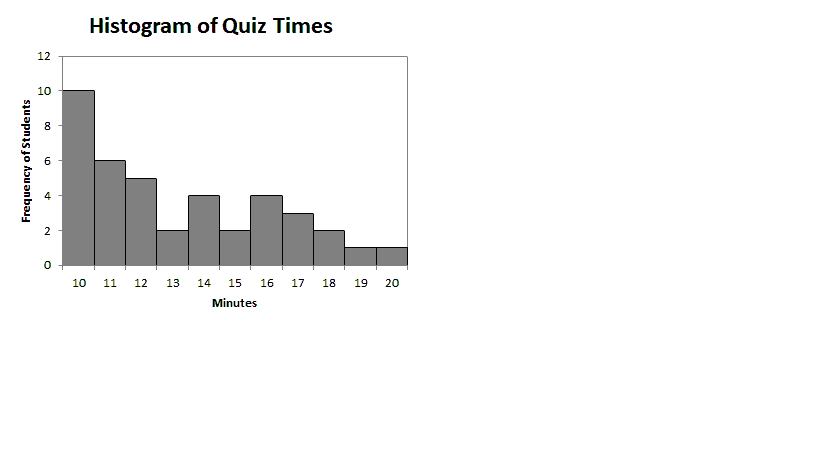
The amount of time it took to complete a quiz was recorded for several students. The data is summarized in the histogram. What percent of the students took at 14 or 15 minutes to complete the quiz?
Round your answer to one decimal place if needed. Do not include the % sign in your answer. (e.g. an answer of 96.436% would be entered as 96.4)
15
A question on a survey asked students how much time they spent on their school work per week.
The data from this question could be appropriately displayed with a...
Select all correct choices.
A. stem and leaf chart
B. histogram
C. bar chart
D. pie chart
A. stem and leaf chart
B. histogram
A question on a survey asked students which of their classes they spent the most time working on during the first week of school.
The data from this question could be appropriately displayed with a...
Select all correct choices.
A. stem and leaf chart
B. bar chart
C. pie chart
D. histogram
B. bar chart
C. pie chart
The following graph was created when 20 students graduating with a biology degree were asked what their final GPA was.
2 | 1 4 4
2 | 6 7 8 8 9
3 | 0 0 0 1 1 3 4
3 | 5 6 7 7 8
What percent of these students have a final GPA less than 3.0?
Do not include the % sign when entering your answer.
40
study was conducted to determine if children living in the upper Midwest who primarily eat organic foods were less likely to be diagnosed with ADHD than those who did not each organic foods. The study was conducted by randomly selecting 1300 middle school and high school aged children from the Detroit and Chicago areas. The study then determined if these children primarily ate organic foods or not and whether they had been diagnosed with ADHD or not.
Which of the following best describes who the target population is for this study?
A. all children in the upper midwest
B. all children in Detroit
C. children in the upper midwest who do not eat organic foods
D. children in the upper midwest who eat organic foods
A. all children in the upper midwest
A study was conducted to determine if children living in the upper Midwest who primarily eat organic foods were less likely to be diagnosed with ADHD than those who did not each organic foods. The study was conducted by randomly selecting 1300 middle school and high school aged children from the Detroit and Chicago areas. The study then determined if these children primarily ate organic foods or not and whether they had been diagnosed with ADHD or not.
Which of the following best describes who the sample is for this study?
A. children in the upper midwest who do not eat organic foods
B. the children in the study who primarily eat organic foods
C. the children in the study who have been diagnosed with ADHD or ADD
D. the 1300 children selected
E. middle school and high school children in Chicago and Detroit
D. the 1300 children selected
A study was conducted to determine if children living in the upper Midwest who primarily eat organic foods were less likely to be diagnosed with ADHD than those who did not each organic foods. The study was conducted by randomly selecting 1300 middle school and high school aged children from the Detroit and Chicago areas. The study then determined if these children primarily ate organic foods or not and whether they had been diagnosed with ADHD or not.
What type of study is this?
A. observational
B. matched pair design
C. randomized block design
D. completely randomized design
A. observational
An elementary school was looking for feedback from the children's parents about a new disciplinary plan they were using in their school. Every parent was sent an email with a survey attached. After two months, the results of the surveys sent in by parents were reviewed. The results of this survey ...
Select the best statement.
A. would be subject to non-response bias
B. relied on voluntary responses causing a bias to exist in the data collected
C. both answers above are true
D. none of the answers above are true
C. both answers above are true
A sample of Margoni Apples is selected from an orchard of Margoni Apple trees. For each apple in the sample, the circumference is measured, the weight of the apple is measured, the location on the tree (top, middle or bottom of the tree) where the apple grew is noted.
Which of these variables are quantitative and continuous data? Select all that apply.
A. circumference
B. weight
C. location on tree
D. all of the above
E. none of the above
A. circumference
B. weight
The following graph was created when 20 students graduating with a biology degree were asked what their final GPA was, rounded to one decimal place.
2 | 1 2 2 3 4
2 | 6 7 7 8 8 9
3 | 0 0 1 3 4
3 | 5 7 7 8
What percent of these students have a final GPA less than 3.5?
Do not include the % sign when entering your answer.
80
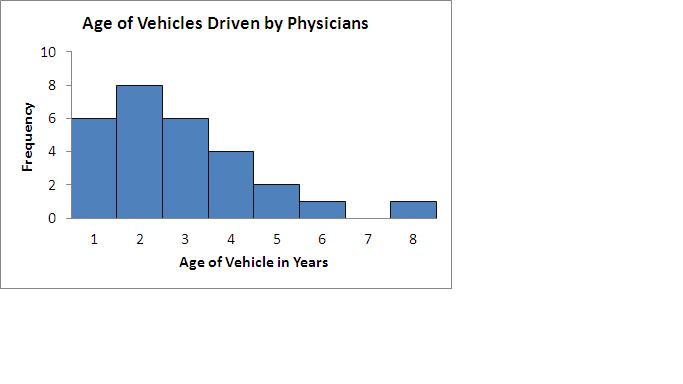
On a specific day, a random sample of 28 physicians were each asked how old their vehicle is that they drove to work. Their responses were recorded and the chart was created from the data.
How many of the physicians in this study drove a car that was four years old or older?
8
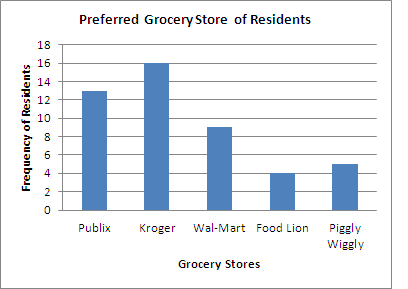
A random sample of 47 residents were asked which grocery store they prefer to shop at. The results were used to create a bar chart.
According to the bar chart, what percent of residents prefer to shop at Piggly Wiggly?
A. 21.3%
B. 5%
C. 14.9%
D. 10.6%
D. 10.6%
A farmer grows three different colors of the same type of apple: red, green, and yellow. As the apples are picked they are placed into large buckets and transported to a truck. To check on the quality of the apples grown, twenty five apples in the next bucket of apples delivered to the truck were inspected.
What type of sampling best describes this process?
A. systematic sampling
B. cluster sampling
C. stratified sampling
D. convenient sampling
D. convenient sampling
At a large university, the chair of the biology department wanted to know what percent of the students taking the introductory biology course were going to pass with a grade of C or higher. Prior to the end of the semester, one professor, after looking at the grades of the 55 students in her course, estimated that 74% of them were going to pass with a grade of C or higher. After the semester ended, it was determined that of all 685 students taught by the seven professors teaching introductory biology, 71.2% of them passed with a grade of C or higher.
Identify the statistic and the parameter in this scenario.
|
|
3,1